
Bitcoin to $40,000 in November?
Bitcoin is moving like a sawtooth: up, down, repeat. After a 50% surge from the 1 July bottom, the shallow pullback looked healthy. Now the moment of truth has arrived: another leg higher, or a brutal correction first?

Financial markets have been jittery for months, with a handful of issues taking turns in the spotlight: war in the Middle East, high energy and commodity prices, stubbornly high inflation and how central banks respond to it, high bond yields and what they mean for government debt and budget deficits, and the AI hype, along with the question of whether that bubble is about to deflate.
Friday 16 October and Thursday 22 October were rough days. Two issues are now front and centre. The first is the fear of an AI debacle. The million-dollar question is whether the massive investments in AI infrastructure will pay for themselves fast enough. You can see this playing out in share prices all along the chain of AI labs → hyperscalers → AI infrastructure.
The second issue is the war in the Middle East. Rumours of a peace deal and of large-scale escalation alternate within the space of a single day. The latter now seems to have the upper hand. Israel and the US are gearing up for new strikes, and the oil price is 15% higher than it was two weeks ago.
It's not easy to navigate. What do stock prices still tell us when only a handful of companies are keeping the index at all-time highs? What do macroeconomic figures still tell us when AI is fundamentally reshaping the labour market and business models? And all this in precisely the year that the US Federal Reserve has dropped forward guidance, leaving the market to its own fantasies.
It's striking that bitcoin has held up well in these conditions so far. In August bitcoin jumped from 60k to 80k, and in September we could tick the first boxes with a weekly close above the 50-week average and a higher high (HH) above $83,000.
After a 50% rally from the bottom, a serious correction wouldn't be unusual. Yet the price hasn't fallen more than 9% from the top at $87,300. We haven't even seen a weekly close below $80,000.
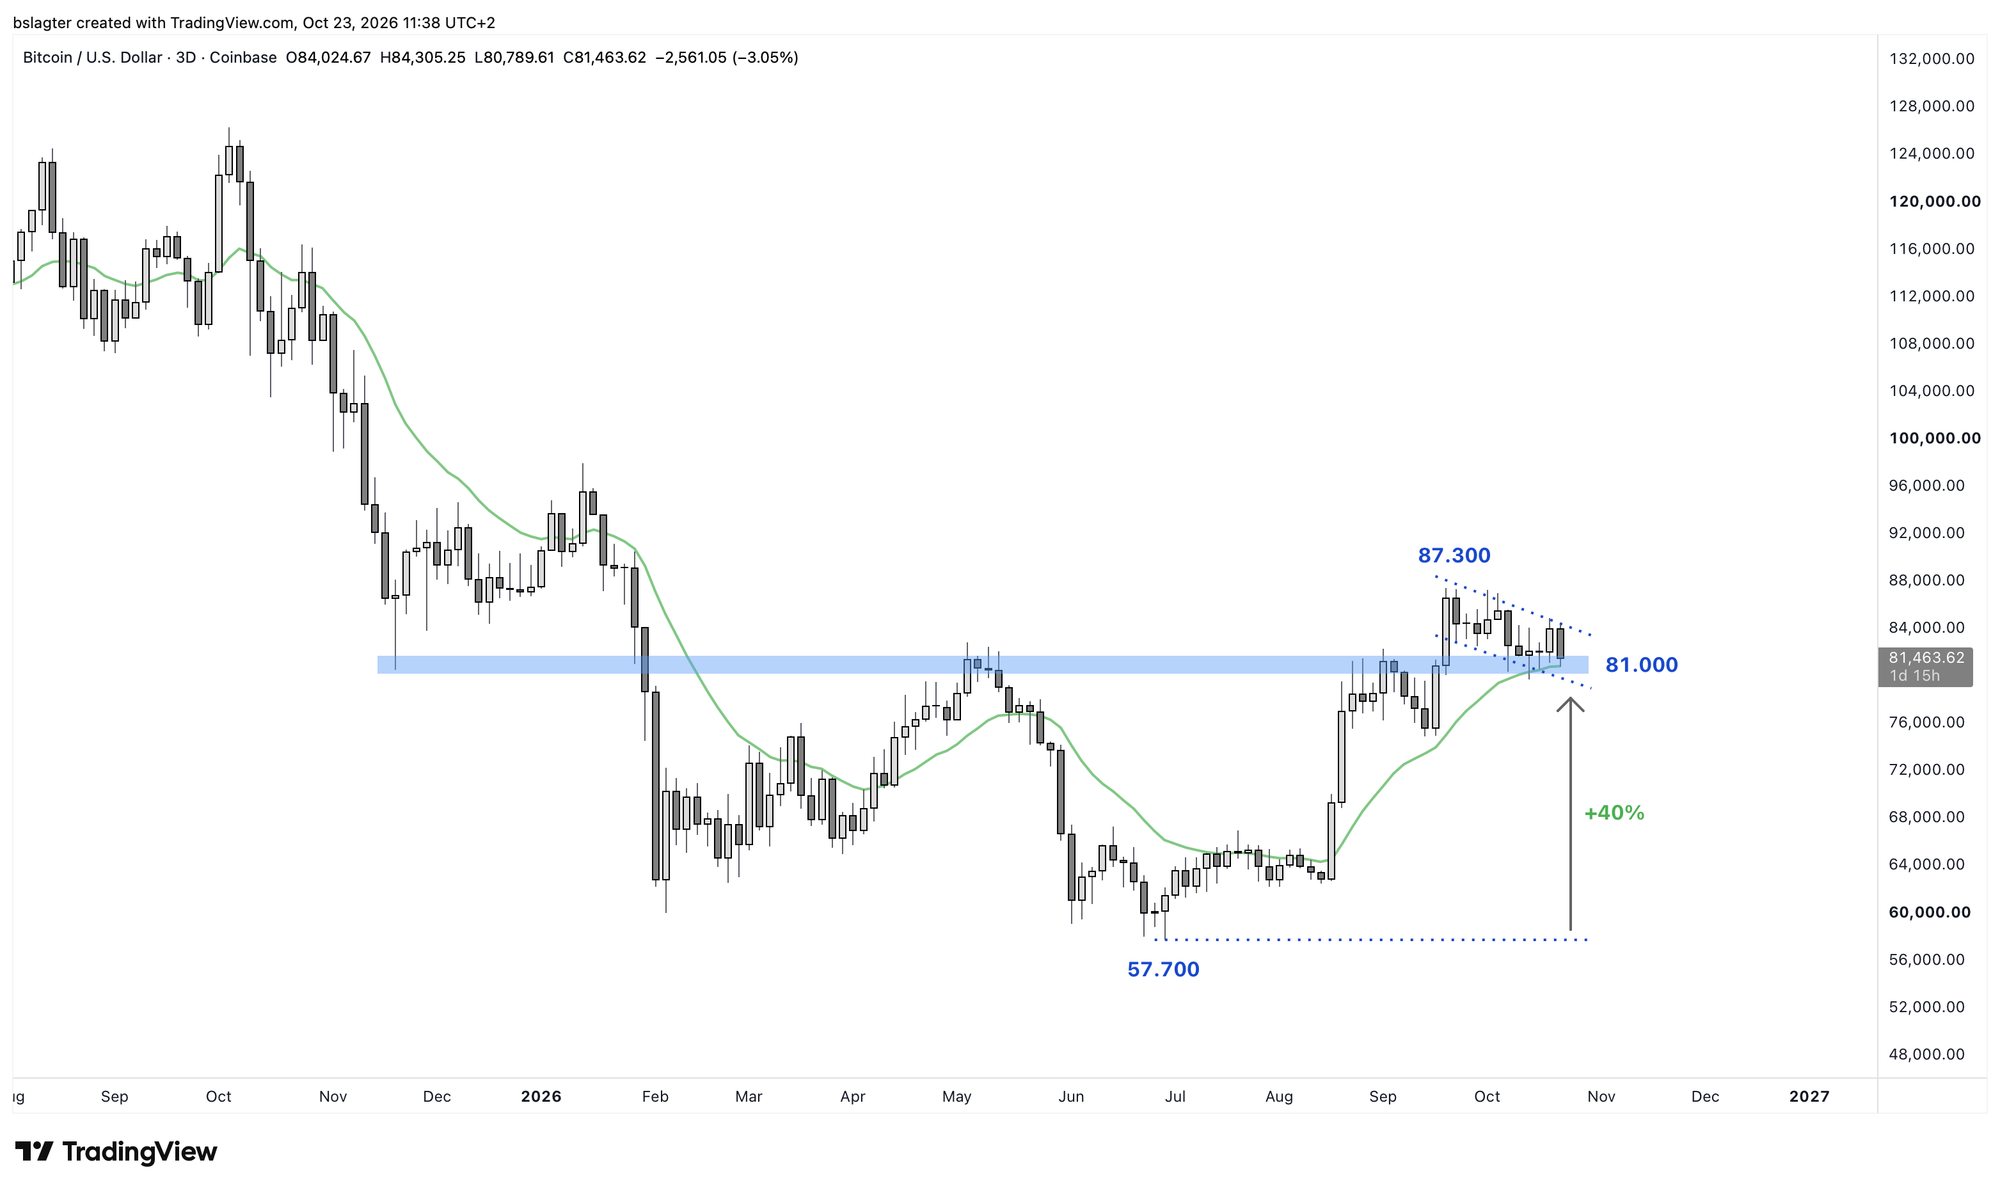
Over the past few weeks bitcoin has undergone a ‘correction through time’ and has now arrived at a key juncture. It's high time to pick a direction: a new leg up, or a deep correction first?
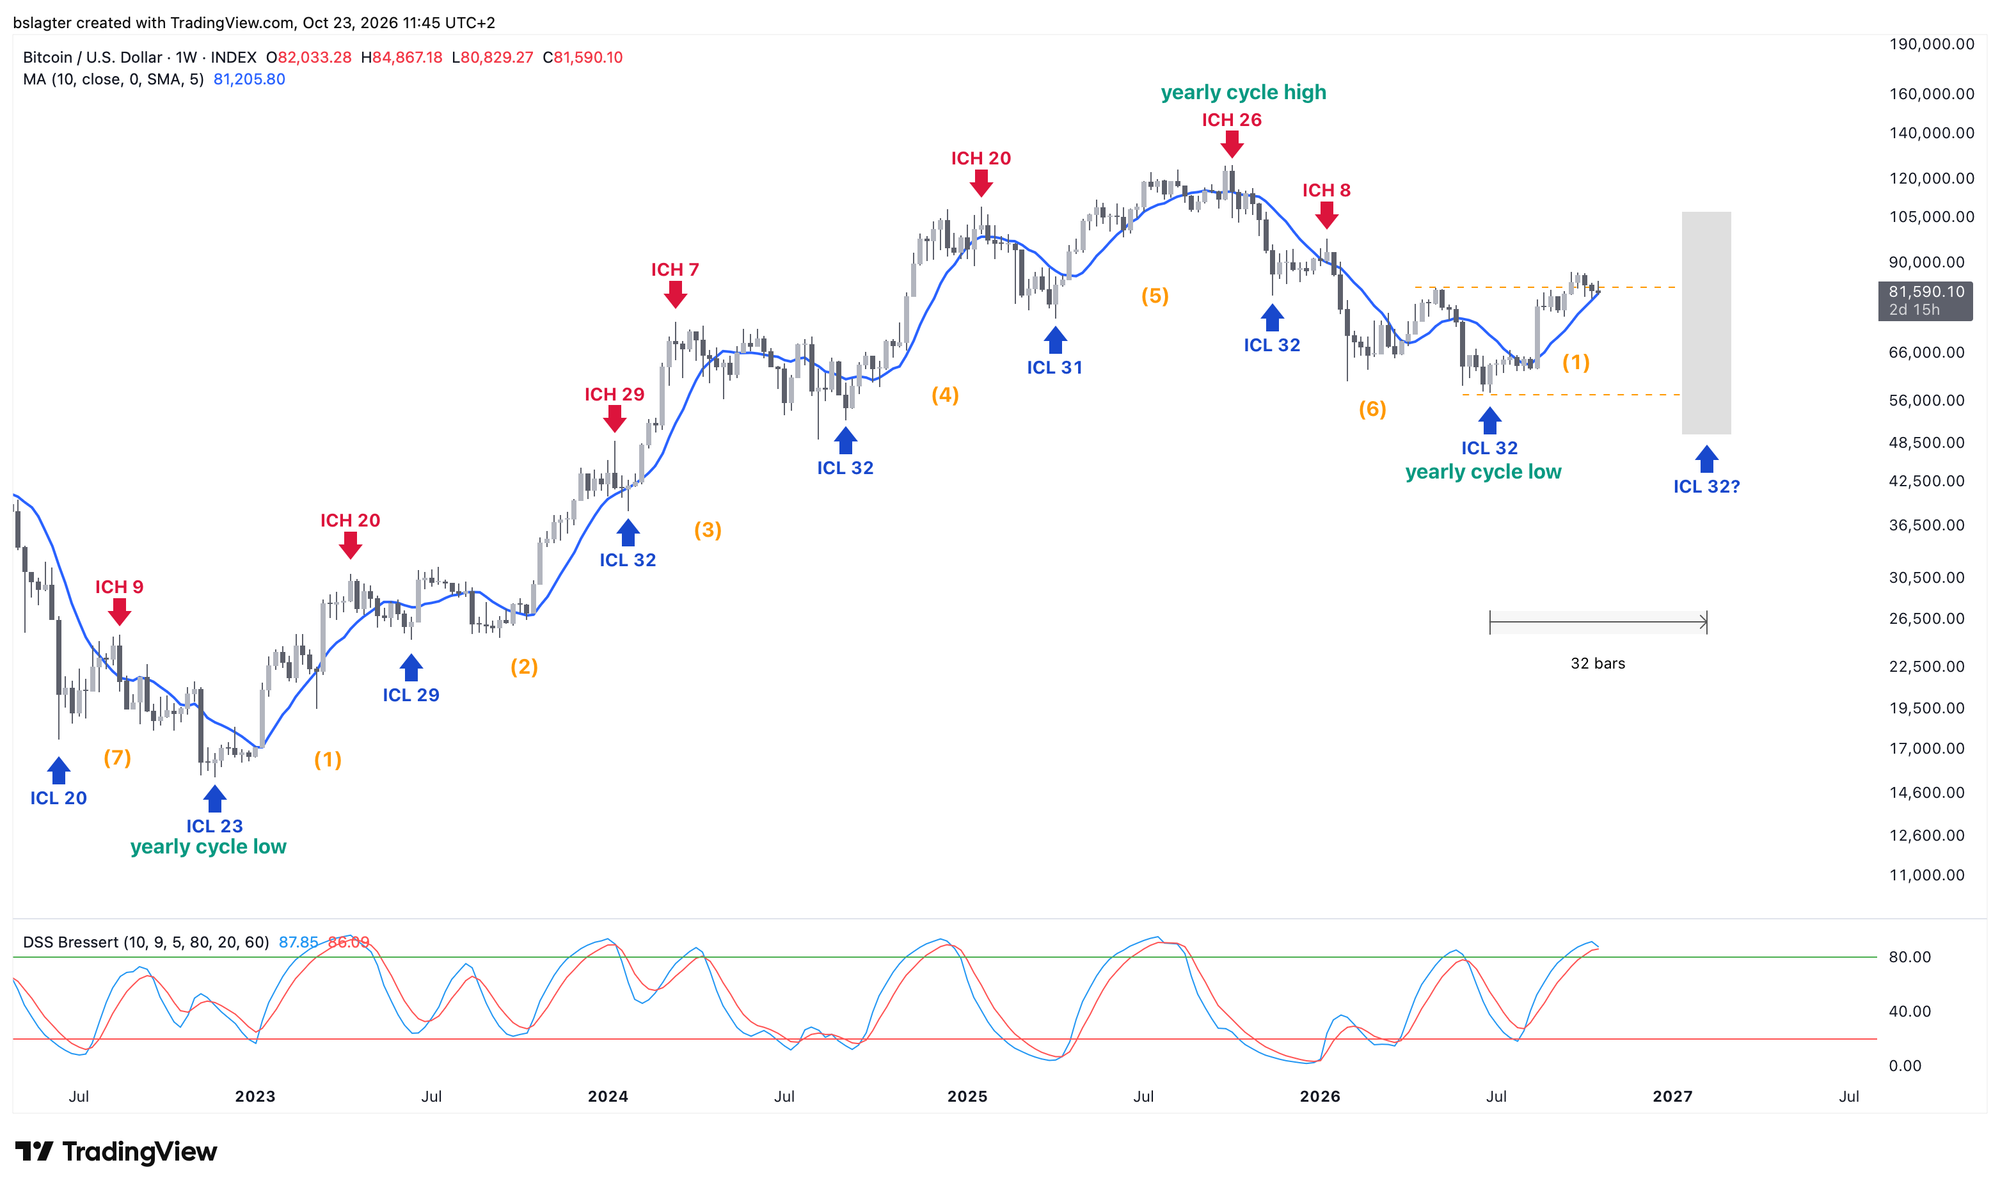
It's not just the $81,000 level that matters here, but also the passage of time. That's best viewed through the lens of cycle analysis. Let's pull up the weekly & daily cycle.
On the weekly chart, price touched the 10-week average at $79,300 last week and closed a little higher at $82,000. From the perspective of the weekly cycle, that's neutral.
- From here, a new period of gains could begin, the last one of this weekly cycle. In that case, we'd interpret the past few weeks as the mid-cycle slowdown. This is the most common variant.
- From here, price could dive below the 10-week average and begin the decline towards a weekly cycle low (ICL). That would be fairly early, which fits less well with an early bull market.
The oscillator at the bottom hints that strength needs to return to the market fairly quickly to back up the positive variant.
Like crypto, bonds, equities and precious metals are in a fragile market situation. Confidence and optimism are slowly ebbing away. In that light, it's remarkable that Trump has chosen this very moment to start spouting war rhetoric about the Middle East again. Hardly great timing, so close to the midterm elections on 3 November.
Perhaps Trump has resigned himself to a heavy defeat. Polymarket gives a 93% chance that the Democrats take the House, and a 68% chance that they win the Senate as well. Well, if you've got nothing left to lose anyway, more ‘fuck around and find out’ can't be ruled out.
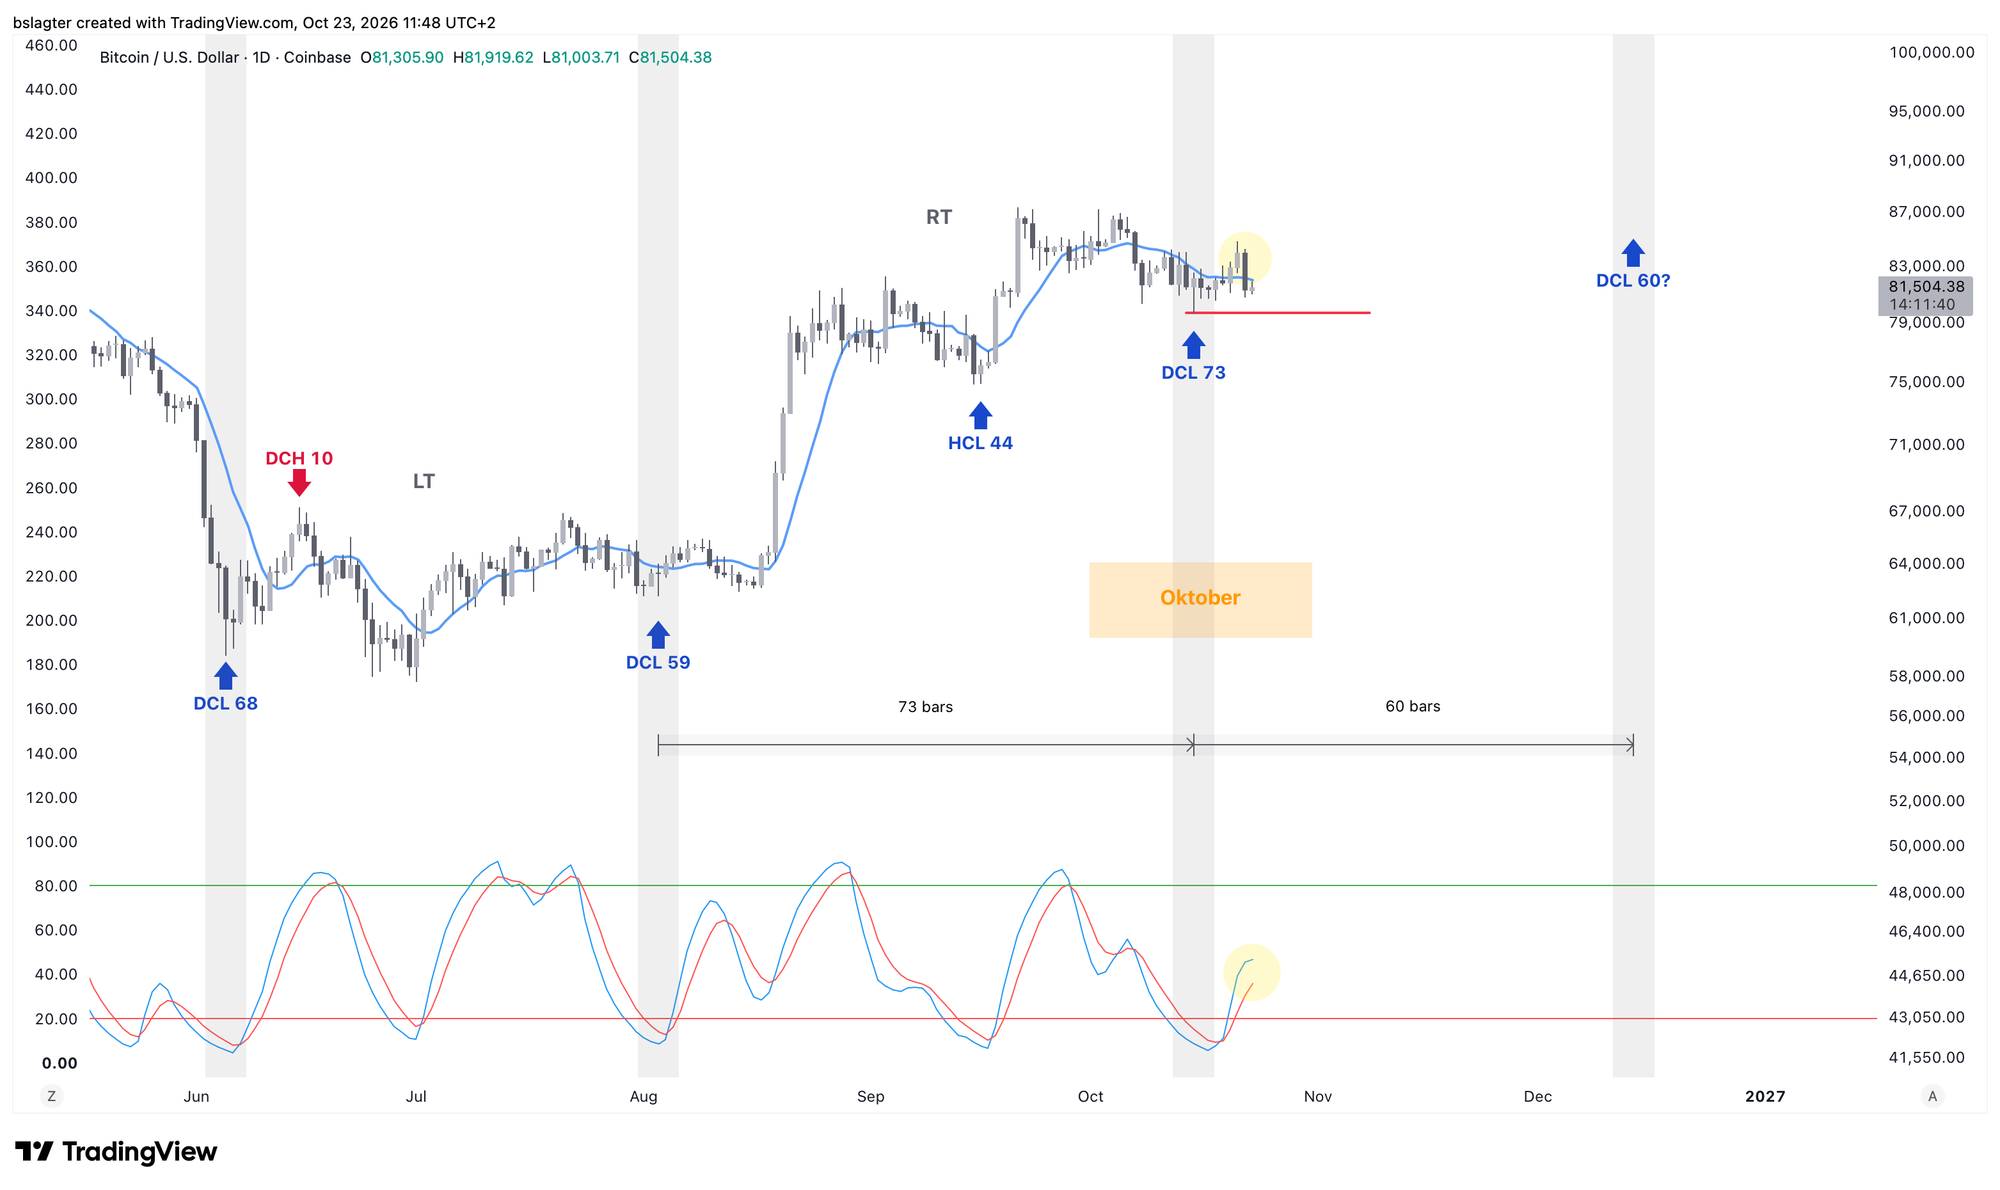
There's a good chance we've just started a new daily cycle for bitcoin. It looks very much like 15 October was a daily cycle low (DCL). That would put us on day 8 of an average 60 days.
Bob Loukas had this to say on X:
Bitcoin appears to be confirming the new cycle here. These events provide a really clear and clean setup.
The upside target is around 30 to 45 days, room for a good advance. It is however not guarantee of a major upside move, but provides an excellent anchoring point because a loss of the recent lows ($79,600) is a level where you would want to get very defensive.
In principle, you'd now expect another 3 to 5 weeks of strength towards a top in late November or early December. There's a decent chance that will also mark the top of the weekly cycle, or otherwise a slightly higher top early in the following daily cycle.
That sounds positive. But we're very close to the red line we mustn't break below, at $79,600. You can be generous and go by the daily close, but there's no defence against a barrage of missiles raining down on Iran.
Yesterday's drop is already a serious warning. The price closed below the 10-day average again and the upward momentum took a hit, as shown by the yellow markings on the chart.
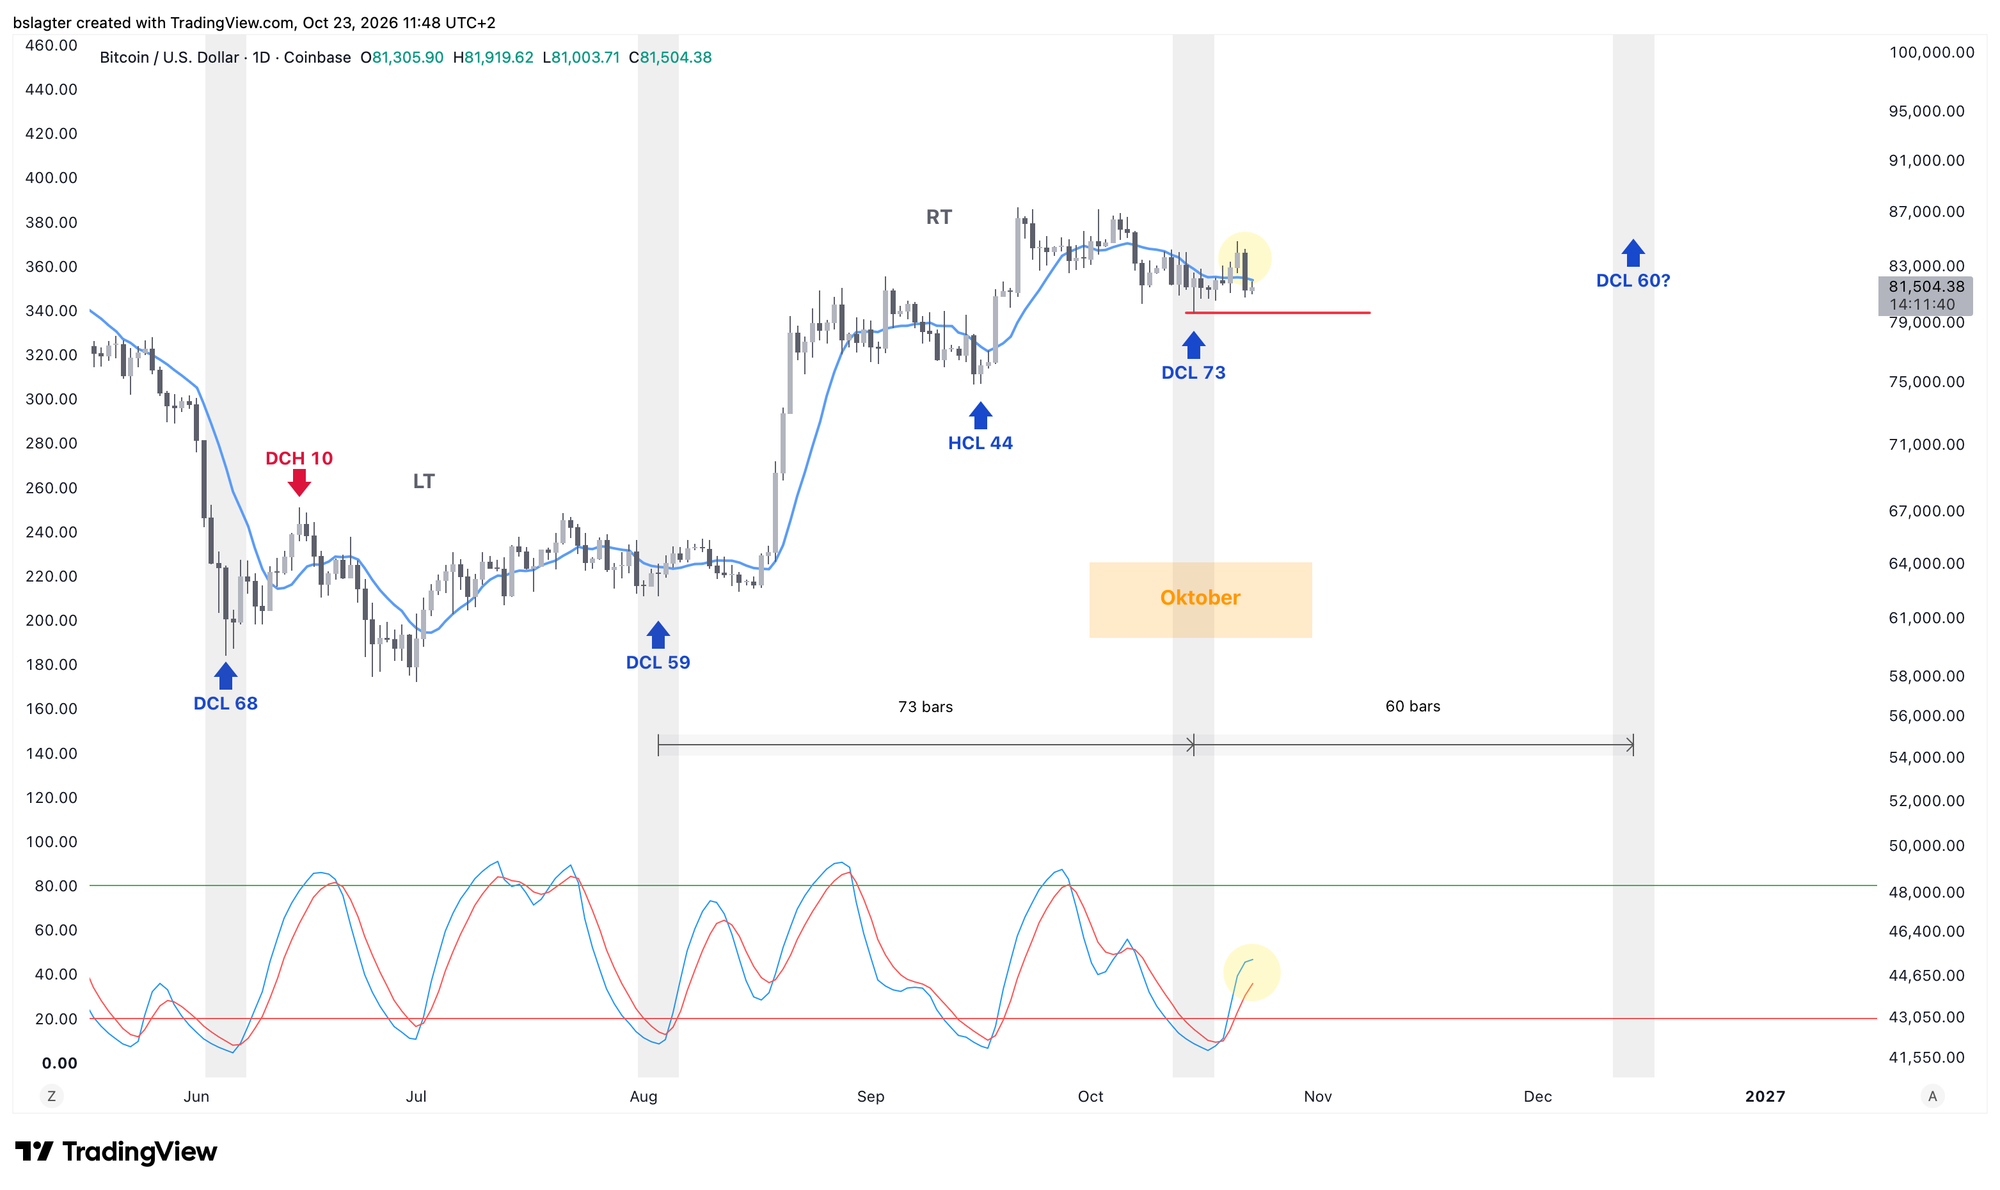
It's time to pick a direction. The same goes for the tech-heavy Nasdaq 100 and chip ETFs such as SMH and SOXX. They're back at support levels we've seen many times over the past six months.
With that in mind, we're heading into two thrilling weeks. Alongside the ‘hot’ issues of Iran and AI, next week brings a rate decision from the US Federal Reserve, followed the week after by the US elections. One thing's for sure: it won't be boring!
We continue with the following topics for our Alpha Plus members:
- Bitcoin to $40,000 in November?
- Clarity over strength
- Waiting for a real stress moment
- Should the ECB stop quantitative tightening (QT)?
1️⃣ Bitcoin to $40,000 in November?
 Contribution by
Bert
Nobody can consistently tell you what tomorrow's price will be. Being roughly right a few times in a row is the best anyone can hope for, whether that's down to luck or wisdom.
The market is fundamentally unpredictable, as complex systems so often are. We can form a decent picture of the forces at work: investor sentiment and expectations, the macroeconomic regime. But the precise path, especially in the very short term, is incalculable.
That's why we work with scenarios and probabilities. The tails hold the black swans, both positive and negative. The body of the distribution holds the plausible scenarios. Often one of them stands out, and that becomes our base case.
Our base case right now is that we're at the start of a new bull market. In the Alpha Markets of 25 September, this was the distribution:
- A new bull market (green) — 80%
- A mild and prolonged bear market (yellow) — 15%
- A deep and prolonged bear market (red) — 5%
Along with this chart, which I've conveniently updated to today.
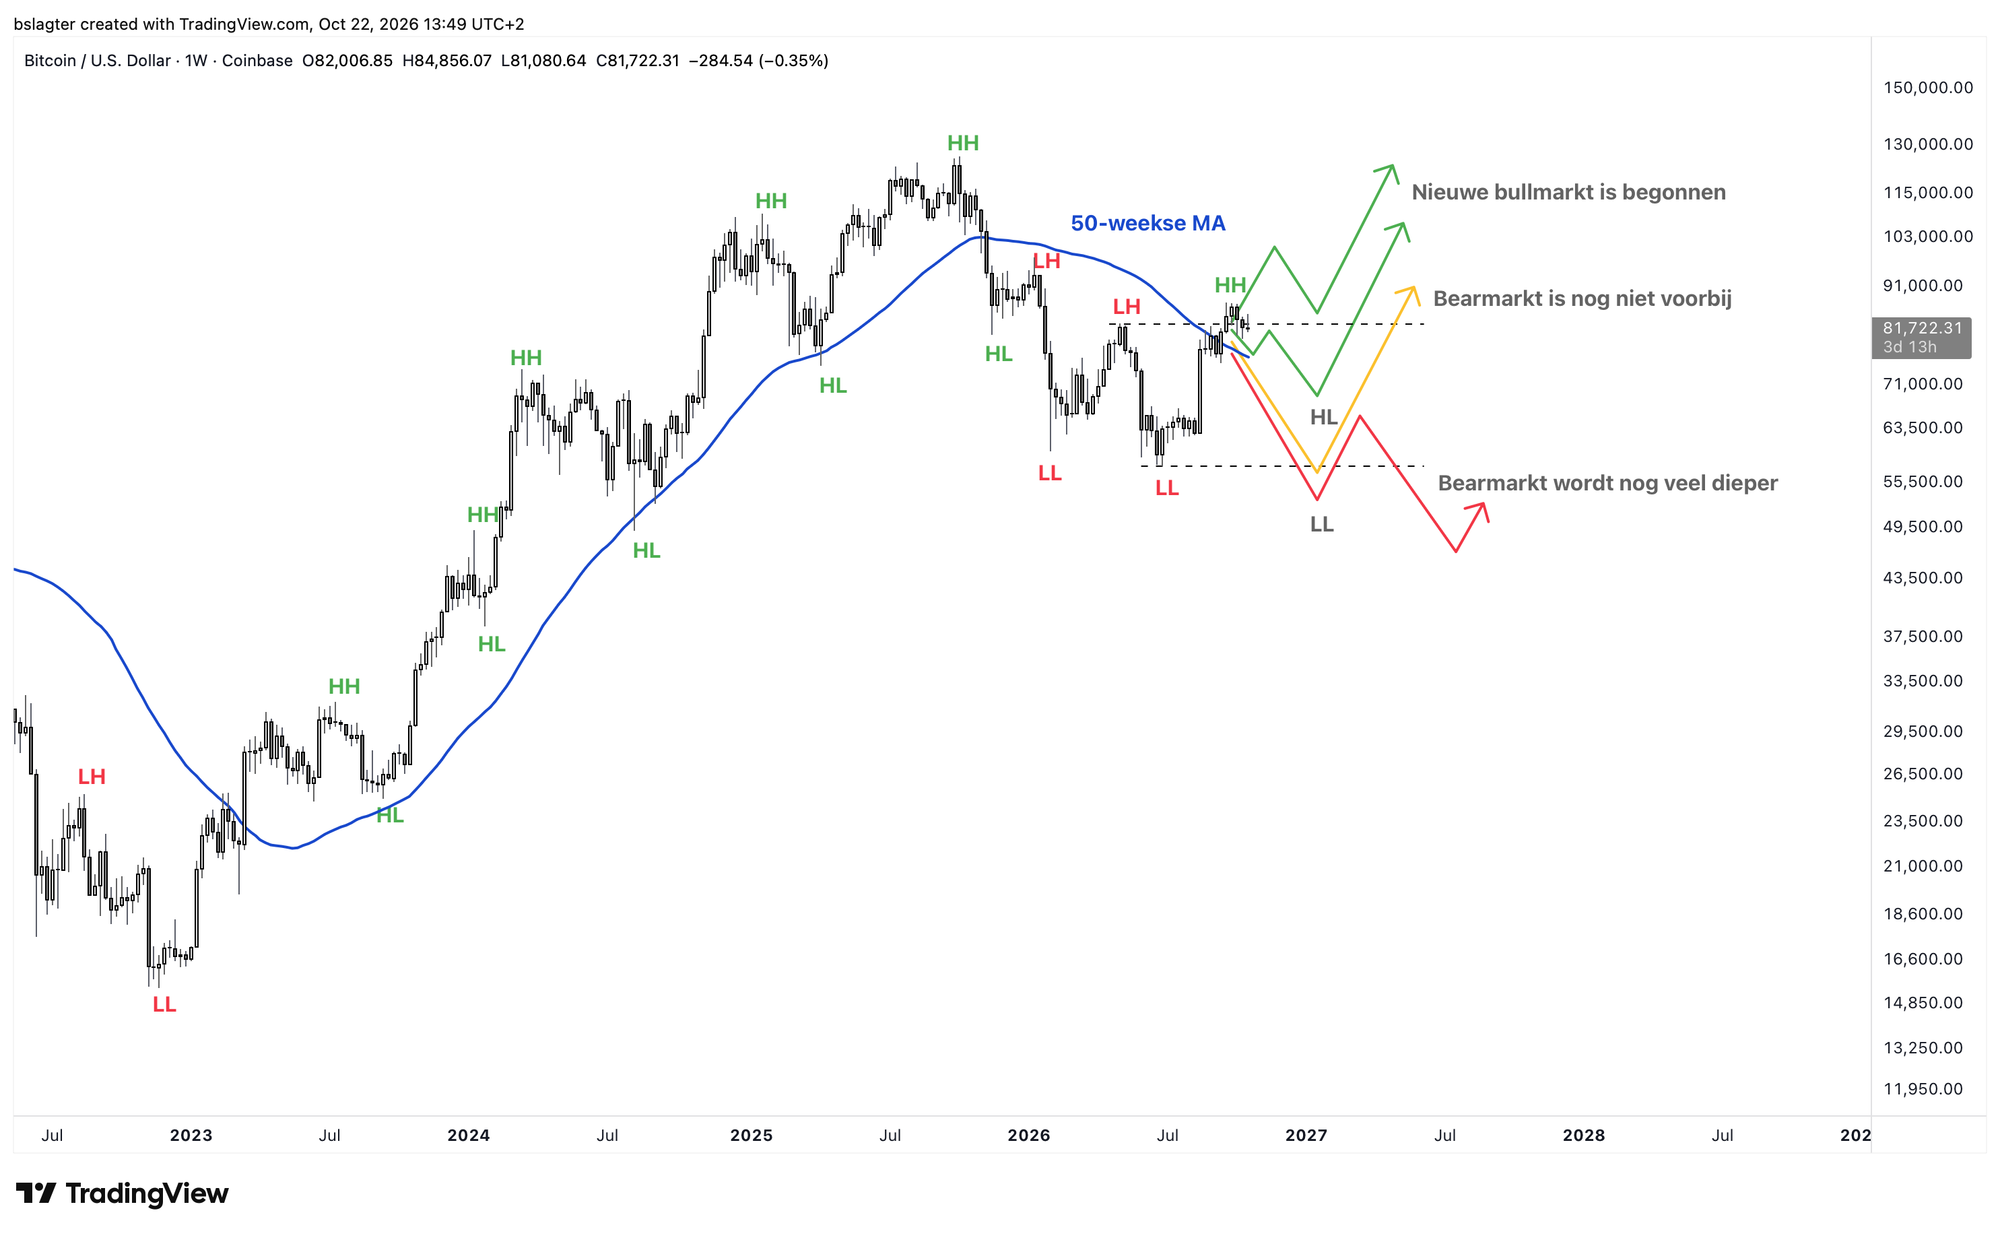
You could say we put the odds at 95% that we're now in the transition from a bear market to a bull market, with 80 points on a bottom in July and 15 points on a bottom in the fourth quarter.
Since then, we've mostly been talking about the base case. And we're not alone. Everywhere you look, investors and analysts are reasoning from the paradigm that we're in an early bull market.
Of course, there are analysts who are always predicting the imminent end of days. Permabears, as we affectionately call them. They're not much use: “a broken clock is right twice a day”.
Today I want to show you an example of an analyst who, using his own systematic framework, still arrives at a deeper low for bitcoin later this year. His background is in precious metals and commodities, he uses a variant of cycle analysis, and he now regularly covers bitcoin as well.
Here's what he says about bitcoin on X:
Bitcoin. Now that everyone and their mother is sure it's come and gone, we're looking for the final decline to the 4YCL. Most likely aligns with the yearly cycle low for Gold.
Accompanied by the chart below, showing a bottom for bitcoin around $44,000 in mid-November. He sometimes also looks at the bitcoin-to-gold ratio, which led him to a bottom at $40,000.
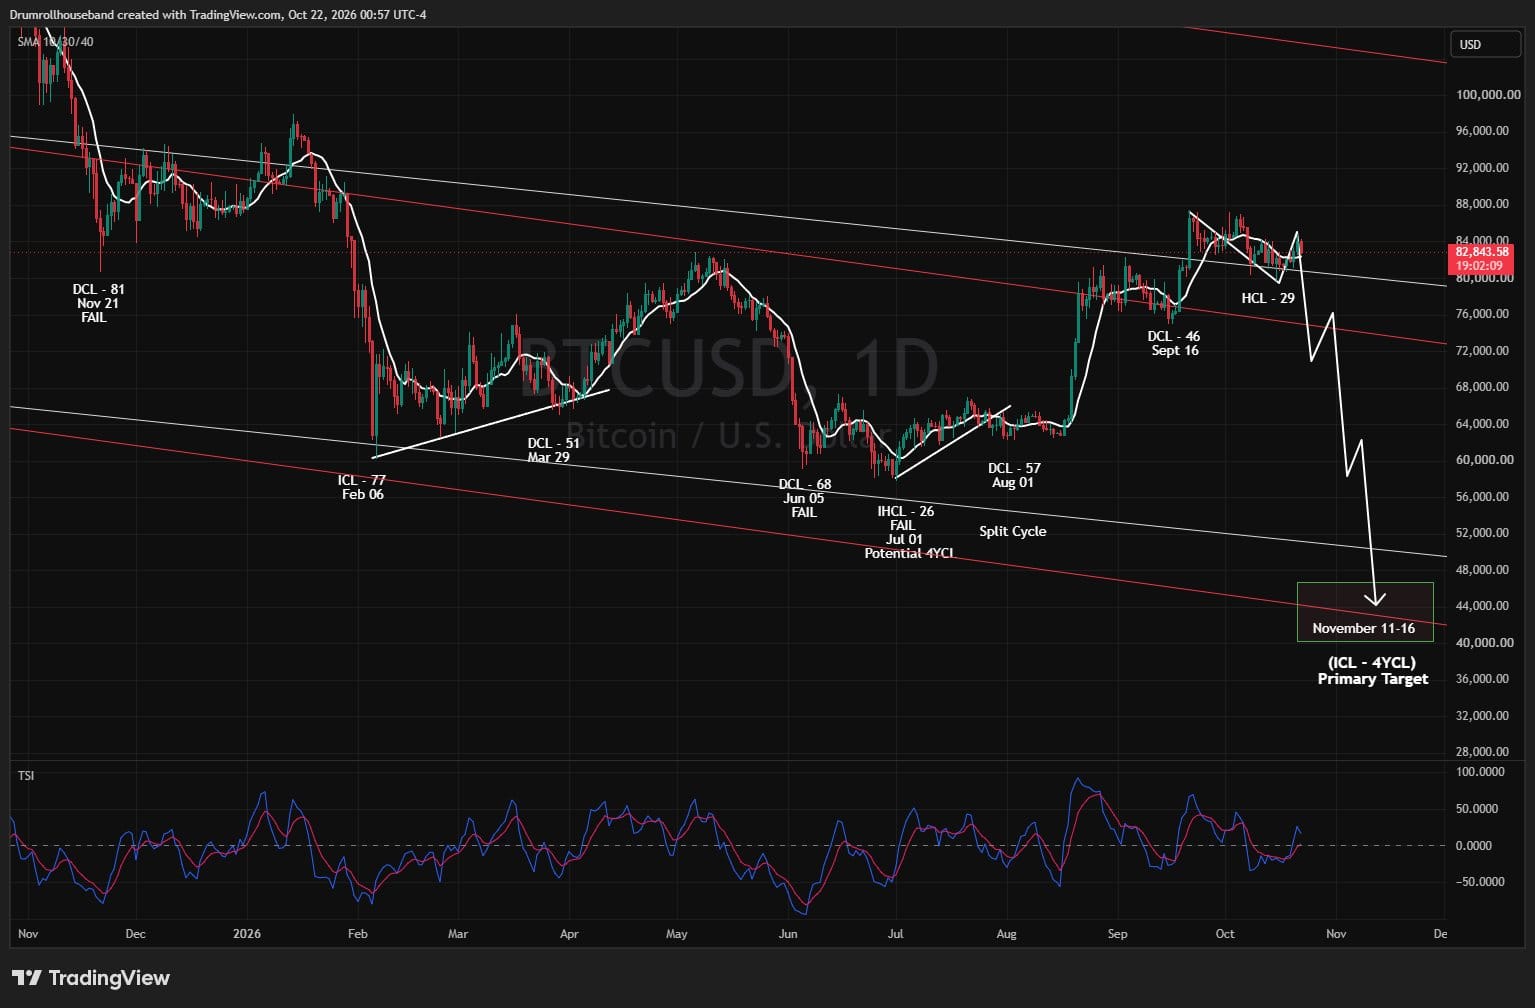
If you lay all the data on the table, rather than relying on a single method, I don't think this is the most likely scenario. But it is possible. It would even fit perfectly well within “we're now in the transition from bear market to bull market”.
A drop from 80k to 40k doesn't match the supply and demand dynamics we're currently seeing in the bitcoin market. It would take a shock. A serious escalation in the Middle East. An acute crisis in the bond market or the banking sector. An accident in the AI trade. A large-scale disaster caused by a cybersecurity incident.
Any of those could easily happen. It's not even a black swan, at most a grey one. After all, we're discussing it here, and it doesn't sit in the tail of the distribution but squarely in the body. It's the 15% of the second scenario.
It's worth mentally walking through this scenario every now and then, especially at a time when Wall Street is embracing bitcoin and everyone is upbeat about its relative strength. What do you do if this happens? Do you sit tight? Buy more? Panic? Do you have an exit somewhere? In short: have a little plan!
Personally, if this happens, I'll hold on to the bitcoin in my long-term portfolio, and there's a good chance I'll even add some. For the traders among us, you could treat 79.6k as the line to exit or go short. Price shouldn't break below it during this daily cycle. If it does? Then the short-term outlook has turned a fair bit gloomier.
2️⃣ Clarity over strength
 Contribution by
Sam
Given the crypto market's high volatility, it's all the more important to understand the risks and plan for them. Those risks differ for every investor and every time horizon.
There's the investor with a multi-year horizon who sees bitcoin going either to zero or to a million, and is prepared to lose their entire stake. Then there's the investor who doesn't trade actively but mainly wants to ride most of the bull market and sidestep most of the bear market. These investors could, for example, use the oft-mentioned handbrake.
And then there's a category that trades more actively, without needing to watch prices every day. Many altcoiners fall into this group. After all, recent years have shown that many altcoins only perform well for a limited period before giving back all of their gains (and often more).
There's nothing wrong with wanting to ride the latest ‘hot’ narrative with prices going parabolic. But it's important to realise that the risk of a hefty loss is far greater, and in some cases your entire stake can evaporate. Think of Luna in May 2022.
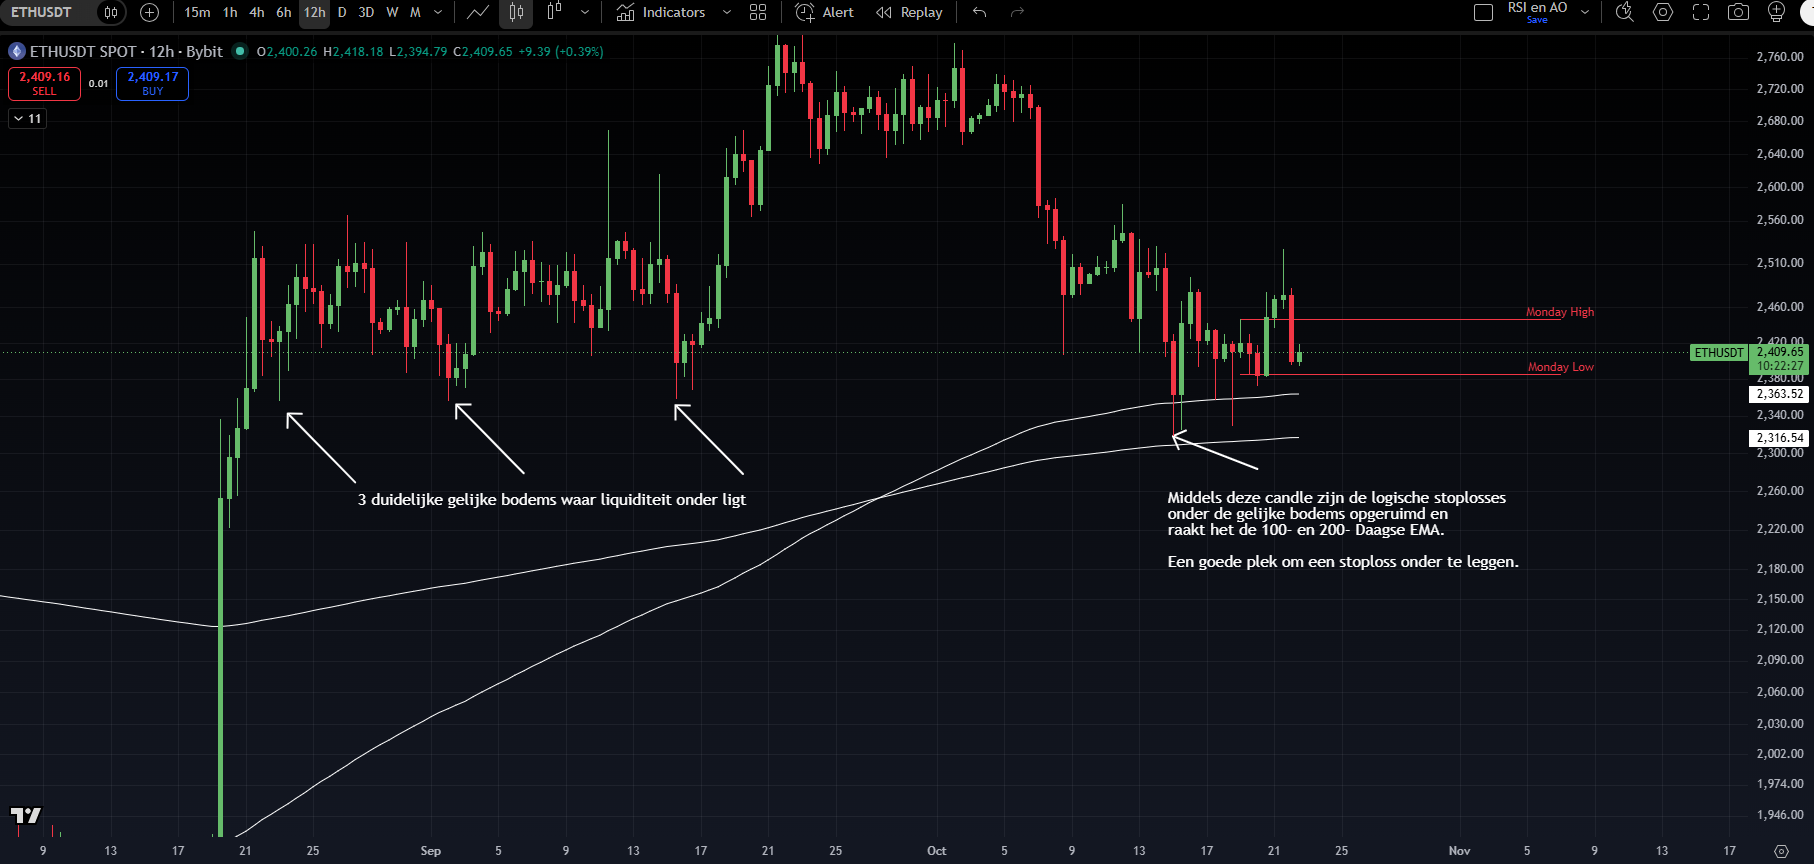
One way to protect yourself is with a stop-loss. This is a special type of order placed below the current price; once the price drops to that level, the position is sold. The downside is that the price can shoot right back up after your stop-loss is hit, but a very important upside is that it protects you against an unexpected shock, such as a protocol hack or some other black swan.
Finding a good stop-loss level is quite tricky. You can keep it simple and say that, for example, a 10% drop is the most you're willing to lose, but you can also base it on the chart.
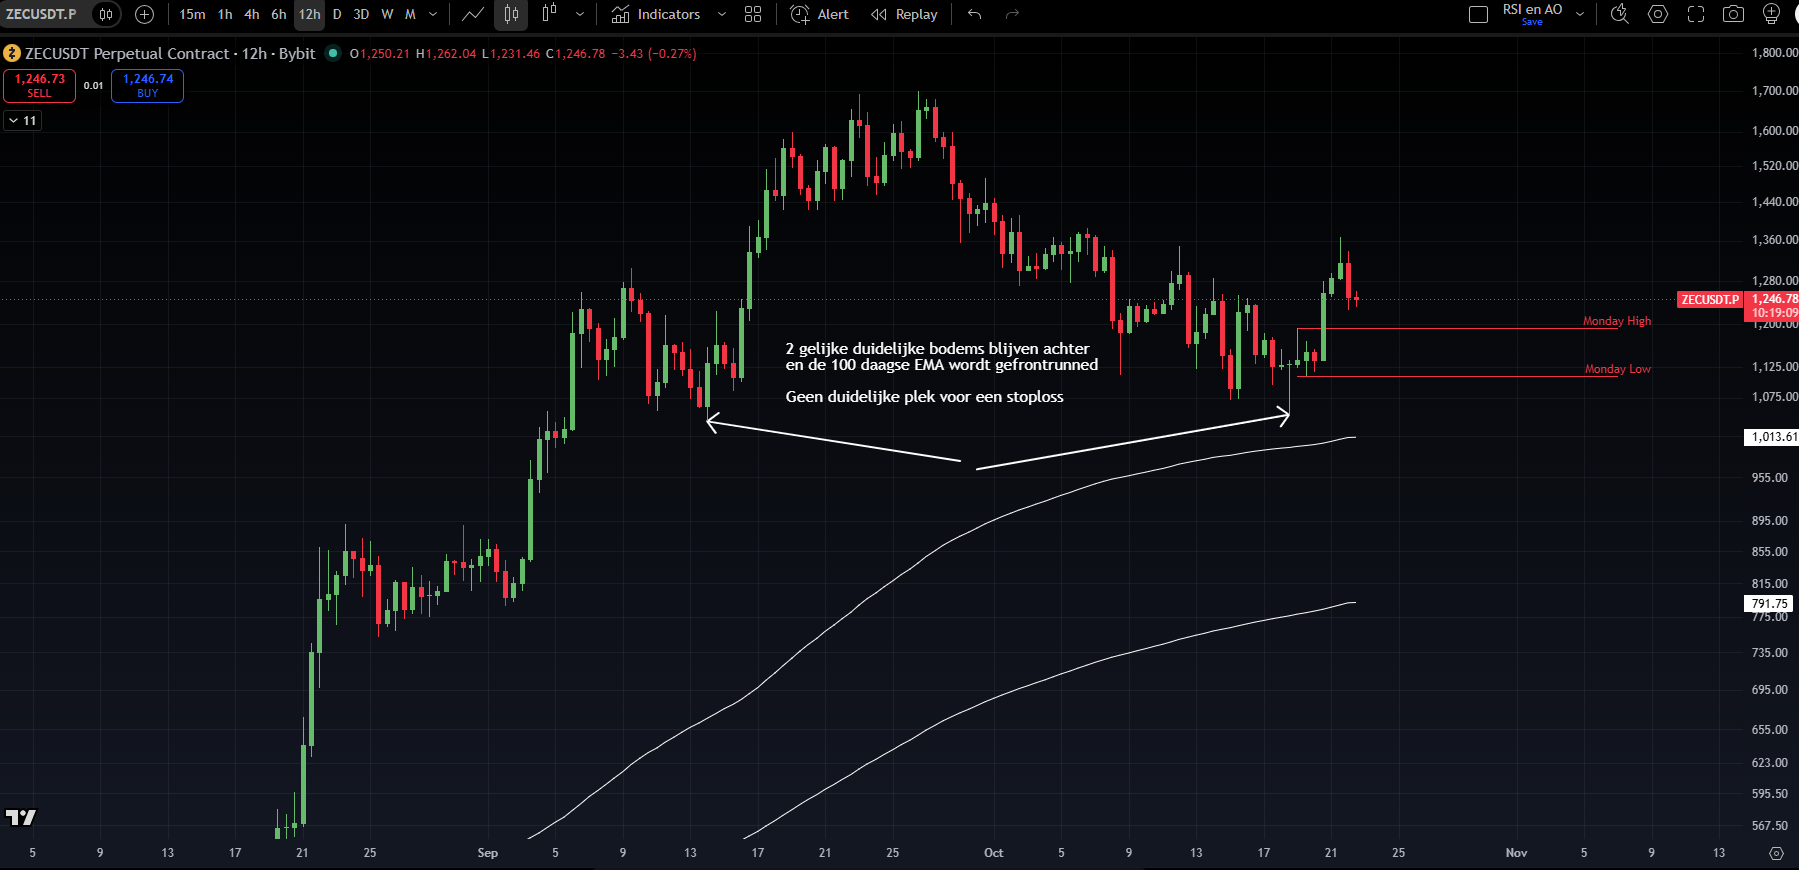
Below are two examples in which the weaker coin (ETH) can actually be a better buy from a risk management perspective than the clearly stronger ZCash (ZEC). Whereas ETH has done the “work” at the bottom by sweeping liquidity and tagging an important EMA, ZEC offers no clear spot to place a hard stop-loss.
A common choice is to place the stop-loss below the equal lows at $1,050. The main problem is that if that stop-loss gets hit, it's precisely the ideal spot for many traders to look for exposure.
So while picking the weaker sibling over strength may seem illogical at first glance, in some cases it can actually be the better choice when it comes to protecting your capital.
3️⃣ Waiting for a real stress moment
 Contribution by
Thom
Anyone looking at financial markets right now might well get the feeling that we're waiting for a major shock: a moment when tensions in the financial system run so high that a serious liquidity problem breaks out somewhere.
In that kind of scenario, financial markets can spiral downwards at lightning speed. Investors are forced to sell positions and virtually all assets fall at the same time. It's the kind of stress moment when everything that normally moves independently suddenly heads in the same direction.
- South Korea's Kospi index is falling almost daily due to excessive leverage, and that now seems to be spilling over into other markets.
- Doubts about the financing side of the AI investment cycle are growing. Credit spreads for companies like CoreWeave are blowing out, with bond yields recently jumping to 16%.
- As if that weren't enough, the world also has to contend with Brent crude at over $110 a barrel, with no prospect of a swift peace between the United States and Iran.
- Even strong quarterly earnings are no longer enough to propel stock markets to new highs.
- Global bond yields have surged in a short space of time. French yield stress is nearing boiling point, and the spread with Germany keeps widening.
From this perspective, I don't find it surprising that the bitcoin price recently struggled to break through the $87,000 level and has since dropped thousands of dollars again.
Right now, from a fundamental standpoint, I see no reason to expect a rapid rise. On the other hand, it's encouraging that bitcoin is holding above $80,000 despite these macroeconomic headwinds.
And you could argue that the situation is such that there's mostly room for financial conditions to improve.
With the caveat that while the financial system is under stress, we haven't yet seen an ultimate stress peak. Under current circumstances, I wouldn't rule one out.
That could deal the bitcoin price a heavy blow. The question, however, is how much of a disaster that really is. We tend to get very worked up about short-term price moves, while most people are investing for the next 10 to 30 years, which makes those daily swings not all that relevant.
In my view, we've come to attach so much importance to them mainly because of “Wall Street”, since it genuinely matters for fund managers. They have to convince capital every single day to stay on board or come join them.
For ordinary investors, though, it's really no big deal if prices fall for a while. It's a shame, of course, but as long as the investment case for the asset in question hasn't deteriorated, it's essentially fine.
I don't think the investment case has deteriorated here for bitcoin. Should an ultimate stress moment arrive, it will most likely be resolved through money creation. And that's exactly why I own bitcoin.
4️⃣ Should the ECB stop quantitative tightening (QT)?
Contribution by Thom
Long-term bond yields have risen sharply over the past few months in virtually every developed economy. Europe in particular is looking increasingly worrying. The French ten-year yield has now climbed above 5 percent, while the spread with Germany keeps widening.
These developments bring back memories of the 2012 euro crisis, when investors lost faith in the fiscal sustainability of several European countries.
This week I came across a Financial Times article by Lorenzo Bini Smaghi, a former board member of the European Central Bank (ECB). In his view, the ECB is making the situation needlessly more dangerous by continuing to shrink its balance sheet.
First, of course, because the market is forced to absorb more government bonds now that the ECB has stepped away as a buyer. But I find his second argument perhaps even more interesting: with this policy, the ECB may be making banks more vulnerable to the consequences of those very same rate rises.
Why?
Since the 2008 financial crisis, banks have been required to hold much larger liquidity buffers. These consist of, among other things, reserves held at the ECB and government bonds.
But there's an important difference between the two. Reserves are money that's available immediately. Government bonds can lose value and first have to be sold or pledged as collateral to raise cash.
And that, according to Bini Smaghi, is where the problem lies.
As the ECB shrinks its balance sheet, reserves gradually drain out of the banking system. Banks can compensate by buying more government bonds, since those also count towards their mandatory liquidity buffers.
Banks can also use those government bonds as collateral to borrow from the ECB if needed. The result is a situation in which banks hold more and more government bonds to replace their vanished reserves.
And that's not without risk, because those very government bonds can lose significant value when yields rise.
Take a French bank holding lots of French government bonds. When investors start worrying about French government debt, yields rise and the value of those bonds falls. That in turn can weaken the bank's financial position.
If the bank gets into serious trouble as a result, the French government may have to step in. That costs the government extra money, which can further fuel concerns about French government debt.
In this way, problems at banks and governments can feed off each other. That exact dangerous feedback loop also played a major role during the 2012 euro crisis.
The ECB wants to shrink its balance sheet to get back to a more normal situation. But the financial system has fundamentally changed since 2008. Banks have to hold far larger buffers and therefore have a structurally greater need for safe, immediately available liquidity.
By continuing to run down those reserves, the ECB may be nudging banks into taking on more interest rate risk through government bonds. And this at a time when European bond markets are already under heavy pressure.
The paradox, then, is that the ECB is pursuing a policy that can drive bond yields even higher, while that same policy can leave banks more exposed to the fallout from higher yields.
In closing
All previous editions of Alpha Markets are available in the archive. Questions, comments and suggestions are always welcome in the community.
Thank you for reading!
To stay informed about the latest market developments and insights, follow our team members on X:
- Bart Mol (@Bart_Mol)
- Peter Slagter (@pesla)
- Bert Slagter (@bslagter)
- Mike Lelieveld (@mlelieveld)
We appreciate your continued support and look forward to bringing you more comprehensive analysis in our next edition.
Until then!