Bitcoin Surpasses 120k: Has Alt Season Arrived?
Bitcoin surged 60% in six weeks, shattering the $100k mark—a milestone once relegated to memes. With OG sellers cashing in and a $319B capital boost, is this breakout the start of a new bull run? And will altcoins finally reclaim their spotlight?

Between November 4 and December 17, 2024, bitcoin’s price surged by 60% in just six weeks, climbing from $67,000 to $108,000. It was a beautiful rally, reminiscent of several similar ones seen earlier in this bull market.
However, there was one major difference compared to previous price surges. Those earlier moves were part of the recovery from the bear market’s downturn. After the peak in November 2021, the price had dropped by 78%, from $69,000 to $15,400—a loss that was gradually recovered in 2023 and 2024.
The breakout in November 2024 was a leap into uncharted territory. For the first time, bitcoin reached both $100,000 and €100,000 per bitcoin—a price level that had long been a distant dream and the subject of countless memes and songs.
Many saw the magical “100k” as the perfect opportunity to sell, perhaps because they had set that target for themselves years earlier, or because going any higher seemed unrealistic.
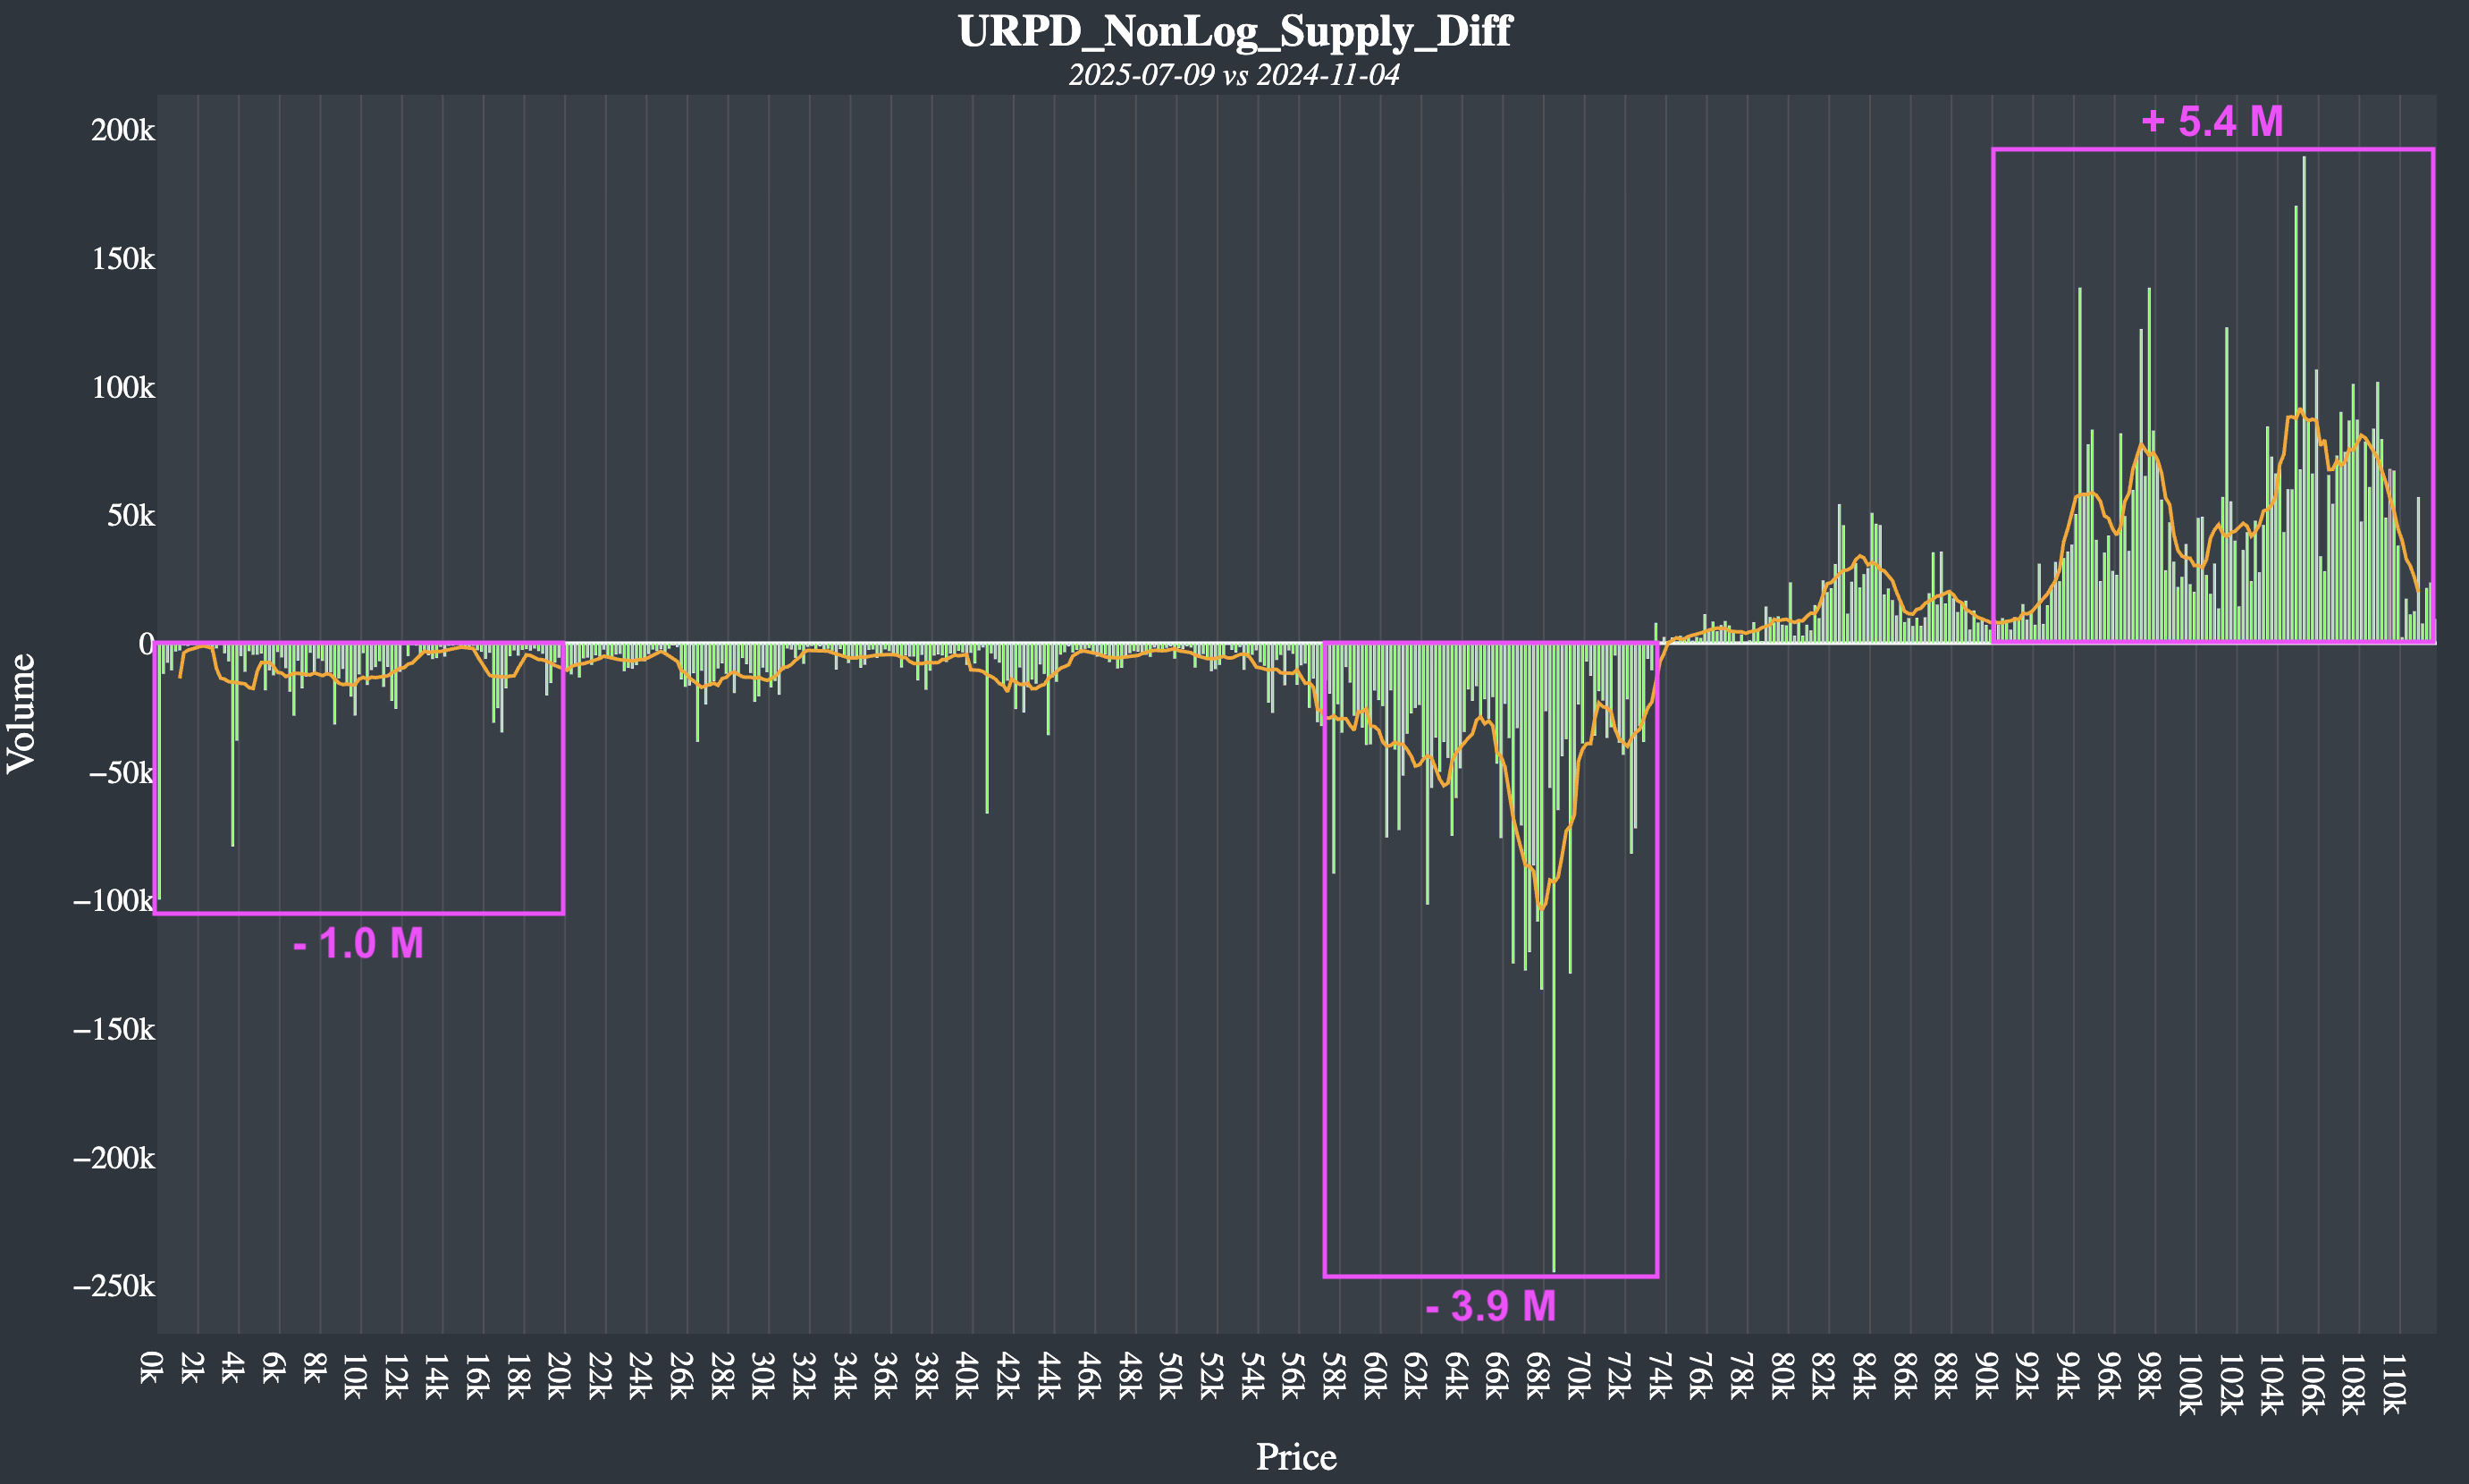
By analyzing blockchain transaction data, you can estimate the purchase price of a UTXO when it is spent. Doing this for every transaction over a given period gives a clear picture of who is buying and selling, and how many bitcoins are changing hands.
The chart below illustrates this for the period from November 4, 2024, to July 9, 2025, ending just before the breakout above $112,000. In total, 5.4 million BTC were sold during this period at prices between $90,000 and $110,000 – roughly around the 100k level.
The sellers come from a diverse group:
- 1.0 million BTC comes from sellers who bought at prices below $20,000, such as the OGs, the class of 2017, and those who bought around the bottom in 2022.
- 3.9 million BTC comes from sellers who bought at prices around $60,000, including the class of 2021 and investors who became excited by the ETF launch and Trump’s campaign rhetoric.
There is another 1.5 million BTC spread out among other sellers. For all these investors, 100k was clearly an attractive price at which to sell.
But for every seller, there is a buyer.
To estimate how much capital these buyers have injected, you can’t simply multiply the total number of bitcoins by the price. It’s quite possible that a buyer purchasing 1 bitcoin at $110,000 had sold a bitcoin a few months earlier at $90,000. In that case, they only contributed $20,000 of new capital, not $110,000.
The solution is to look at the increase in the total realized value of all bitcoins during this period. That value rose from $669 billion to $988 billion, an increase of $319 billion.
The past 8 months can be summarized as a great rotation of capital around the important milestone of $100,000. Many exited while many entered. The journey to the $1 million milestone will now be undertaken by a slightly different crowd.
This doesn’t mean we will never see prices below 100k again; rather, it means that 100k is no longer a milestone. It is now just another price level, like $90k or $110k. Although people might still choose to sell at these levels, it won’t be simply because it’s exactly 100k.
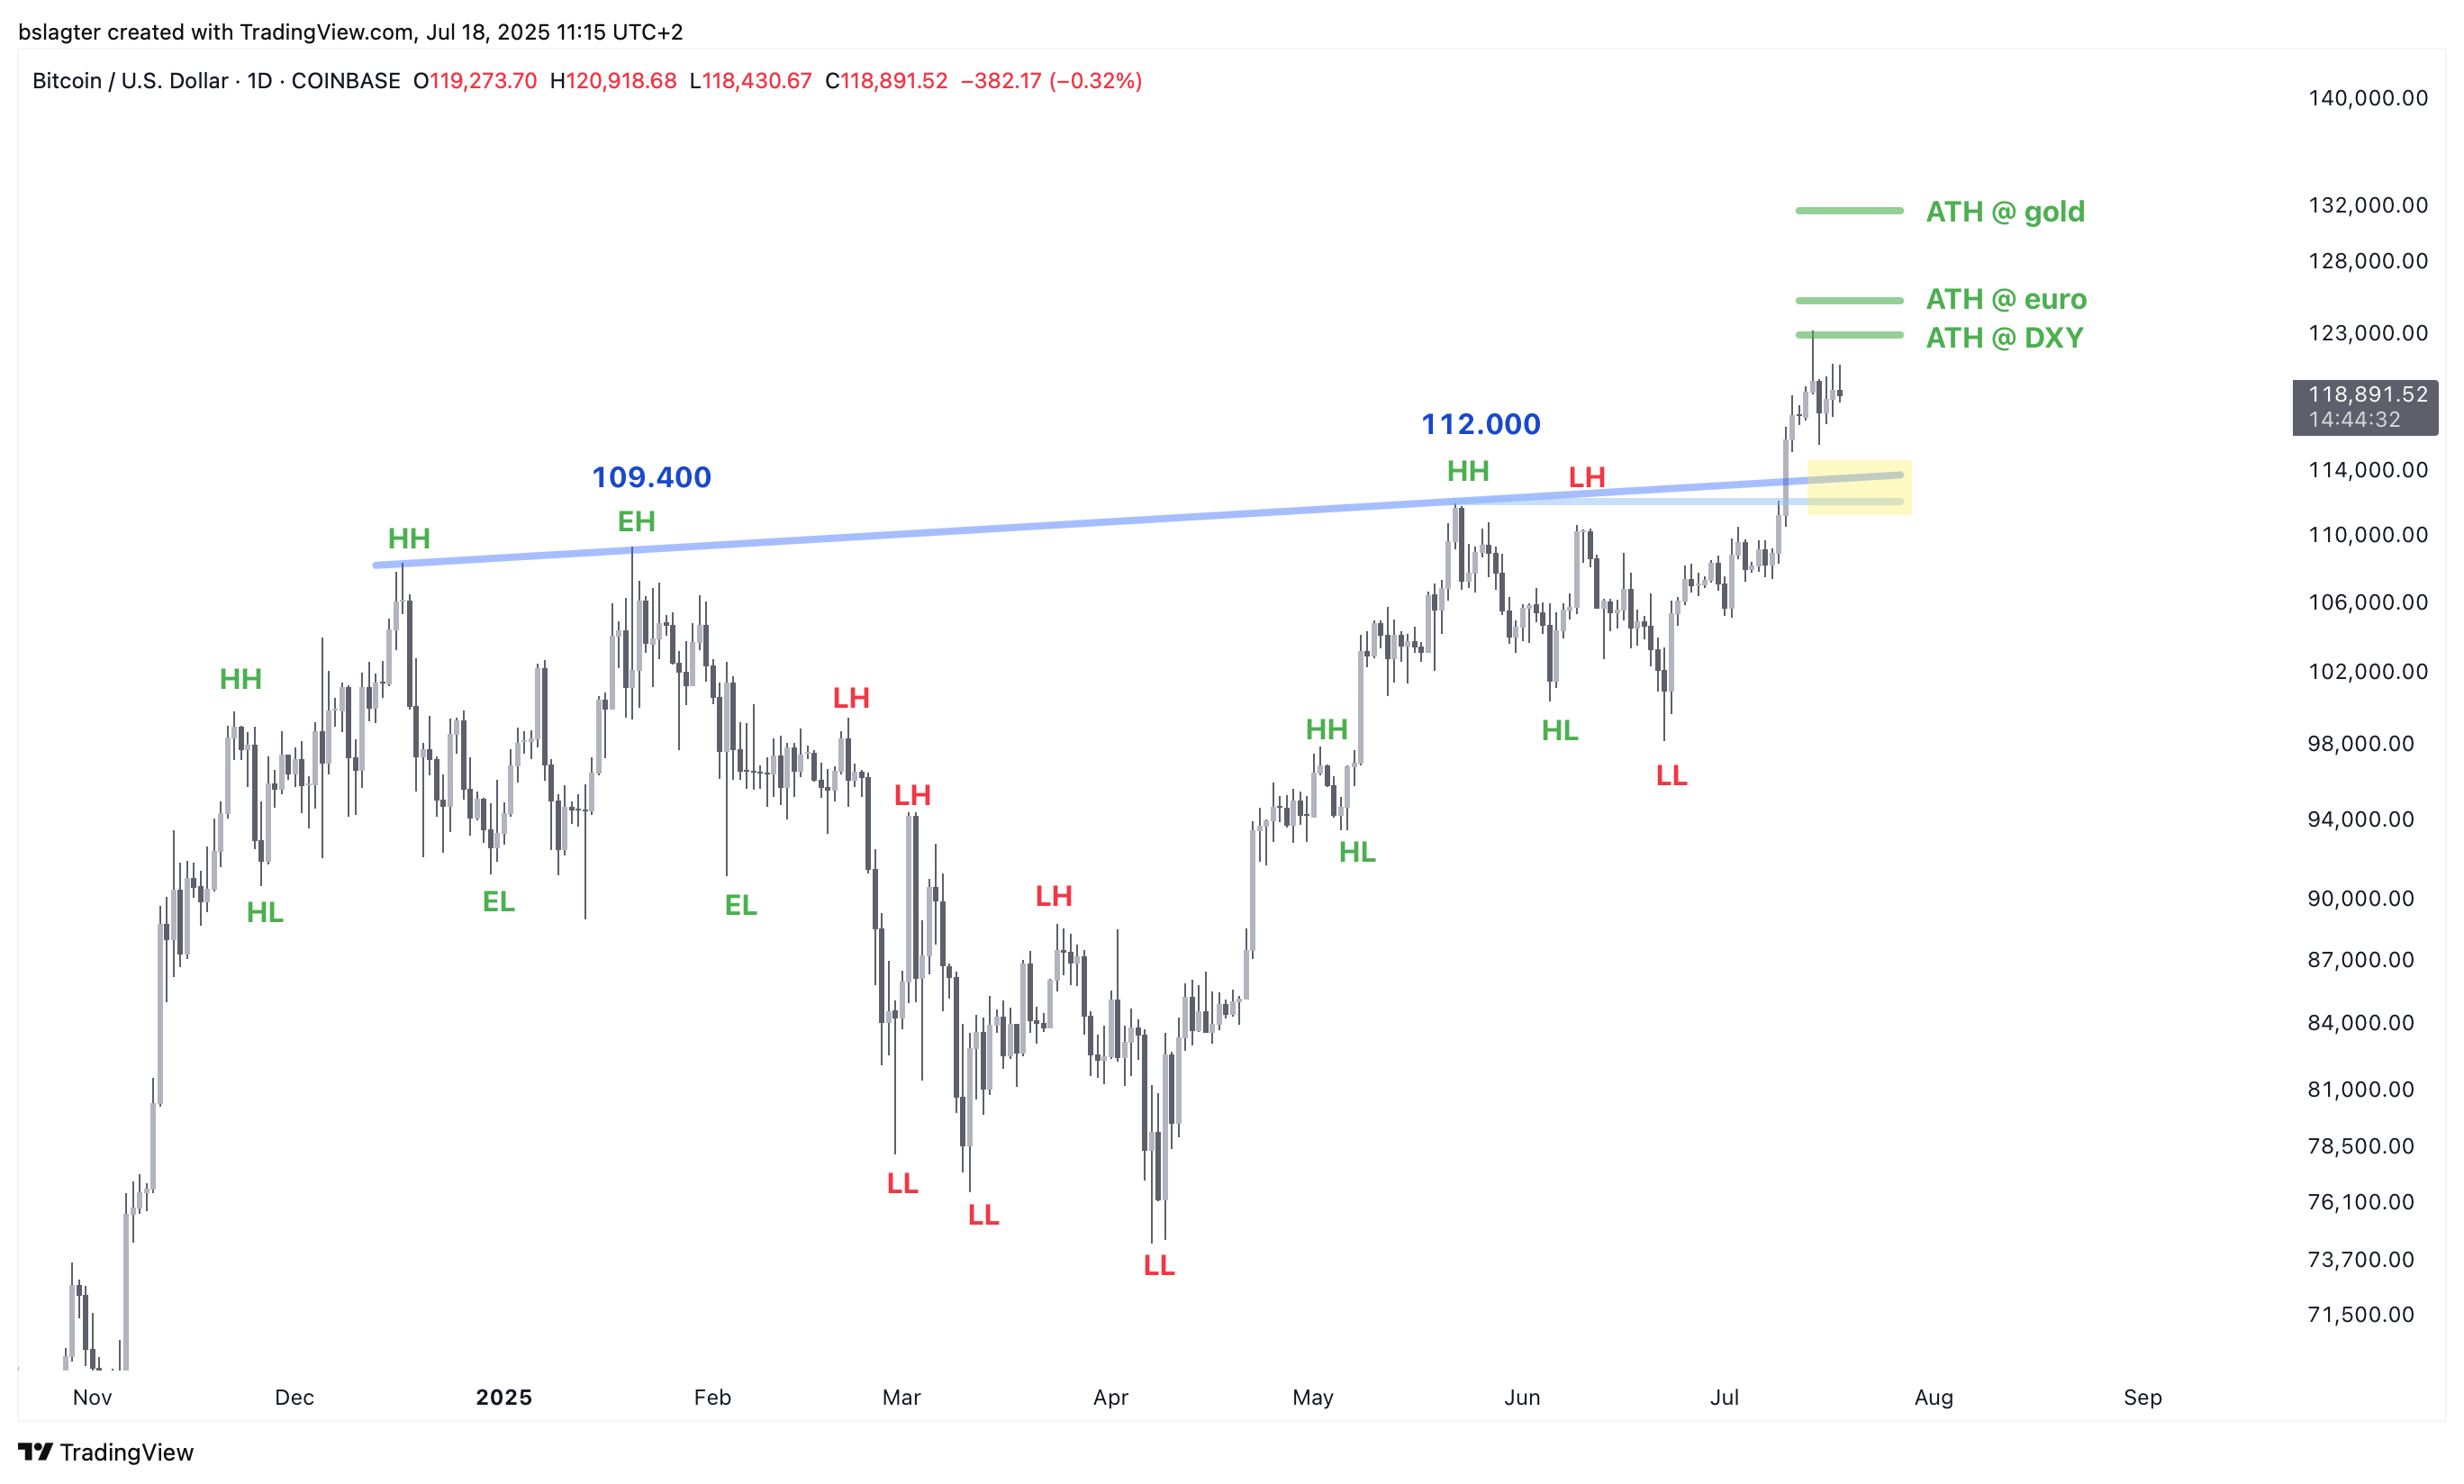
This sets the stage for further gains. We now have enough evidence to call last week’s rise a valid breakout. We recorded 9 daily closes above 110k and one weekly close, with all parts of the market participating—spot, futures, perps, and ETFs.
Our base scenario is that a new upward trend has begun, with a price target of $150,000 to $165,000 over the next two months. See last week’s Markets update and Sunday’s YouTube video for the analysis.
In the past, after a breakout we often observed a pattern: a few days of consolidation above the breakout level followed by a continued rise without retesting that level.
If that were to happen again now, it would provide further confirmation of the breakout, especially if all-time highs are set in other currencies such as the euro and gold. If we see a test this time, we expect a strong, aggressive response from the bulls between $112,000 and $114,000.
While bitcoin remains somewhat stuck around $118,000, the rest of the crypto market is coming back to life. Many altcoins have dropped more than 50% since January and remain far below their previous bull market highs. They are now trying to recover some of those losses.
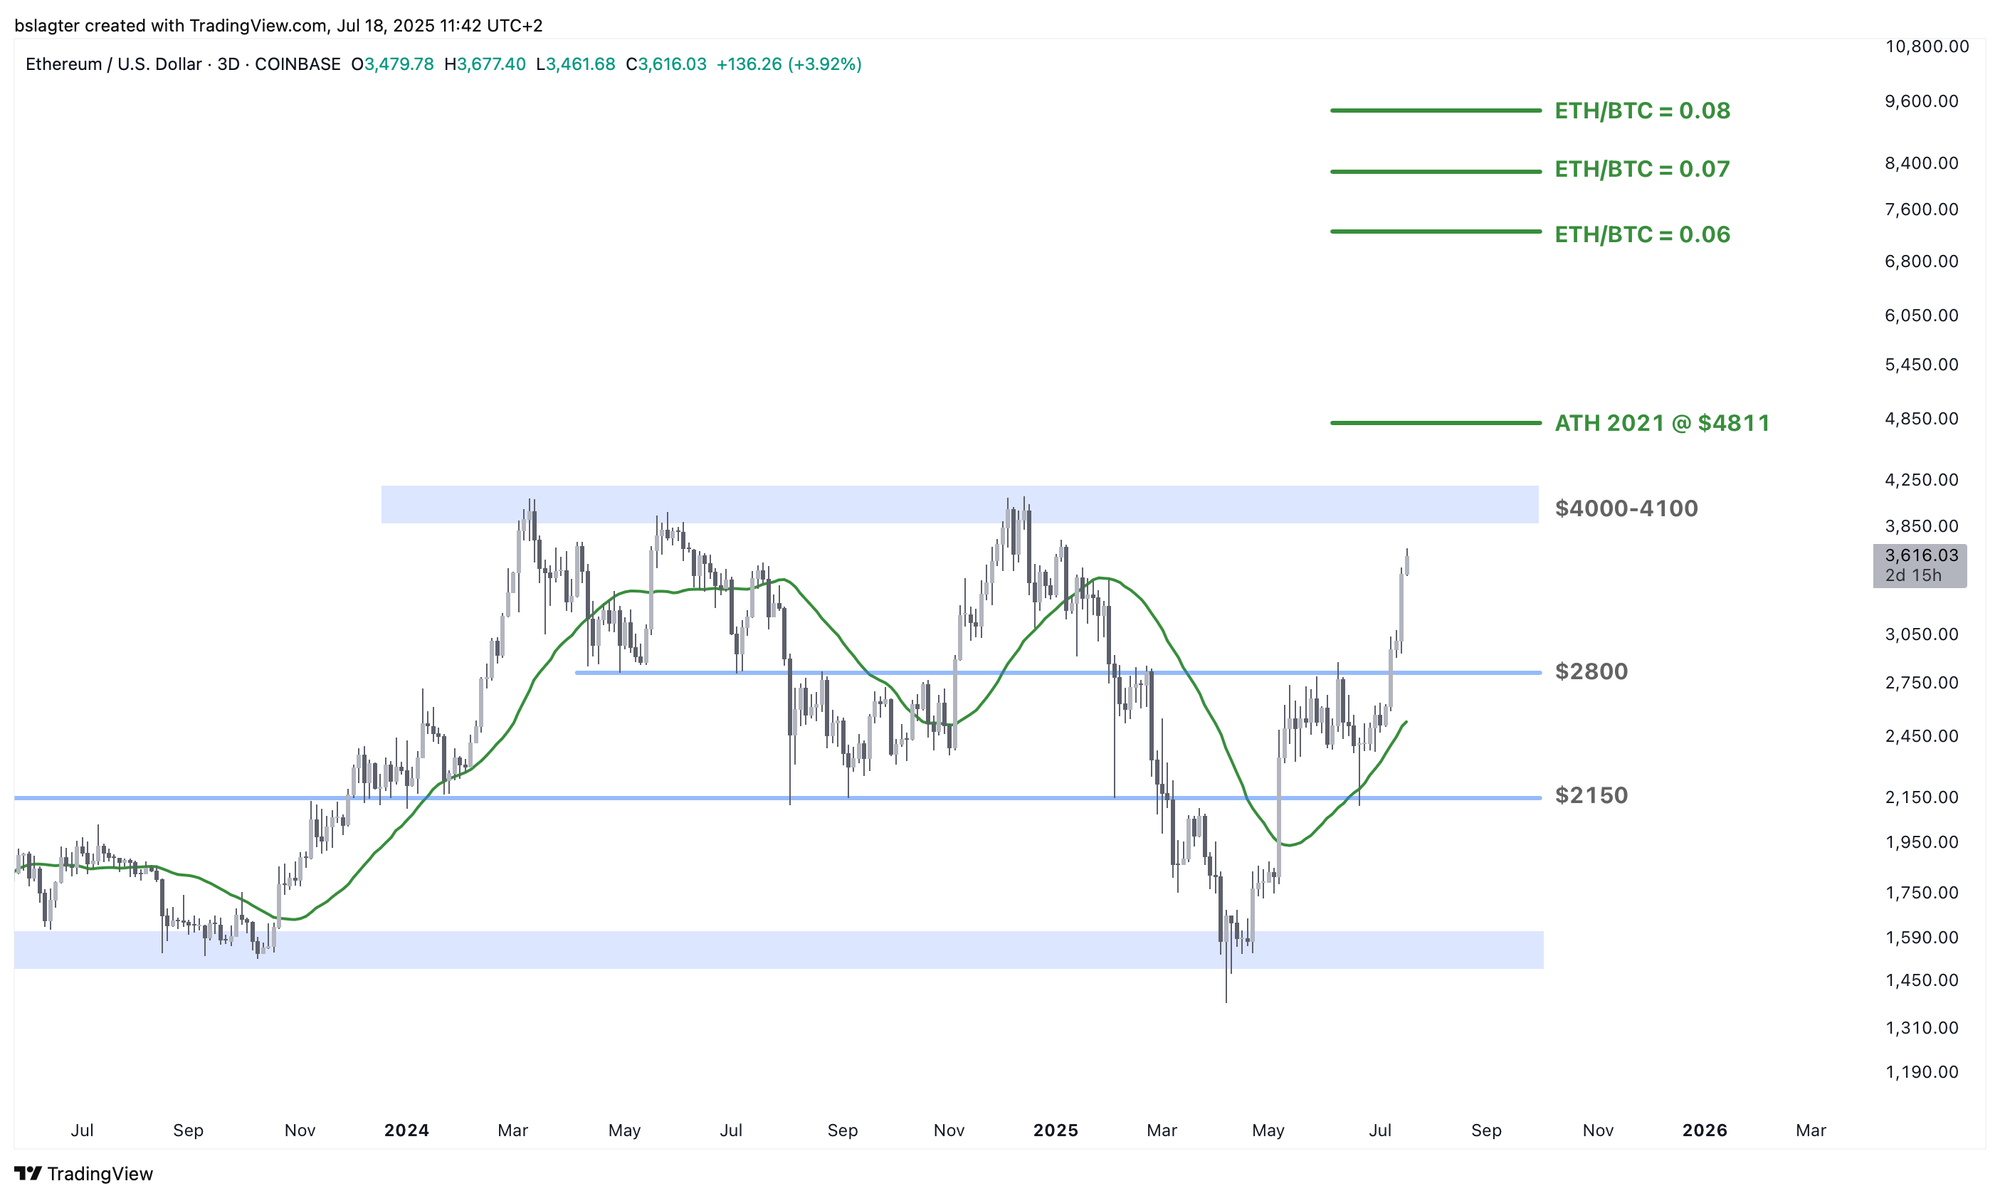
Ether is a perfect example. Over the past three years, the Ethereumnetwork’s token has continuously lost value relative to bitcoin. In 2021 and 2022, the ETH/BTC exchange rate ranged between 0.06 and 0.08 bitcoin per ether. By April 2025, it had fallen to 0.017—a roughly 75% underperformance.
Ether is now starting to recover some of that loss. Its price surged from $1,600 to $3,600 over the past three months, and the ETH/BTC ratio now sits at 0.03.
This recovery isn’t just the result of a massive short squeeze or derivatives speculation. A significant amount of spot ETH is actually being purchased. On Wednesday, the inflow to spot ether ETFs was roughly equal to that for spot bitcoin ETFs, both around $750 million.
A narrative is emerging that Ethereum is benefiting from the breakthrough of tokenization—especially stablecoins—driven by new regulations in the US.
“Narrative follows price,” as the saying goes. This also means that this story could fade just as quickly as ETH’s rise begins to stall.
Now that the price has reached $3,600, it makes sense to wait and see. Climbing to $4,000 shouldn’t be too difficult—we’ve seen it happen three times in the past year and a half. The real test will be between $4,000 and $4,100, and only sustained acceptance above that level will give real cause for excitement about ETH.
We continue with the following topics for our Alpha Plus members:
- Has alt season started?
- Inflation heats up – a potentially negative narrative for bitcoin
- The second round of fiscal dominance has begun
1️⃣ Has alt season started?
Bert
To gauge the total market capitalization of the crypto market, analysts often refer to TOTAL on TradingView, which sums the market caps of the top 125 cryptocurrencies from CoinMarketCap. At the time of writing, that figure stands at $3.84 trillion.
Bitcoin accounts for $2.37 trillion of that, making up 61.7% of the market—a figure commonly known as bitcoin’s market share or bitcoin dominance, also referred to as BTC.D. An increase in this percentage indicates that bitcoin is outperforming the rest of the market. This trend has persisted for three years now, with bitcoin dominance rising steadily from 40% at the end of 2022 to 66% in June 2025.
For altcoin investors, this is a bitter pill to swallow. Bitcoin has consistently delivered better performance, and its lower volatility, higher liquidity, and stronger network effect also mean lower risk.
Many have long awaited a new “alt season” – a period during which altcoins broadly and significantly outperform bitcoin. The last time this happened was in 2021, when bitcoin dominance plummeted from 70% to 40% in just five months.
However, it remains uncertain whether we will see an alt season similar to those of 2017 and 2021 again, and analysts remain divided on the matter.
There is no doubt that investors’ appetite for risk will eventually pick up again. The question is whether that demand will be spread across a broad range of altcoins or limited to just a few. It might even go toward crypto stocks like Coinbase, Circle, and Robinhood, or bitcoin treasury companies like MicroStrategy.
A hallmark of previous alt seasons was a strong, sustained decline in bitcoin dominance. Social media lights up every time the bitcoin dominance chart dips even slightly. Could this be the start of something new?
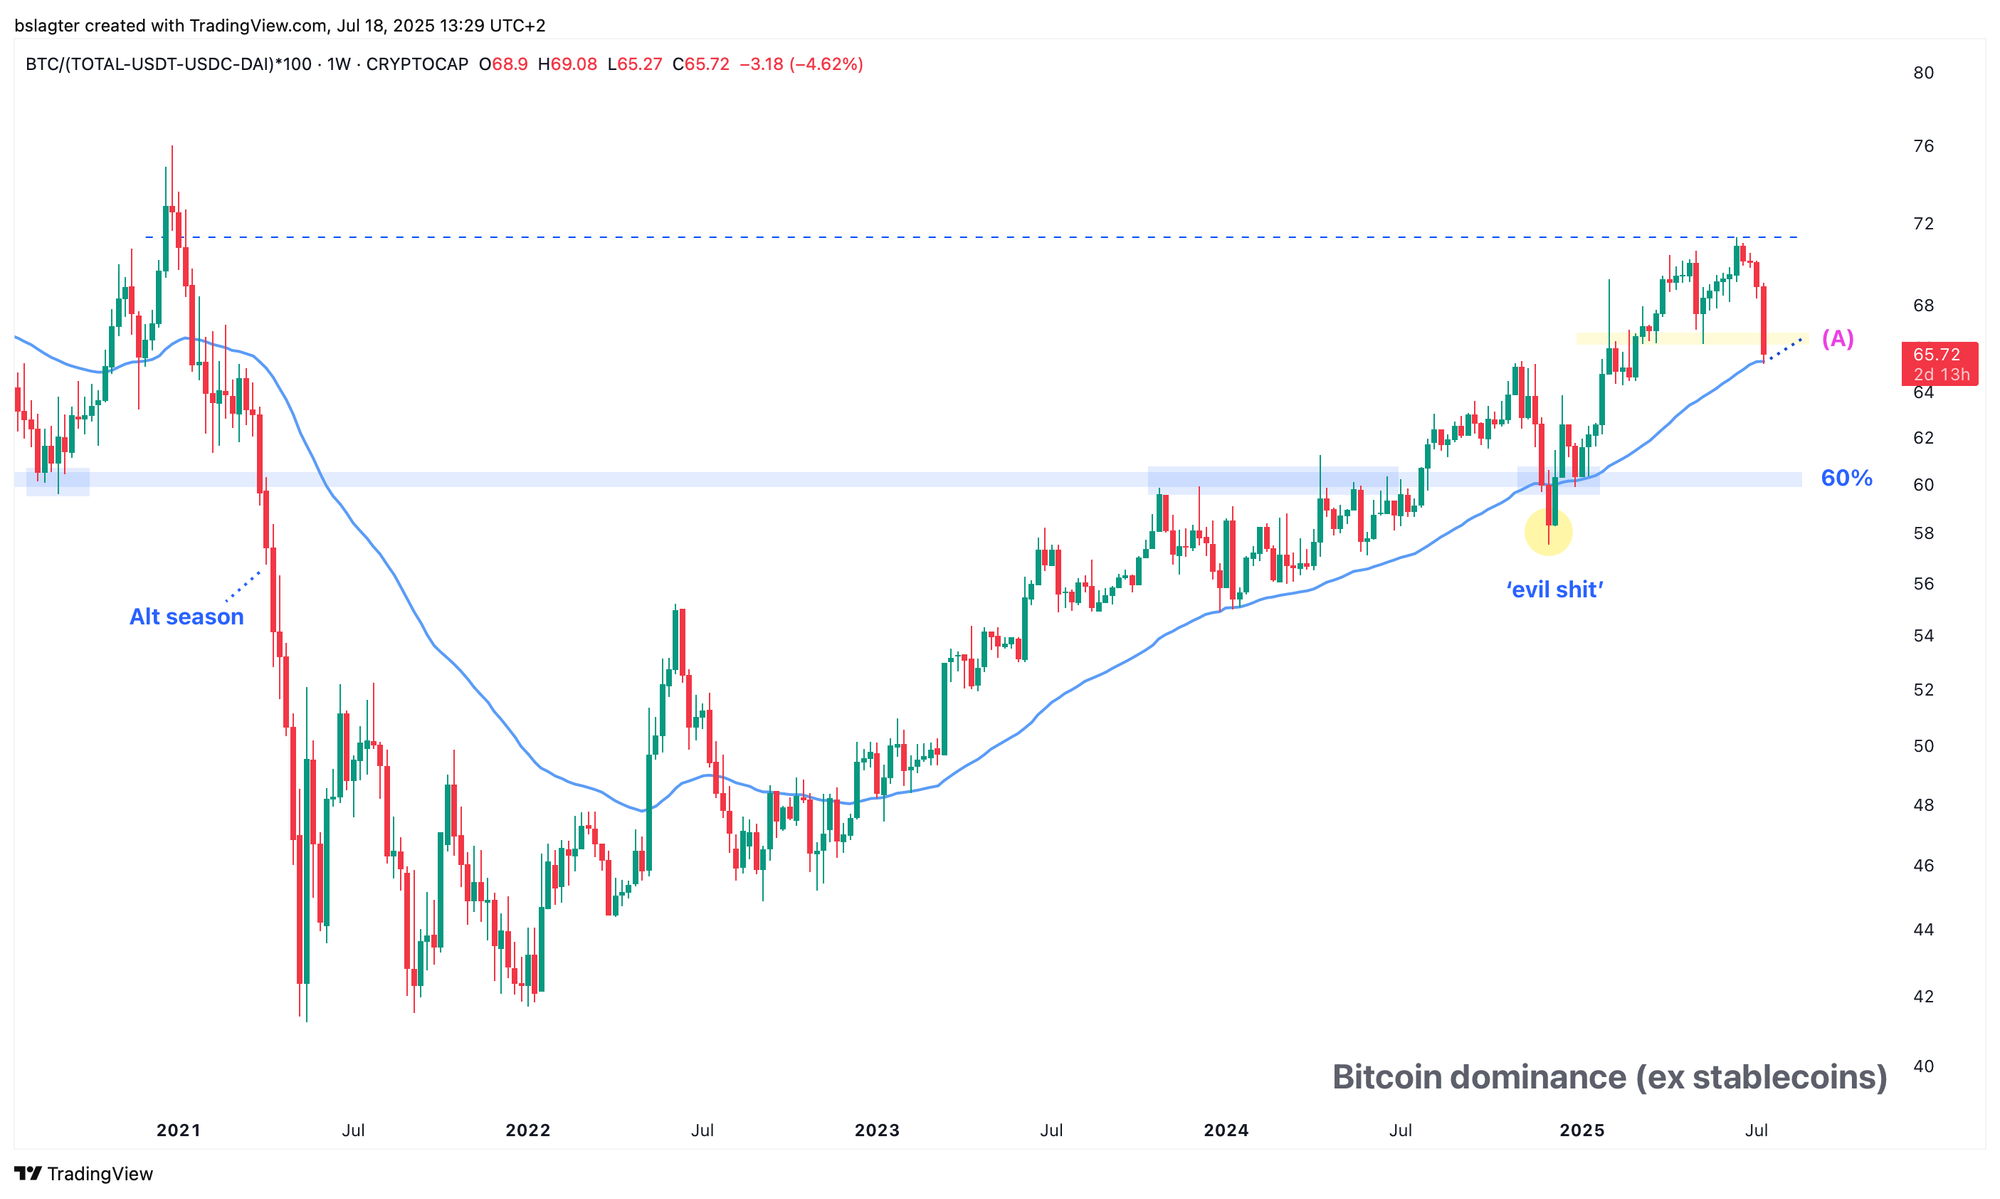
Last November, it briefly appeared so. Dominance dropped and seemed to break out of its upward trend, but it turned out to be a false alarm. Not long after, the upward trend resumed, and altcoins lost a significant portion of their value relative to bitcoin in early 2025—what docXBT described on X as “the most evil shit that’s happened this cycle.”
A warned person counts for two. Now, dominance is falling again, much of which is due to ETH appreciating against BTC. Excluding stablecoins, ETH comprises 35% of the altcoin market capitalization. But XRP and BNB are also making contributions.
The chart below shows bitcoin’s market share excluding stablecoins. Notice the significant drop over the past week. Is this another trap, or is it truly the beginning of a new alt season?
We have reached a key point (A) where a horizontal level—previously acting as both resistance and support—aligns with the dominant moving average. A sustained break downward through this level could signal a continued decline in bitcoin dominance, leading to a scenario where owning altcoins becomes more attractive.
The previous two bull markets ended with an alt season. However, that doesn’t mean it is inevitable this bull market as well. The macroeconomic context is entirely different, and retail enthusiasm for crypto is much lower than it was in 2017 and 2021.
Still, let’s imagine what it might look like if history were to repeat itself. The chart below shows bitcoin’s price at the top, bitcoin dominance at the bottom, and in green, the first three years of the market cycle.
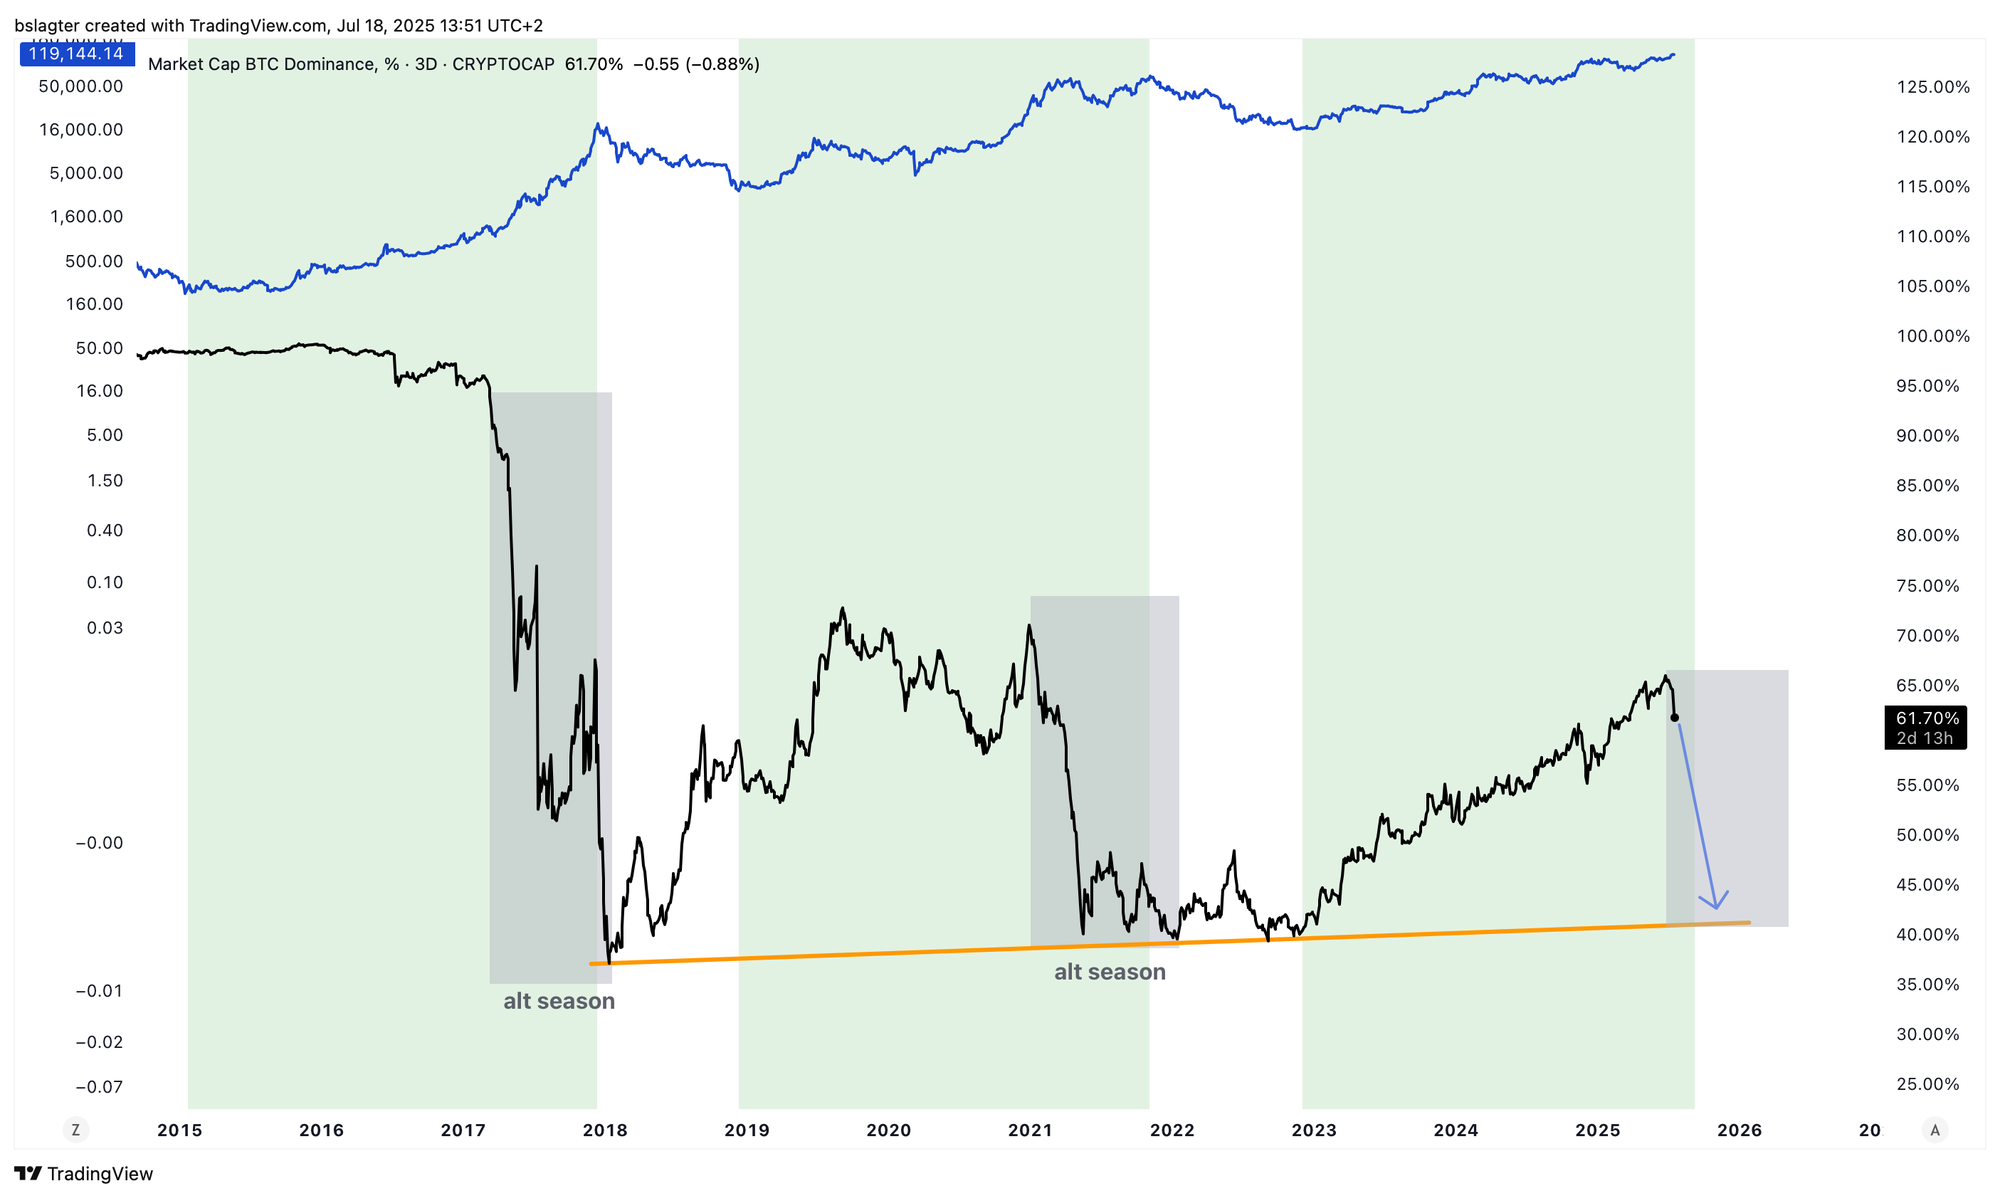
Imagine bitcoin dominance falls from 62% to 42% while bitcoin’s price simultaneously rises to $200,000. This would give bitcoin a market capitalization of $4 trillion. With a 42% dominance rate, the total crypto market would be valued at $9.5 trillion—meaning altcoins would have $5.5 trillion to share, an impressive figure.
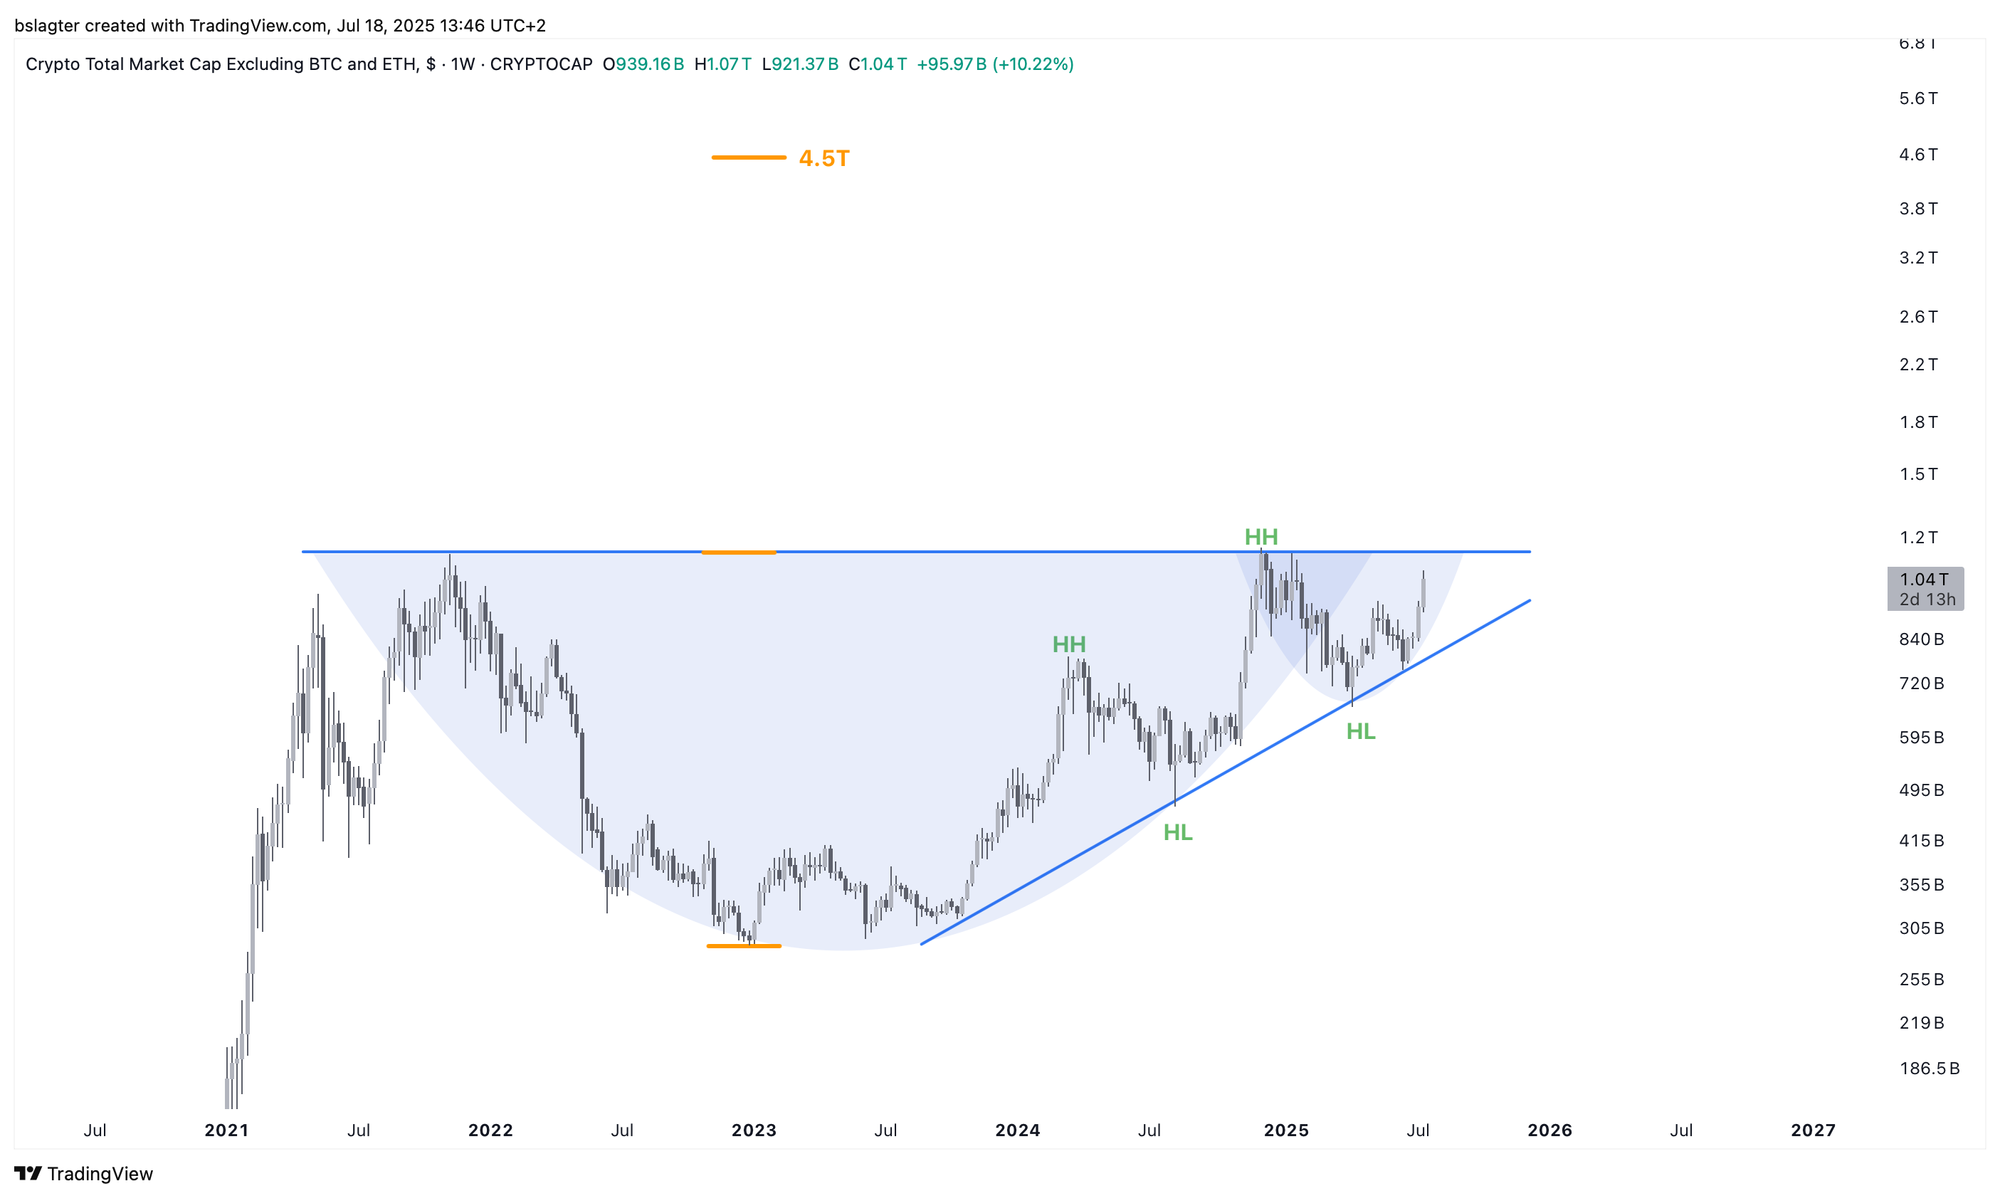
This scenario aligns with the geometric price target suggested by the potential Cup & Handle pattern visible on several altcoin total charts. The chart for TOTAL3, which represents the total market excluding bitcoin and ether, illustrates this point.
While such a scenario isn’t unthinkable, it would require an unprecedented level of hype, mania, and euphoria. Currently, there is little evidence of this, and it seems unlikely that retail investors will embrace it anytime soon.
Based solely on economic conditions and current retail sentiment, we see very little chance for a broad alt season.
Of course, a small segment of altcoins might outperform bitcoin for a limited time. However, if you’re hoping to simply sit back and benefit from an alt season, you’ll have to work hard in that scenario.
Ultimately, chasing the hype of the moment often leaves most speculators worse off. It can be a lucrative endeavor if you have the right connections, manage your risks well, and a generous dose of luck. For most people, sticking with bitcoin remains the better option.
If conditions change and we see more signs that altcoins will indeed perform exceptionally well for an extended period, then we’ll be back in the game!
2️⃣ Inflation Heats Up – A Potentially Negative Narrative for Bitcoin
Thom
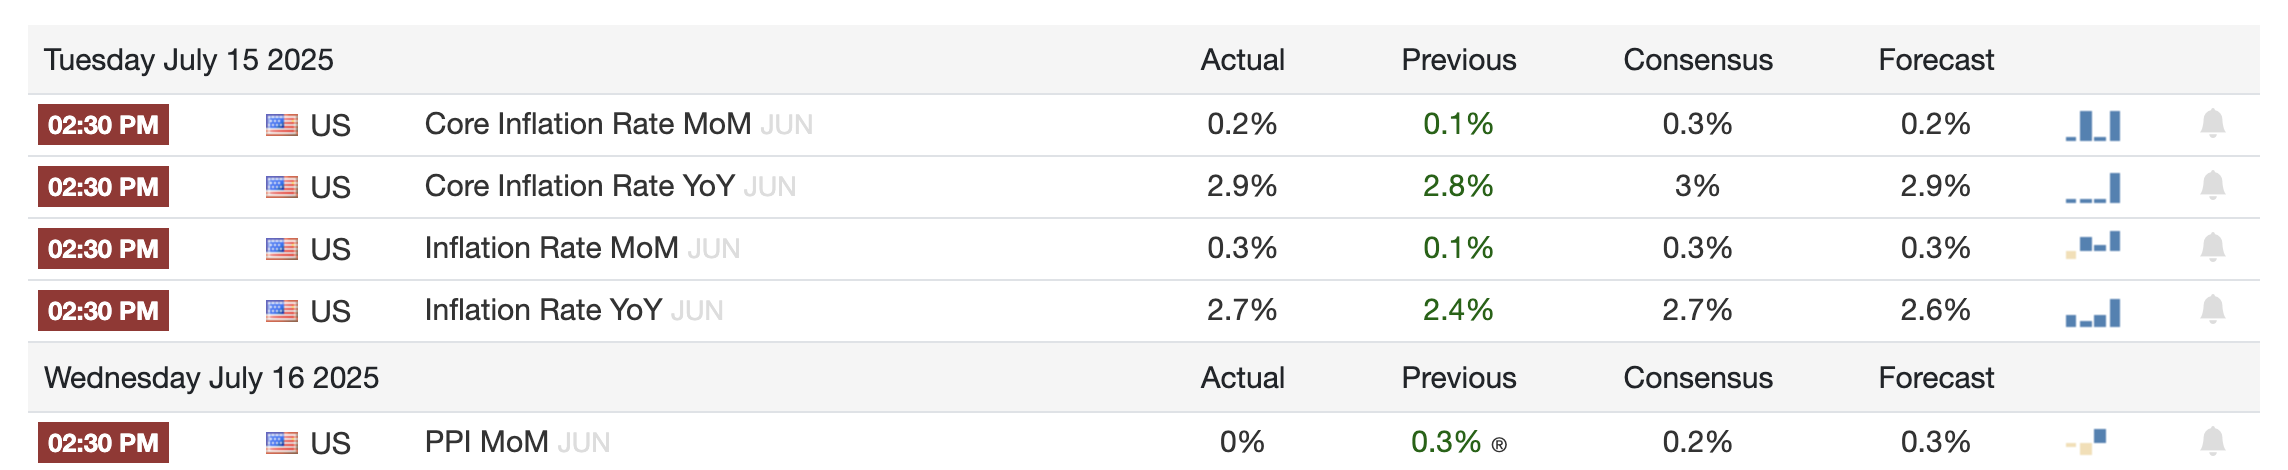
From a macroeconomic perspective, the spotlight this week was on US inflation figures. Compared to last month, inflation saw a slight uptick, fueling cautious speculation that Trump’s tariffs might indeed be contributing to rising inflation.
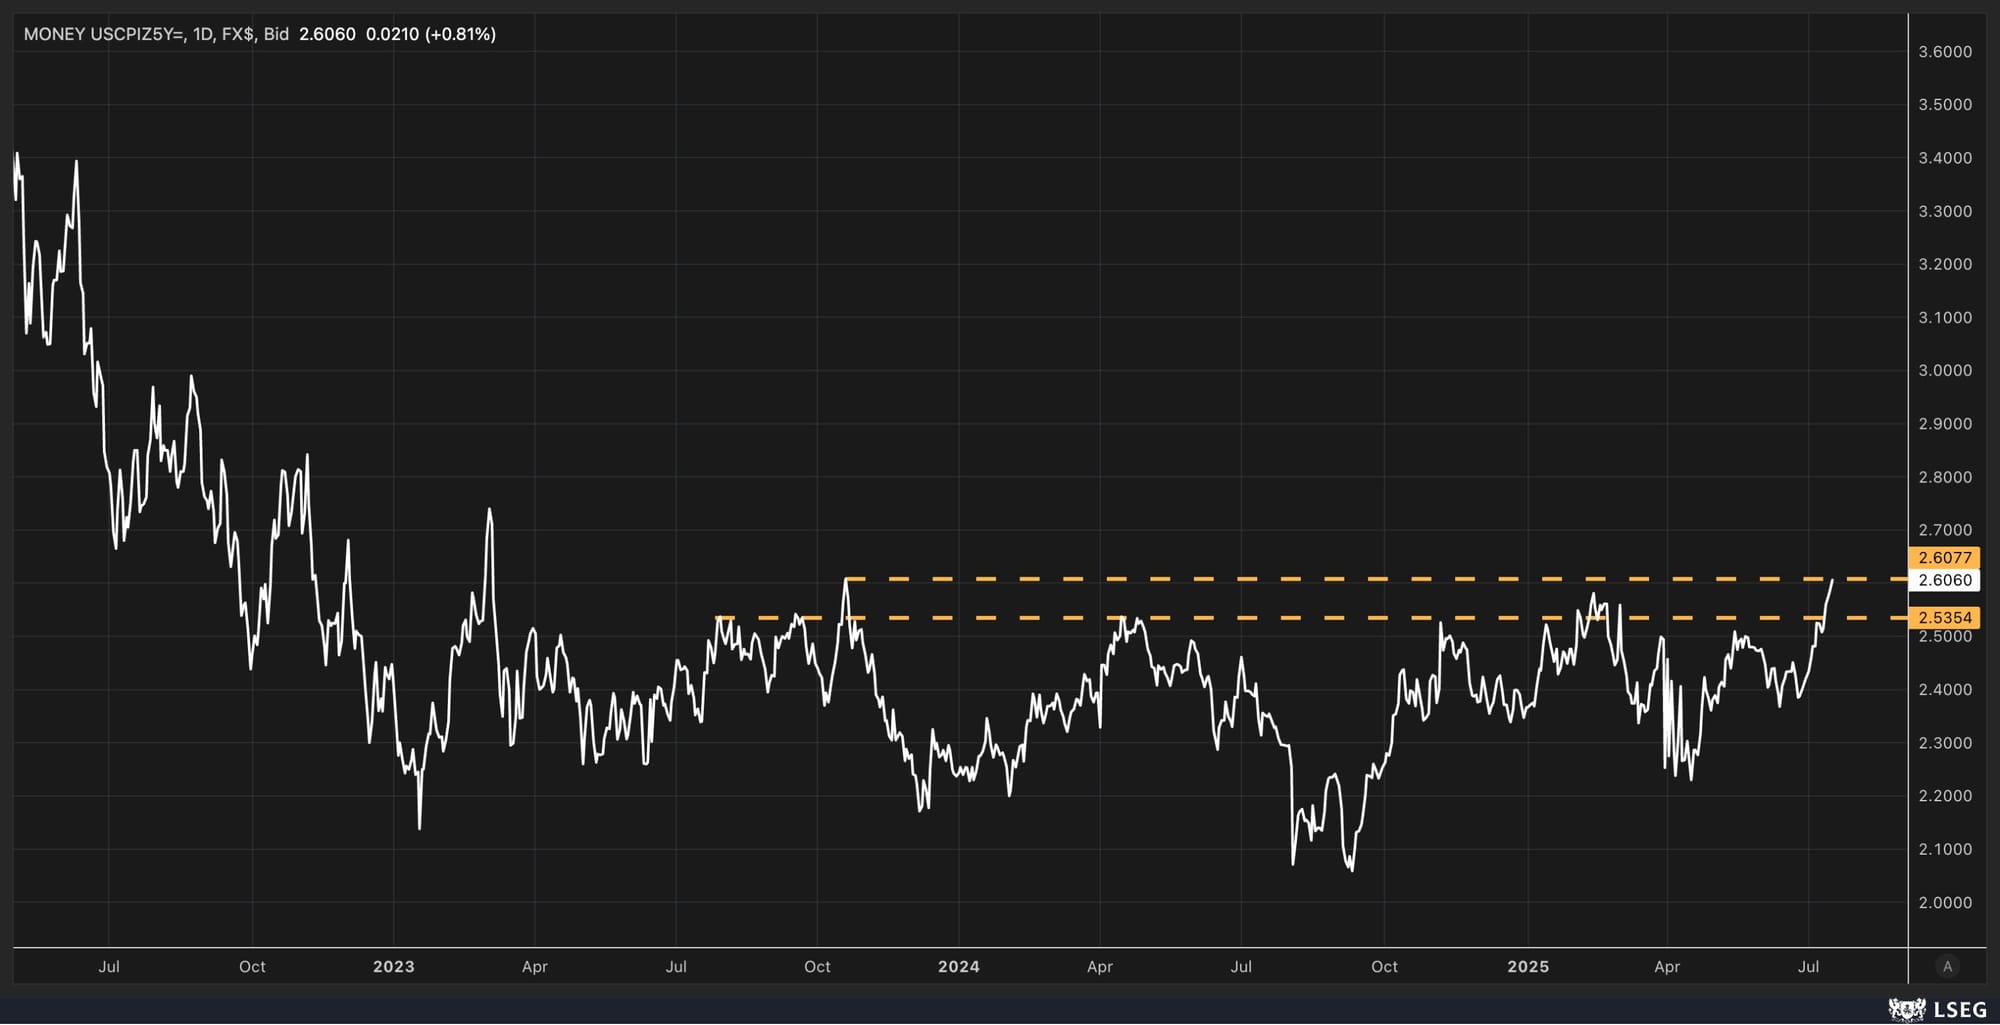
At the same time, long-term inflation expectations are on the rise. Below, you can see the inflation swap for the next five years breaking out—a pattern that appears across many other timeframes as well.
Although I don’t expect this to cause a market-breaking storm—given that the positive forces still seem much stronger—it could create some short-term headwinds. The rising inflation (or even the threat of it) makes it counterintuitive to speculate about imminent interest rate cuts.
This is compounded by the state of the US economy, which is still recovering from a growth of over 2%. The labor market remains solid, and consumer spending provided a pleasant surprise this week.
As inflation (and inflation expectations) rise, the market may begin to factor in some interest rate cuts. It’s no coincidence that we saw long-term rates break out upwards this week and that the US dollar strengthened.
Consequently, financial conditions are tightening in the short term. We have observed slight increases in the MOVE and VIX—the expected volatility for bonds and stocks—as well as in credit spreads, which represent the extra interest companies must pay to borrow compared to the US government.
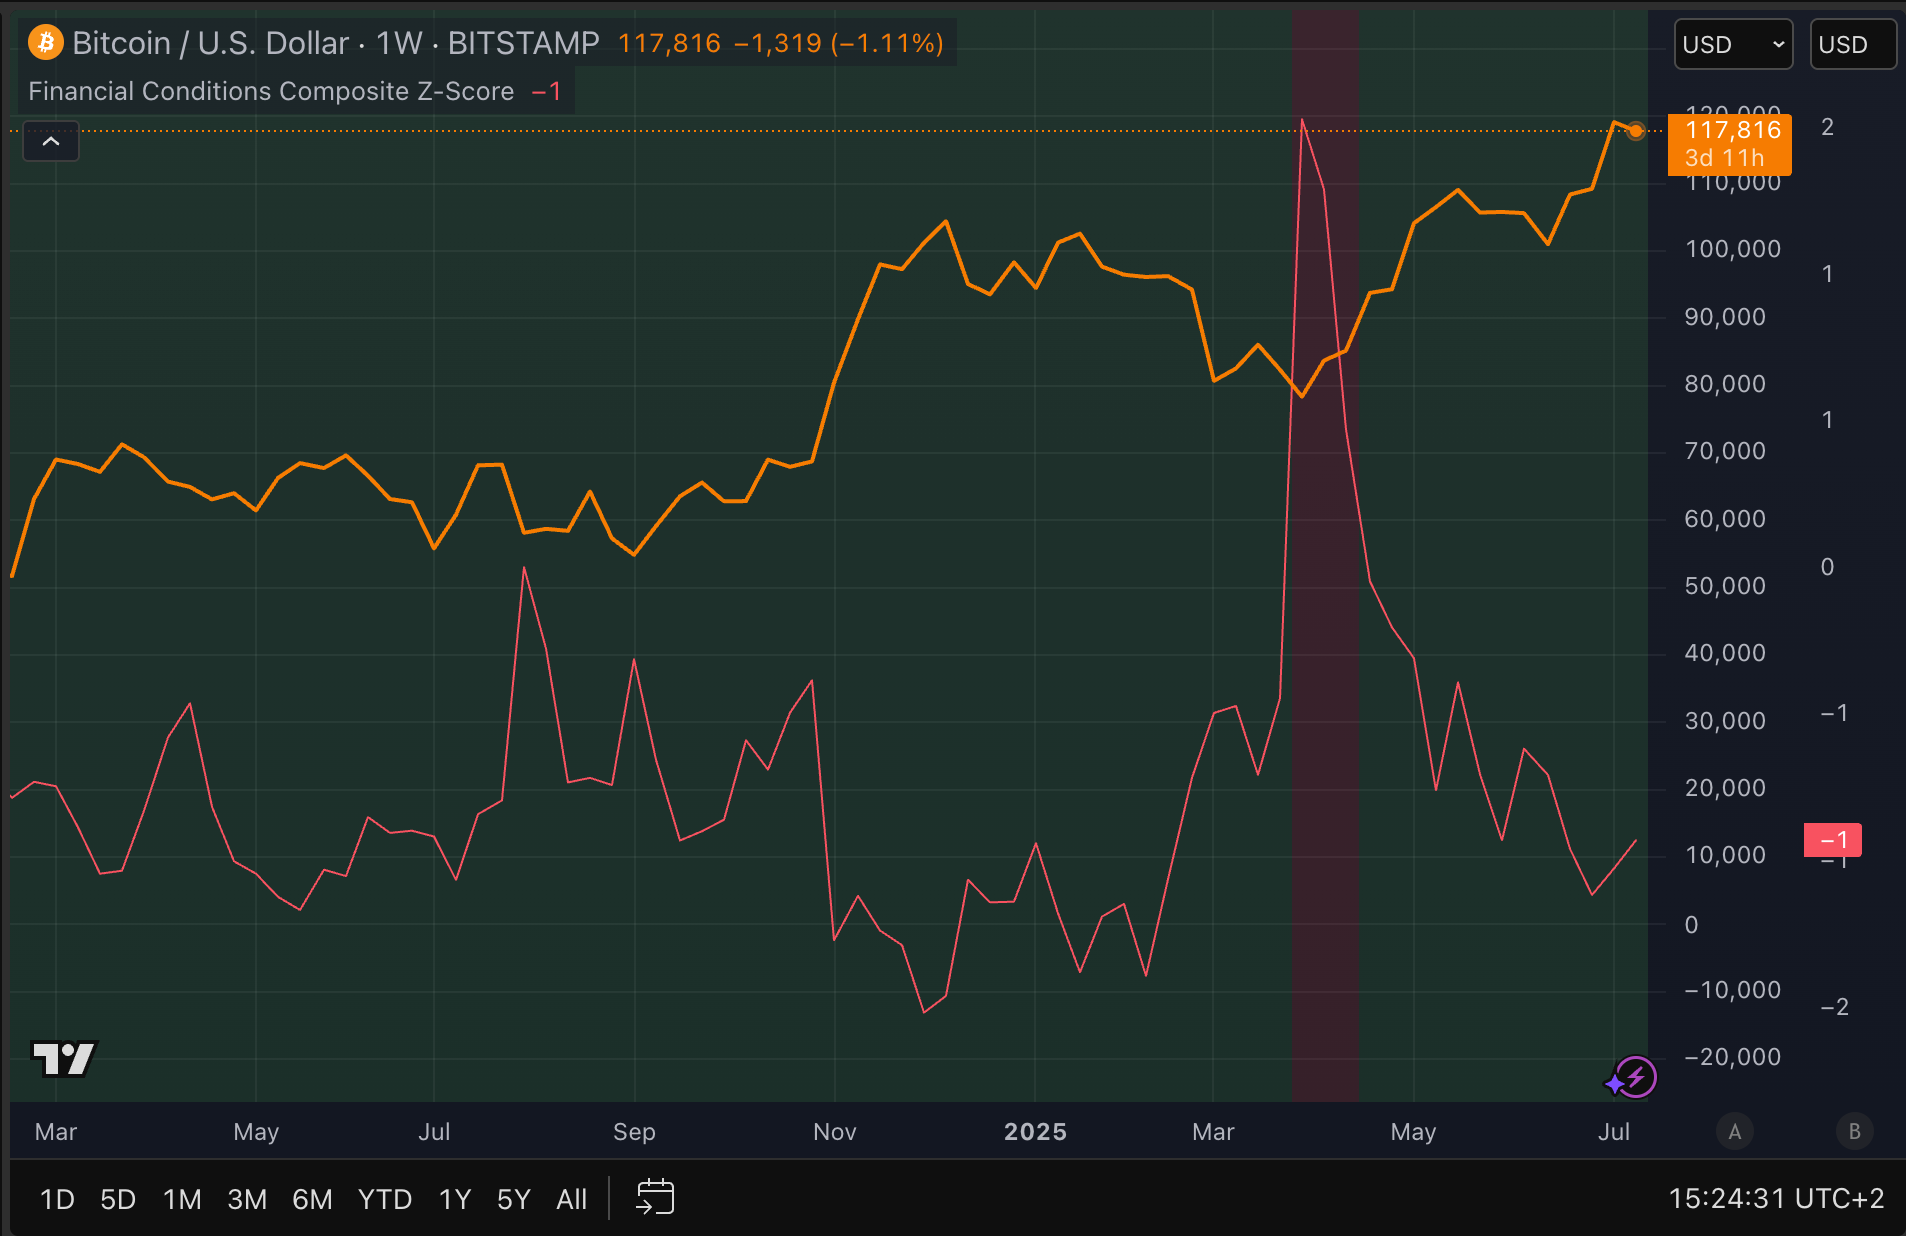
The red line in the chart below represents a composite of these indicators. As it rises, financial conditions tighten, making it harder for companies and individuals to access capital—a situation that can slow down both the economy and financial markets.
We are still operating at very favorable levels, and I don’t expect this development to mark the end of the bull market. However, the trend of rising inflation, interest rates, credit spreads, and expected volatility could pave the way for “bad news” to hit the market.
After all, we were previously in a phase where nothing seemed to affect the market. While this new trend might temporarily slow down the bull market, it is unlikely to break it.
3️⃣ The Second Round of Fiscal Dominance Has Begun
Thom
Now that the US debt ceiling has been suspended, government spending and national debt are on the rise once more. At the same time, the gap between what the US Treasury sells in government bonds and what the central bank is buying continues to widen.
We appear to be entering a second phase of what economists call ‘fiscal dominance’—a situation where fiscal policy, i.e. government spending, increasingly forces the central bank to adjust its monetary policy.
The first phase occurred during the COVID-19 crisis when the government bolstered the economy with nearly $5 trillion in bailout packages. That cash injection was financed by debt, while the US central bank simultaneously purchased government bonds on an unprecedented scale.
With the One Big Beautiful Bill Act (OBBB) as the major catalyst, it seems that we are now repeating this scenario in a second round. Investors are increasingly aware that we live in a world where monetary devaluation is a central theme—in theory, the very scenario bitcoin was designed to counter.
The idea behind OBBB is that these investments, along with the rise of artificial intelligence, will boost productivity. If that happens, and gross domestic product (GDP) grows faster than the interest on government debt, the financial situation remains sustainable.
In simple terms: the economy must grow faster than the cost of its debt for the government to continue financing deficits without things spiraling out of control.
However, long-term interest rates are now rising, which partly indicates that the market is losing confidence in that outlook. Investors are beginning to demand extra compensation (interest) for the risk associated with long-term lending (inflation).
This brings us closer to the point where the central bank will have to intervene by buying government bonds to push rates down—and we have to hope that this intervention doesn’t further erode confidence.
In such a scenario, the government might even resort to capital controls, legally forcing financial institutions to hold a larger percentage of their assets in government bonds to suppress rates.
While there are still options available, it is becoming increasingly clear that the emperor may have very few clothes left on—a development that, in my view, only reinforces bitcoin’s long-term narrative.
Thank you for reading!
To stay informed about the latest market developments and insights, you can follow our team members on X:
- Bart Mol (@Bart_Mol)
- Peter Slagter (@pesla)
- Bert Slagter (@bslagter)
- Mike Lelieveld (@mlelieveld)
We appreciate your continued support and look forward to bringing you more comprehensive analysis in our next edition.
Until then!