Bitcoin Soars to a New Record of $118,000
How do you really measure bitcoin’s strength? After bouncing from $111k to $118k, bitcoin teeters near its narrow 100k–110k range—gaining momentum yet shadowed by a weak dollar. Could this breakout signal a real move toward 150k–165k, or just be a mirage?
How long is a meter? It may seem like a simple question, but history shows it hasn’t always been that straightforward. After all, how do you measure a meter?
In 1983, it was agreed that a meter is defined as the distance light travels in a vacuum in 1/299,792,458th of a second. This shifts the challenge to defining a second. For that, we rely on atomic clocks, which use the vibrations of atoms.
The measuring stick for a meter is now the highly accurate atomic clock. This wasn’t the case when Ludwig Wittgenstein first pondered these ideas.
On May 20, 1875, representatives from 17 countries signed the Metre Convention, an international treaty that established three organizations to standardize weights and measures. Twelve years later, the Bureau international des poids et mesures (BIPM) placed a metal bar in a vault. The bar, made of 90% platinum and 10% iridium, featured two notches. The distance between them defined the meter.
Wittgenstein writes about that meter in Philosophical Investigations §50:
There is one thing of which one can say neither that it is one metre long, nor that it is not one metre long, and that is the standard metre in Paris.
Nassim Taleb uses Wittgenstein’s ruler in Fooled by Randomness as a metaphor for the pitfall where a signal sometimes tells us more about the measuring stick than about what is being measured:
A book review sometimes reveals more about the reviewer than the book in question, whether it is good or bad. I call this mechanism the “ruler of Wittgenstein”: If you use a ruler to measure a table and you doubt the ruler’s accuracy, you can also use the table to measure the ruler. The less you trust the ruler, the more you learn about the ruler and less about the table.
We’ve been grappling with a similar question in recent weeks about bitcoin. When we see bitcoin’s “price,” are we observing bitcoin’s strength or the dollar’s weakness?
This is important because a higher bitcoin price means nothing if you can’t buy more with it. It’s like having a “longer” table that no one can fit around.
Over the past two months, the bitcoin price, with one exception, has remained between 100,000 and 110,000 dollars. This narrow range lies just below the all-time highs reached in December and January. It has recouped the losses from February and March, yet it hasn’t taken the next step upward.
A keen observer might point out that on May 22, at a price of 112,000 dollars, a new record was indeed reached. And if you look solely at the number, 112k is higher than 109k. However, we tend to discount that figure for two reasons.
Firstly, there was no acceptance above the 109,400 dollar threshold. What we want to see is successive daily closes above that level, weekly closes that hold, tests of support, and a continuation of the upward trend. That sequence did not occur; instead, we observed a slight decline back to 98k.
Secondly, you shouldn’t evaluate bitcoin’s price solely in dollars. This dollar price is crucial for most applications—since most trading and analysis are done in dollars—but it only tells part of the story. After all, what are you really measuring—the dollar or bitcoin?
Part of the strength seen in bitcoin’s chart can be attributed to the dollar’s weakness. The table only appeared long because the ruler had become significantly shorter.
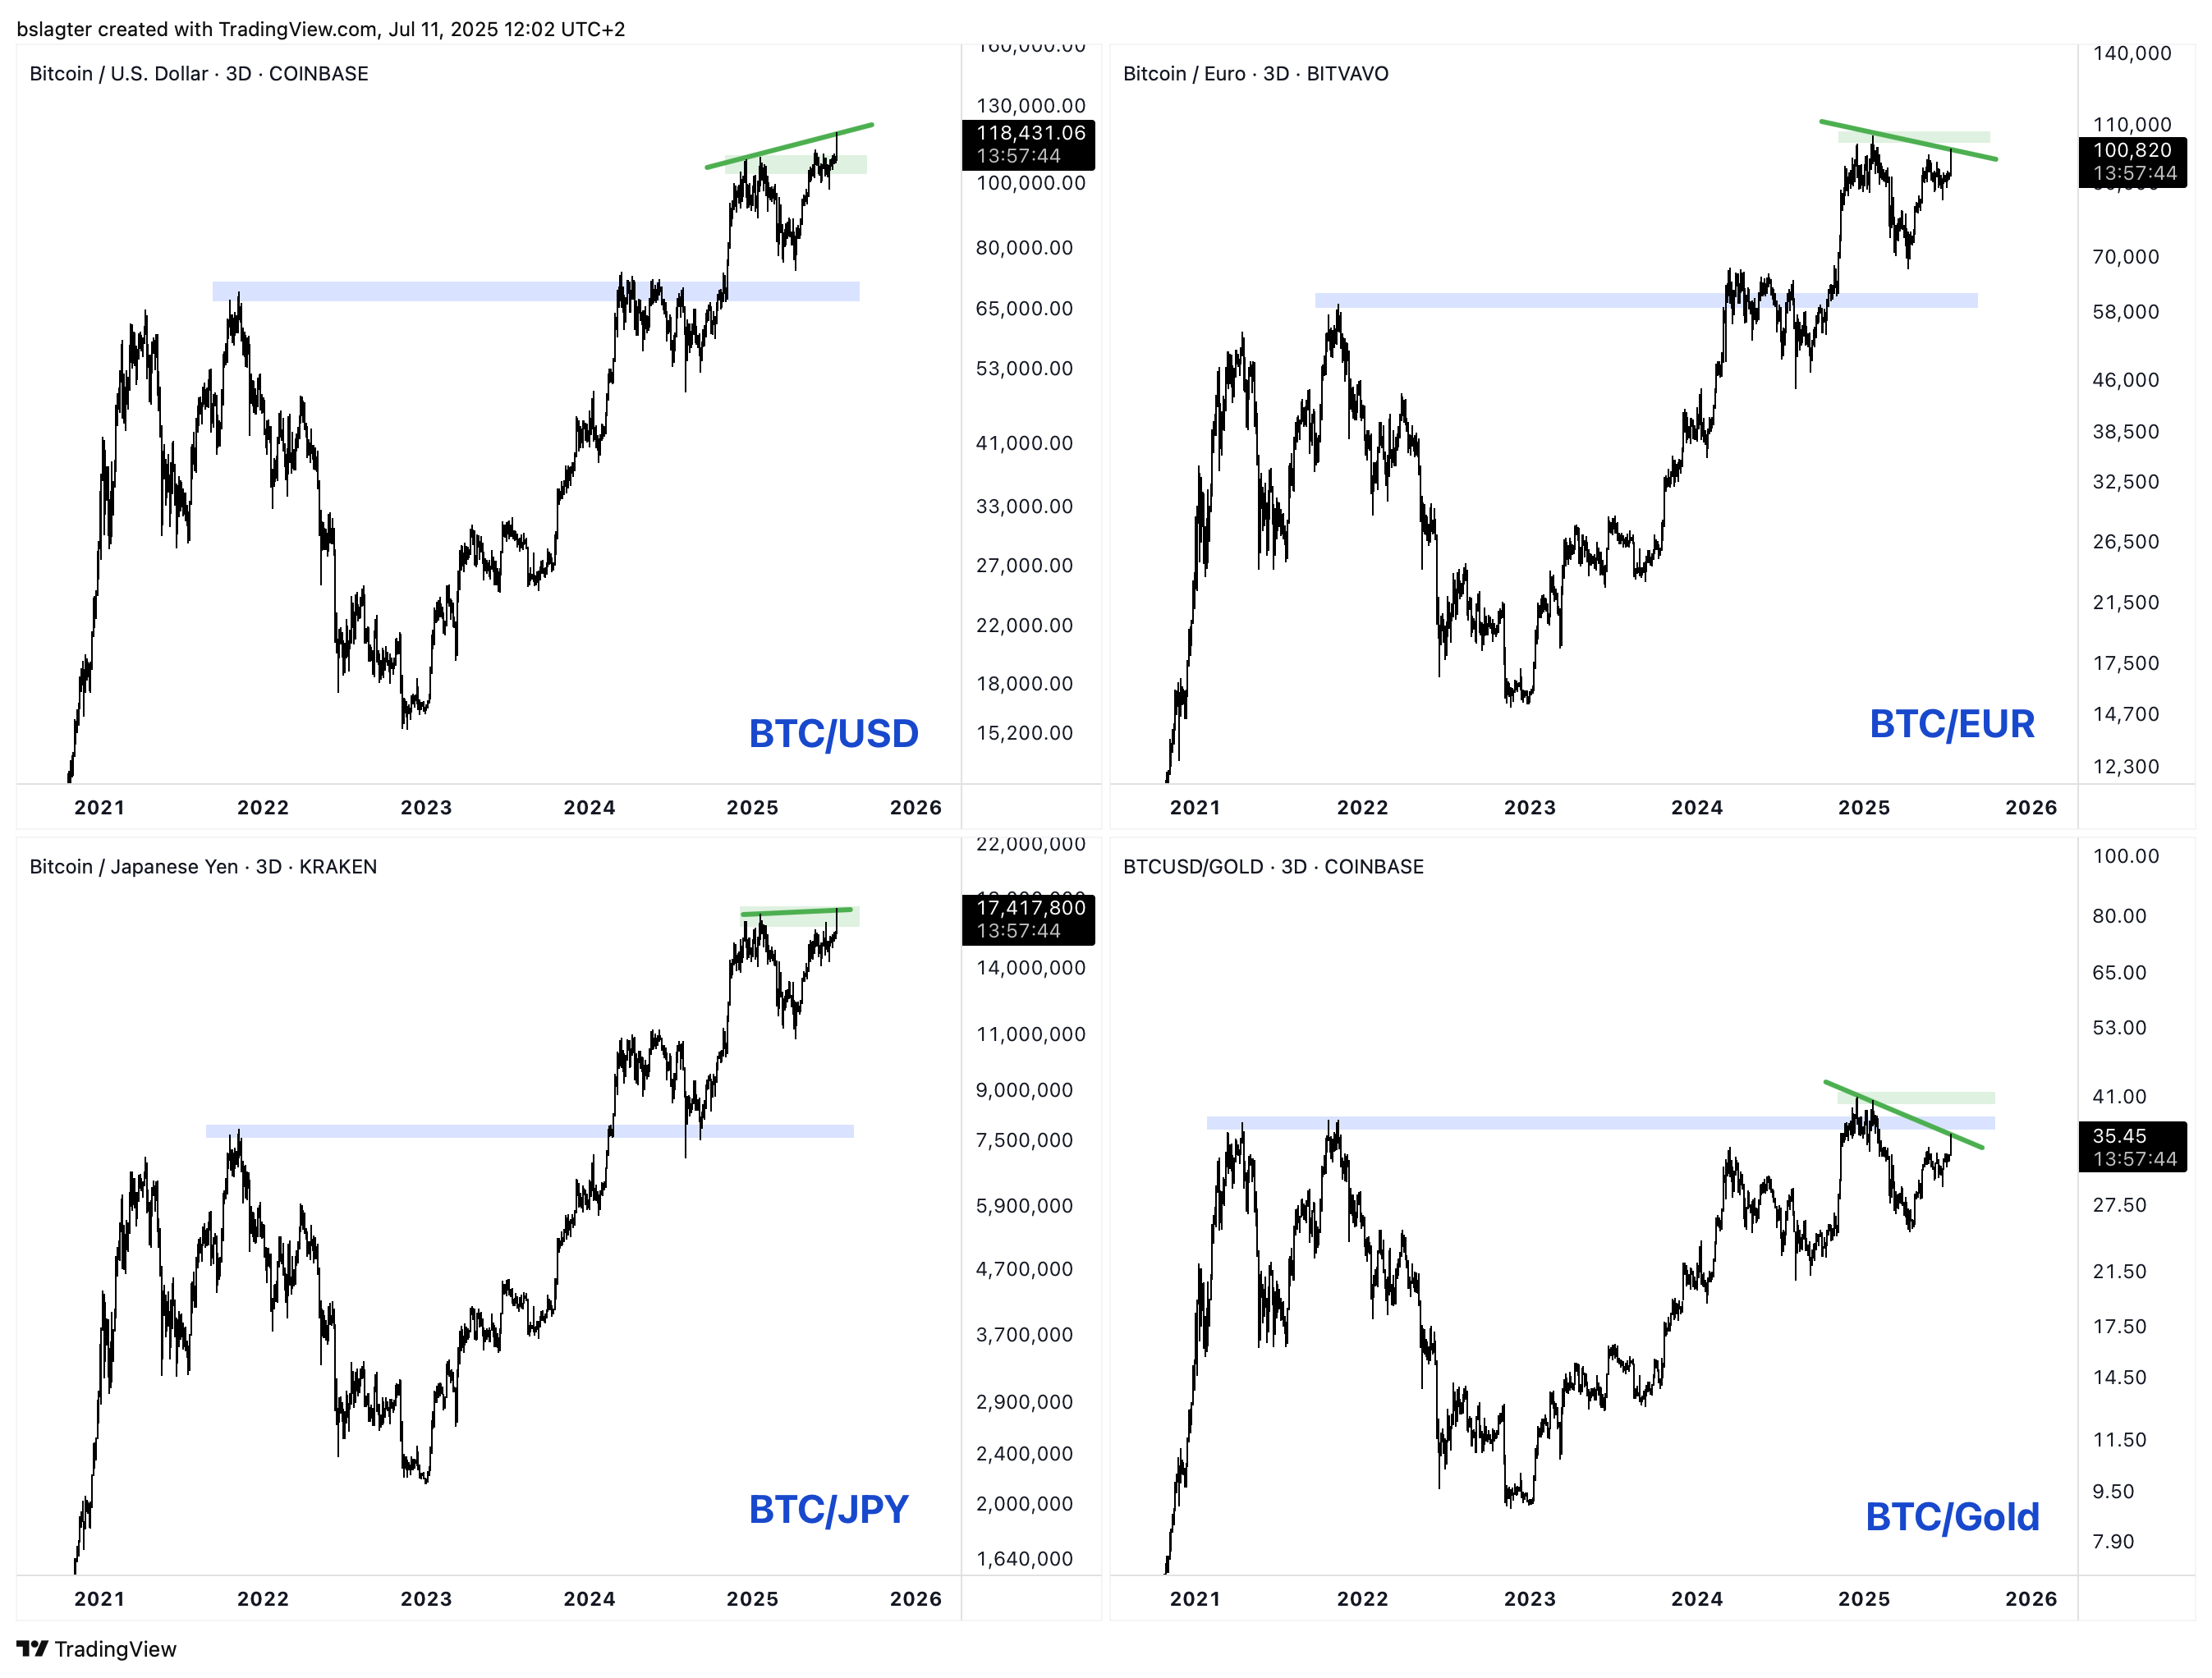
You might define a true all-time high as one reflected in key currencies, along with the S&P 500 and gold. For an all-time high in euros, the price needs to rise to 125,000 dollars. For an all-time high in gold, even to 136,000 dollars. There’s still some way to go.
Yesterday evening and tonight’s breakout, however, is encouraging. Within a few hours, the price jumped 5% from 111,400 dollars to 116,700 dollars. The daily close came in slightly lower at 116,000 dollars. Later that night, the price climbed further to over 118,000 dollars.
This marks the largest increase in the all-time high since the breakout in November last year, when we surged from 73,800 dollars to 108,000 dollars in just a few weeks.
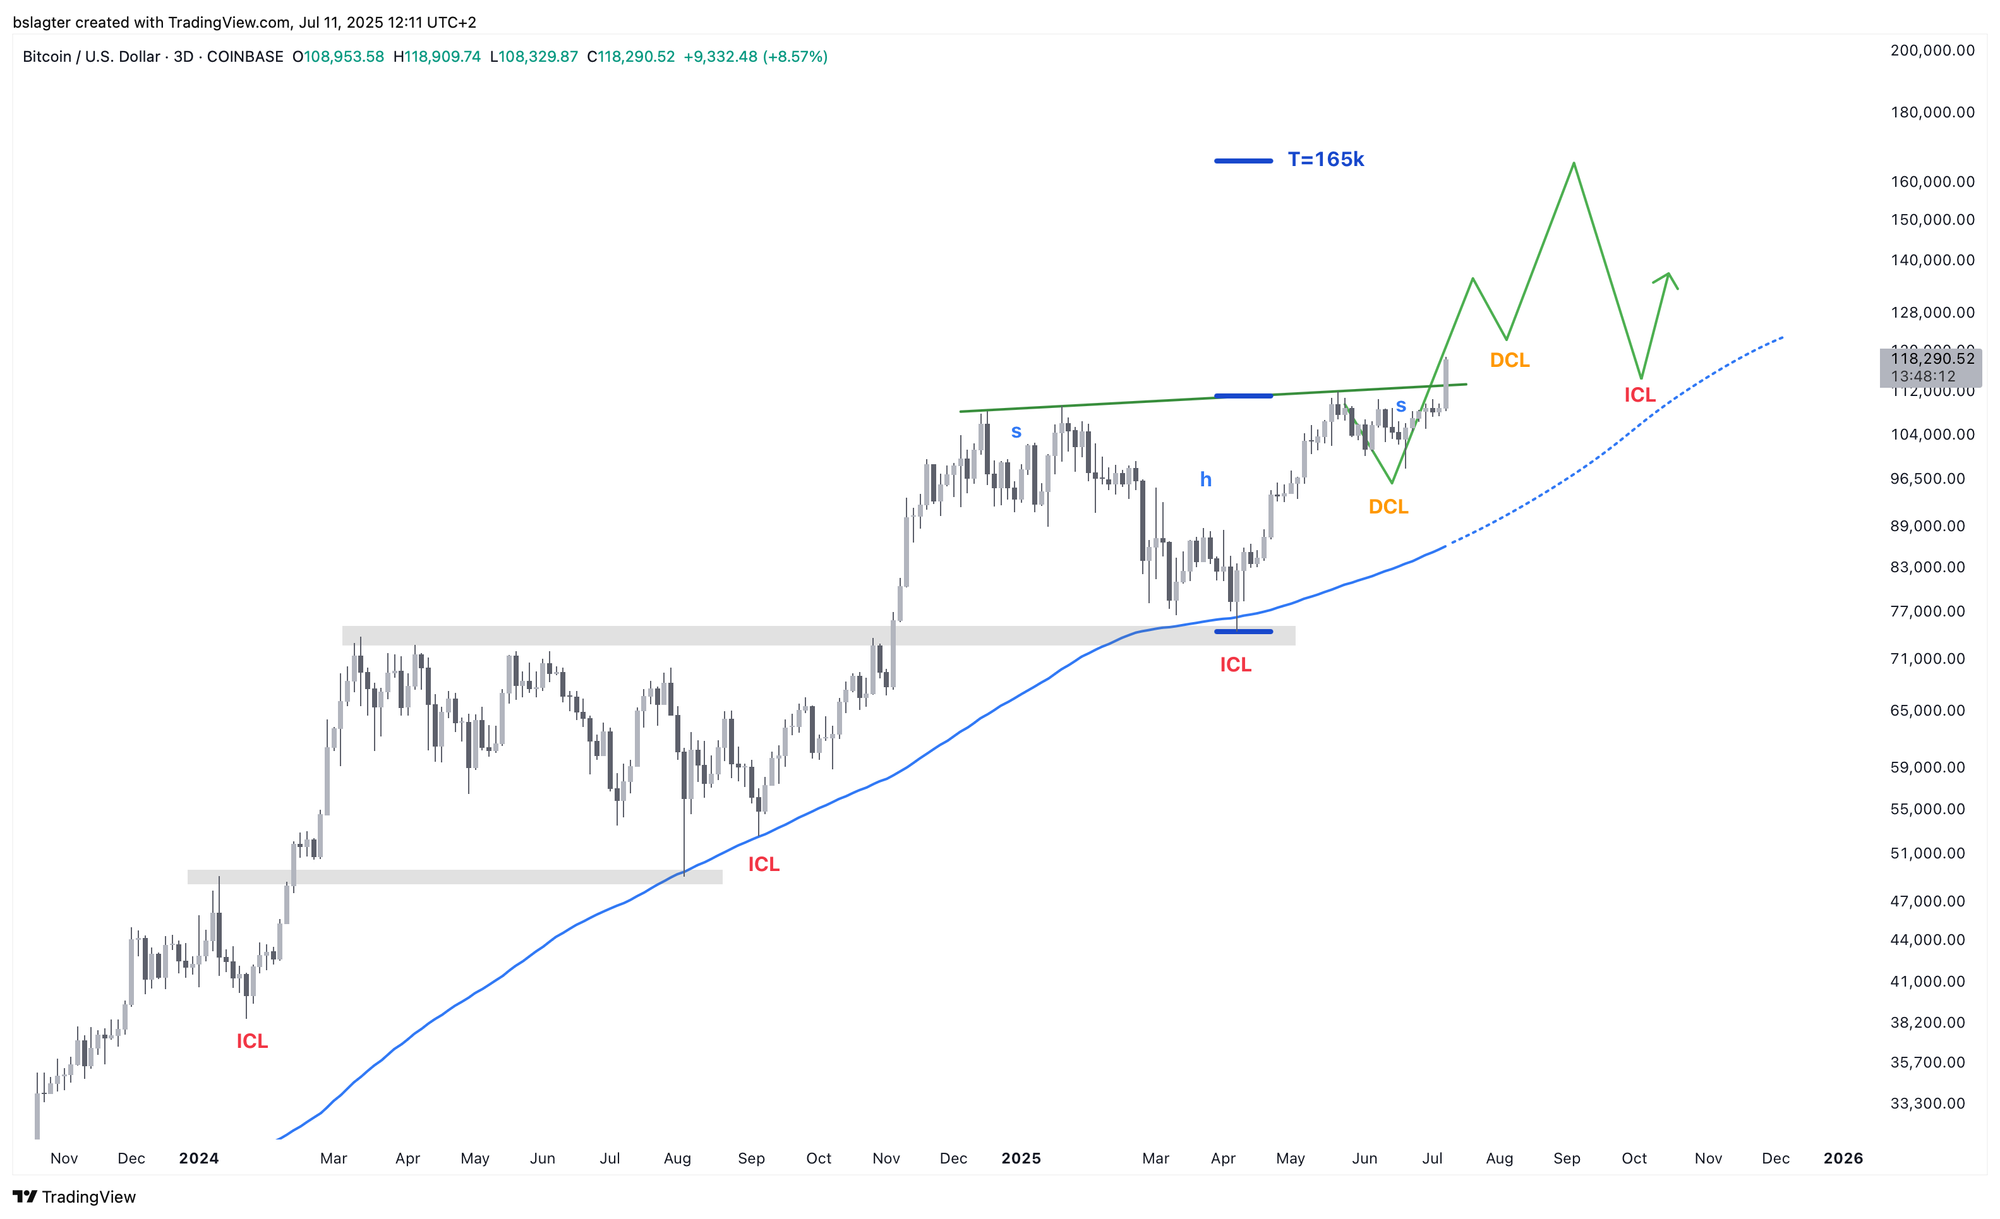
The most favorable interpretation is that we have broken the neckline of a large inverted head and shoulders pattern. In that scenario, the geometric price target would be 165,000 dollars, sometime in the coming months.
If that happens, any doubts about bitcoin’s strength would vanish. With every new measuring stick, we would then be far above all previous peaks. But we’re not there yet. First, let’s see if we can secure a weekly close above 112,000 dollars this week and if a new upward trend emerges from here.
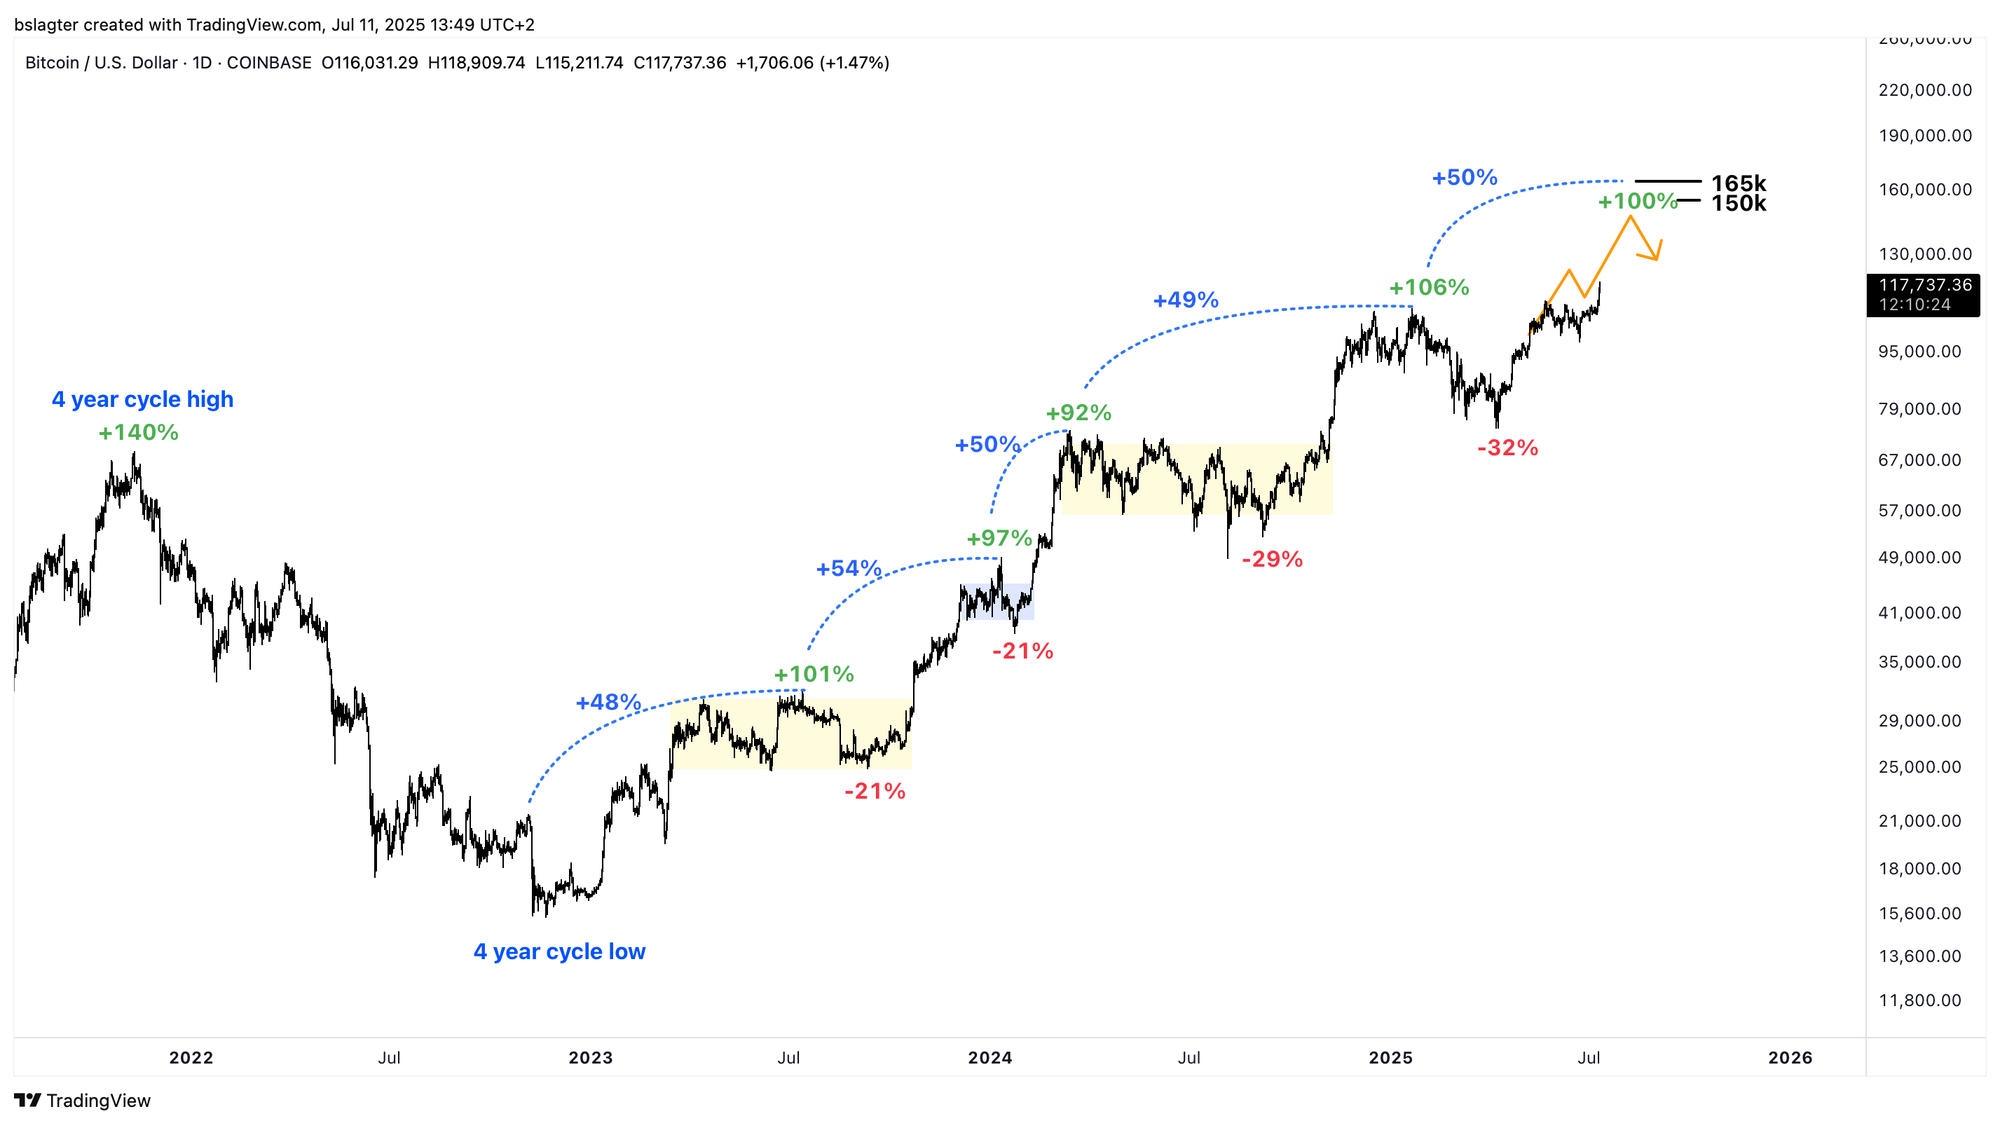
Our baseline scenario is that this weekly cycle will peak between 150k and 165k. In four previous bull markets, a breakout above the previous weekly cycle’s top was followed by a rally of roughly 50%.
The chart below comes from Alpha Markets on May 2, when we were at the start of the current weekly cycle. It has been updated with price data through today.
The last three times we saw such a 50% rally, it was accompanied by excitement, hype, and FOMO. Not to the extent witnessed during the bull markets of 2017 or 2021, but the data clearly showed that investors began easing up on taking profits. Capital flowed in and profit-taking was delayed.
George Soros referred to this as “positive reflexivity” in his General Theory of Reflexivity. It’s that feeling we often describe as, “Why should I sell today when I could get more for it tomorrow?”
You enter a phase where investors postpone cashing in their gains, so higher prices only lead to limited new supply. This, in turn, results in even higher prices and reinforces investors’ decision to delay profit taking. That is the positive feedback that makes this phenomenon reflexive.
This is reflected in the data, for example, by the rising MVRV: the market value (MV) can exceed the realized value (RV) by a wide margin. In this context, bitcoin influencers sometimes refer to this as the “multiplier” on incoming capital.
If the spectacle fails to materialize, you will soon see profit taking resume, limiting the rally’s upside.
The coming weeks will reveal whether we are witnessing the start of a new phase of upward movement, breaking well above the previous peak, or if the rise is limited to a slight expansion of the price range from 100k to 110k. We’re curious to see!
We continue with the following topics for our Alpha Plus members:
- A target of 150k to 165k
- The return of risk appetite
- Are there still any dangers for bitcoin?
- A policy mistake by the U.S. central bank, favorable to bitcoin
1️⃣ A target of 150k to 165k
Bert
Could we really be above 150,000 dollars in September? It might seem a bit unrealistic. We’ve been hovering around 100k for eight months now, and each time we move above that level, sellers flood the market with tens of thousands of bitcoins for sale.
Still, several perspectives point in that direction. We already mentioned two above:
- An average weekly cycle like we’ve seen four times before, with approximately a 100% increase from the bottom (150k) or a 50% increase from the previous peak (165k).
- The inverted head and shoulders pattern, which has 165k as its geometric price target.
We would like to add two more:
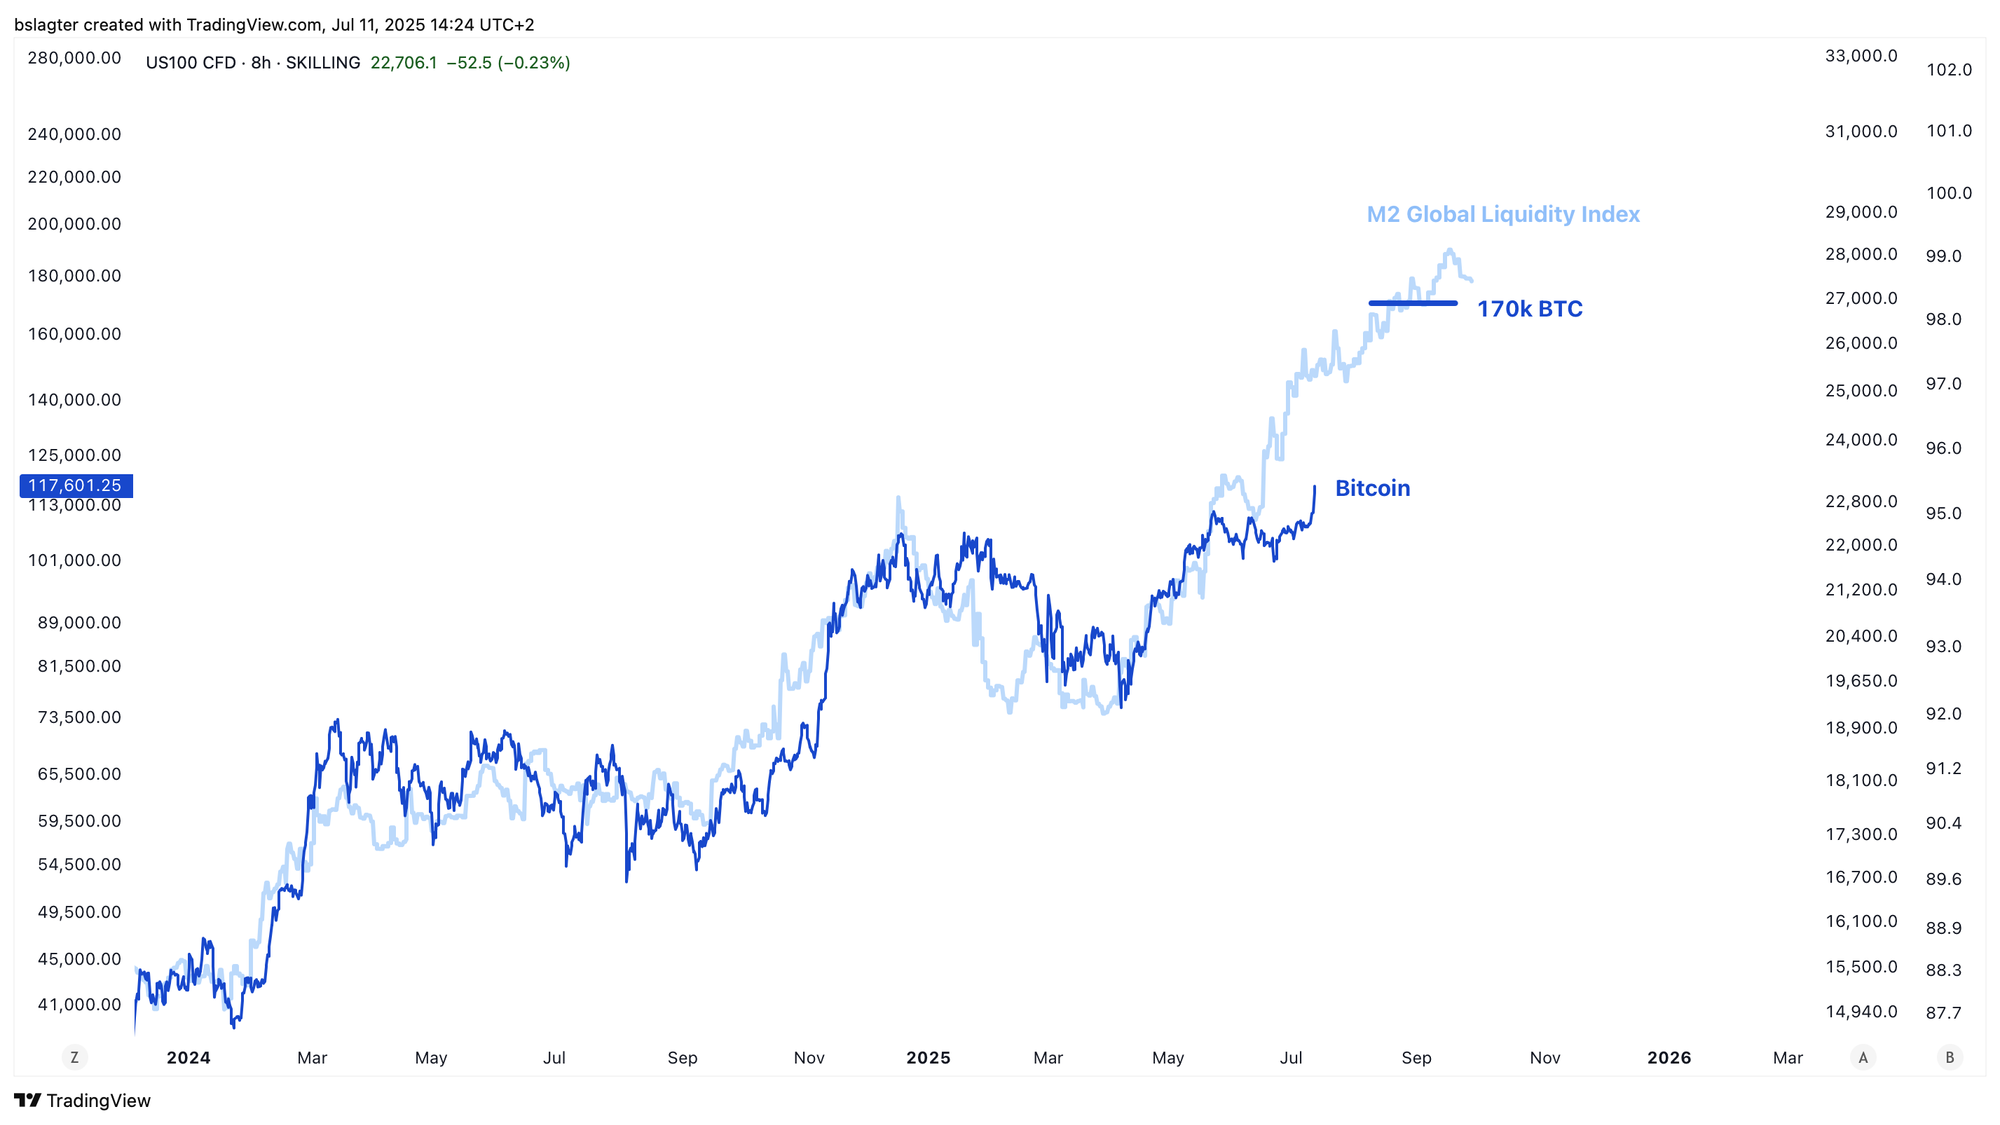
- The global money supply M2, as a predictor of the bitcoin price, points to 170k in September.
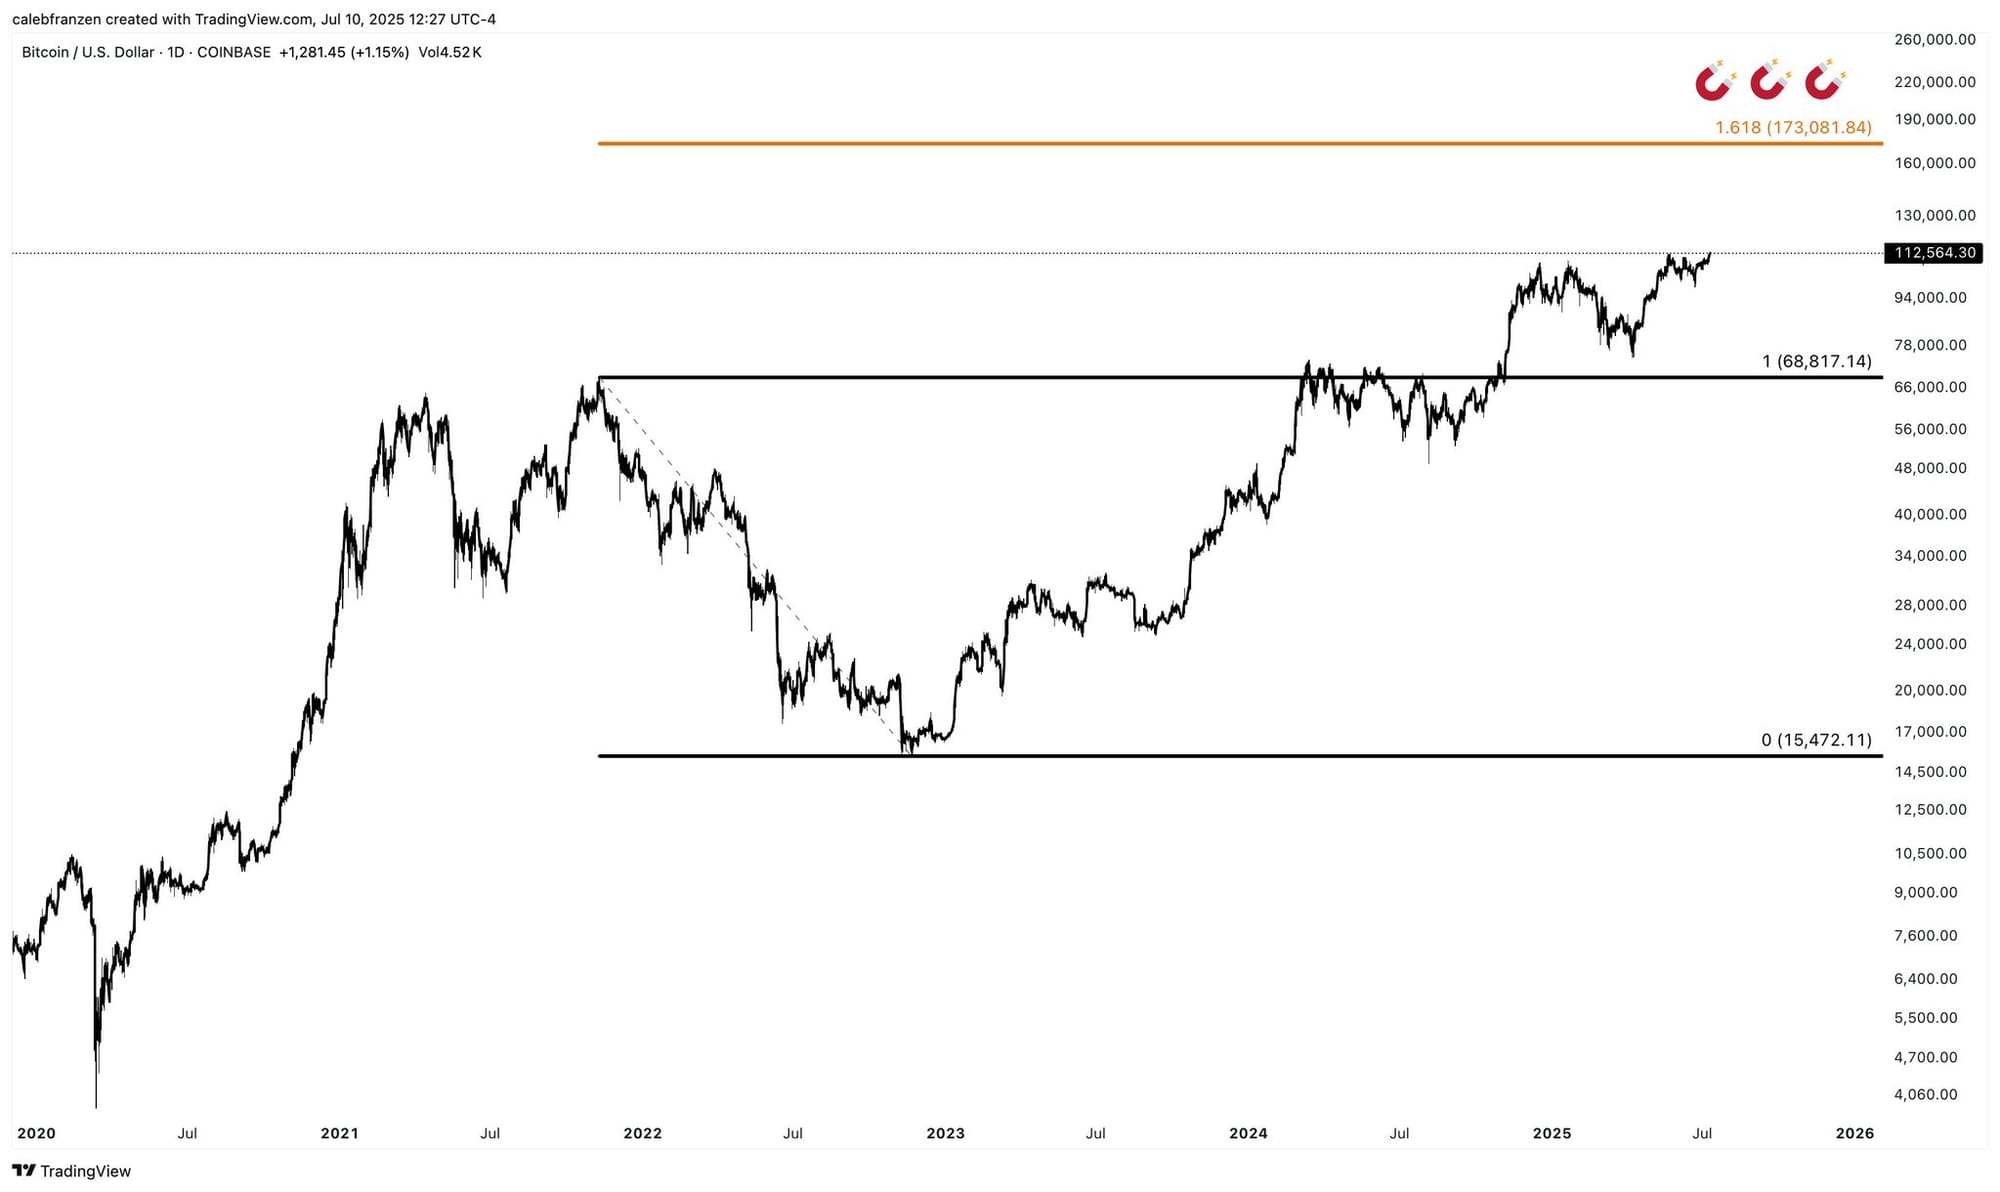
- The 1.618 Fibonacci extension of the 2022 bear market points to a target of 173k.
Let’s start with the M2 chart, which you often see on social media. It shows the sum of the M2 money supply of several large economies, shifted forward by a month or two and overlaid with the bitcoin price.
The idea is that the global money supply is a good indicator of “global liquidity” — in other words, the capital available for risk-taking. This, in turn, can reliably predict the bitcoin price.
There are some caveats, such as the fact that one must cherry-pick considerably to create this chart. In this correlation, the direction matters more than the absolute level. Nevertheless, because it is so frequently referenced, it is useful to include it in the analysis.
We finish with analyst Caleb Franzen. He posted the chart below on X with the caption “Raise your price targets”.
The chart shows a Fibonacci extension of the decline from the bull market high in 2021 to the bear market bottom in 2022, which comes out to roughly 173,000 dollars.
2️⃣ The Return of Risk Appetite
Bert
There are signs that investors are gradually embracing more risk in their portfolios once again. Consider the strong performance of the Russell 2000 relative to the S&P 500 this week, or the strength of ETH compared to BTC.
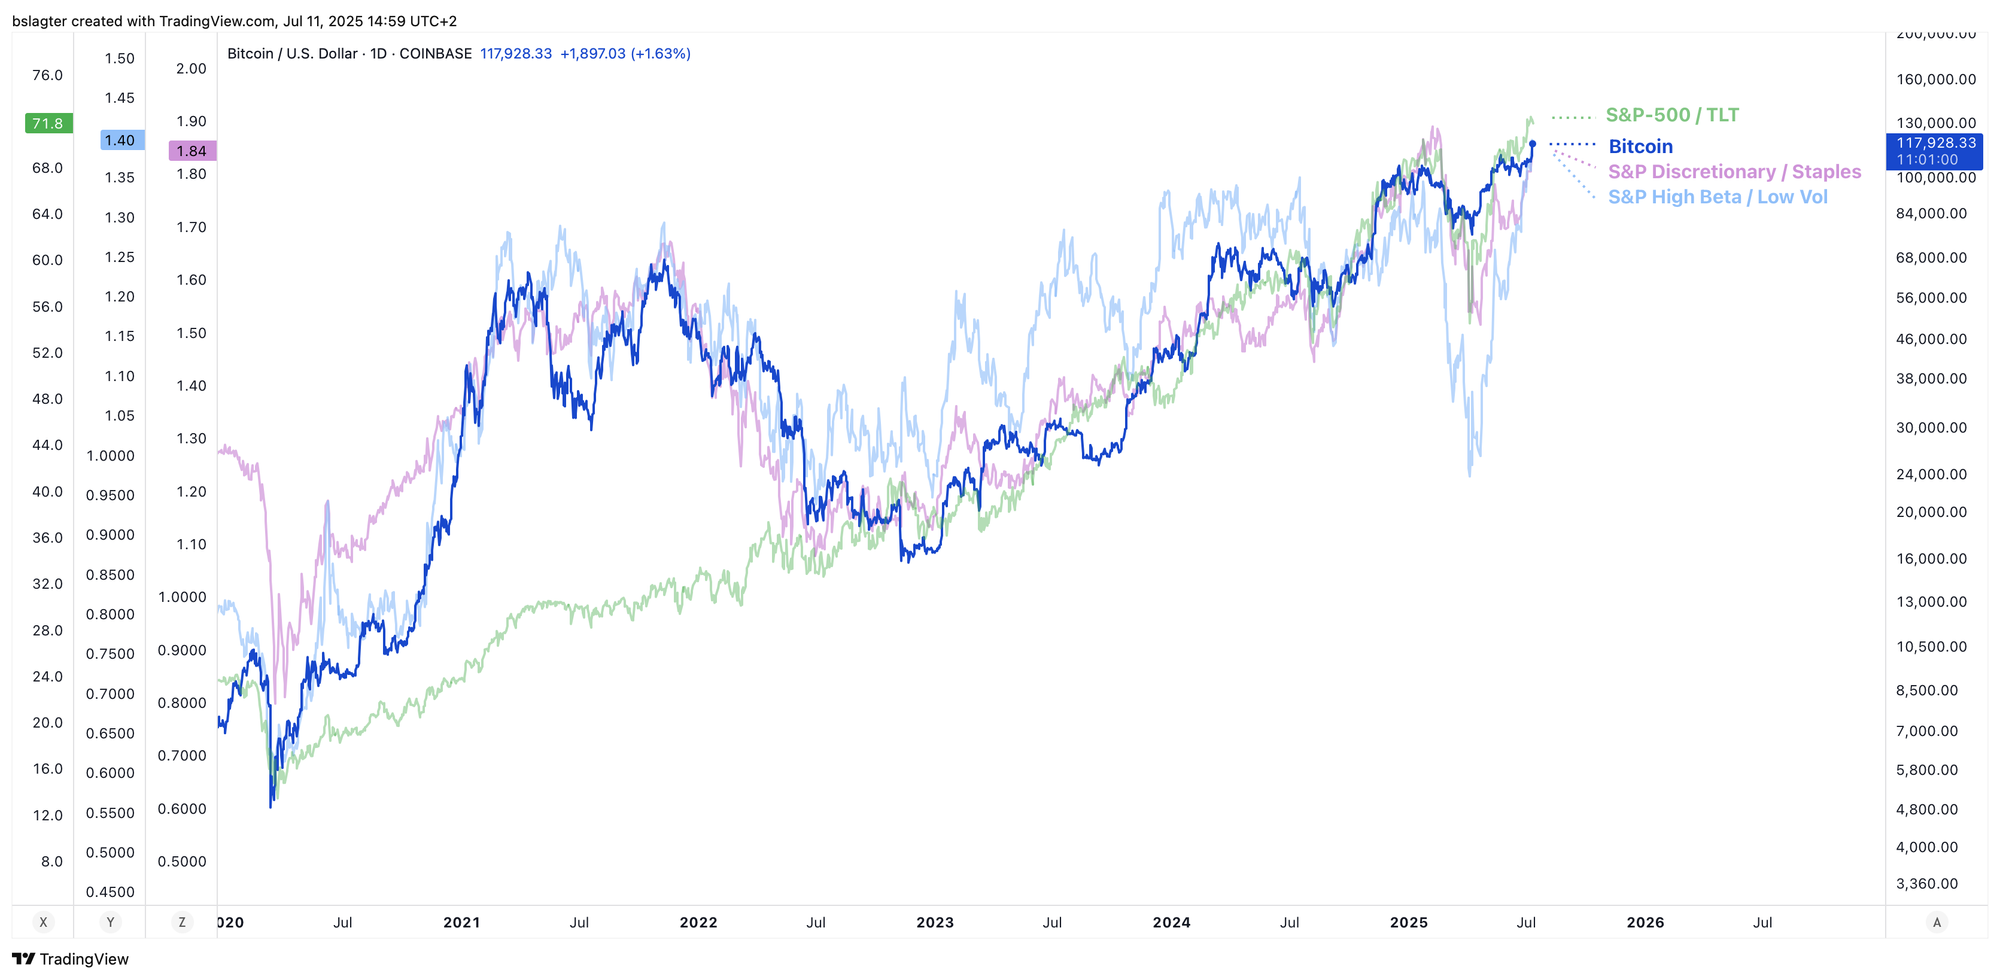
The chart below shows three ratios we regularly use to gauge investor sentiment:
- An increase in SPX/TLT (stocks vs. bonds)
- An increase in RSPD/RSPS (discretionary vs. staples)
- An increase in SPHB/SPLV (high beta vs. low volatility)
In February and March, these indicators were screaming “risk-off.” They now stand at new all-time highs.
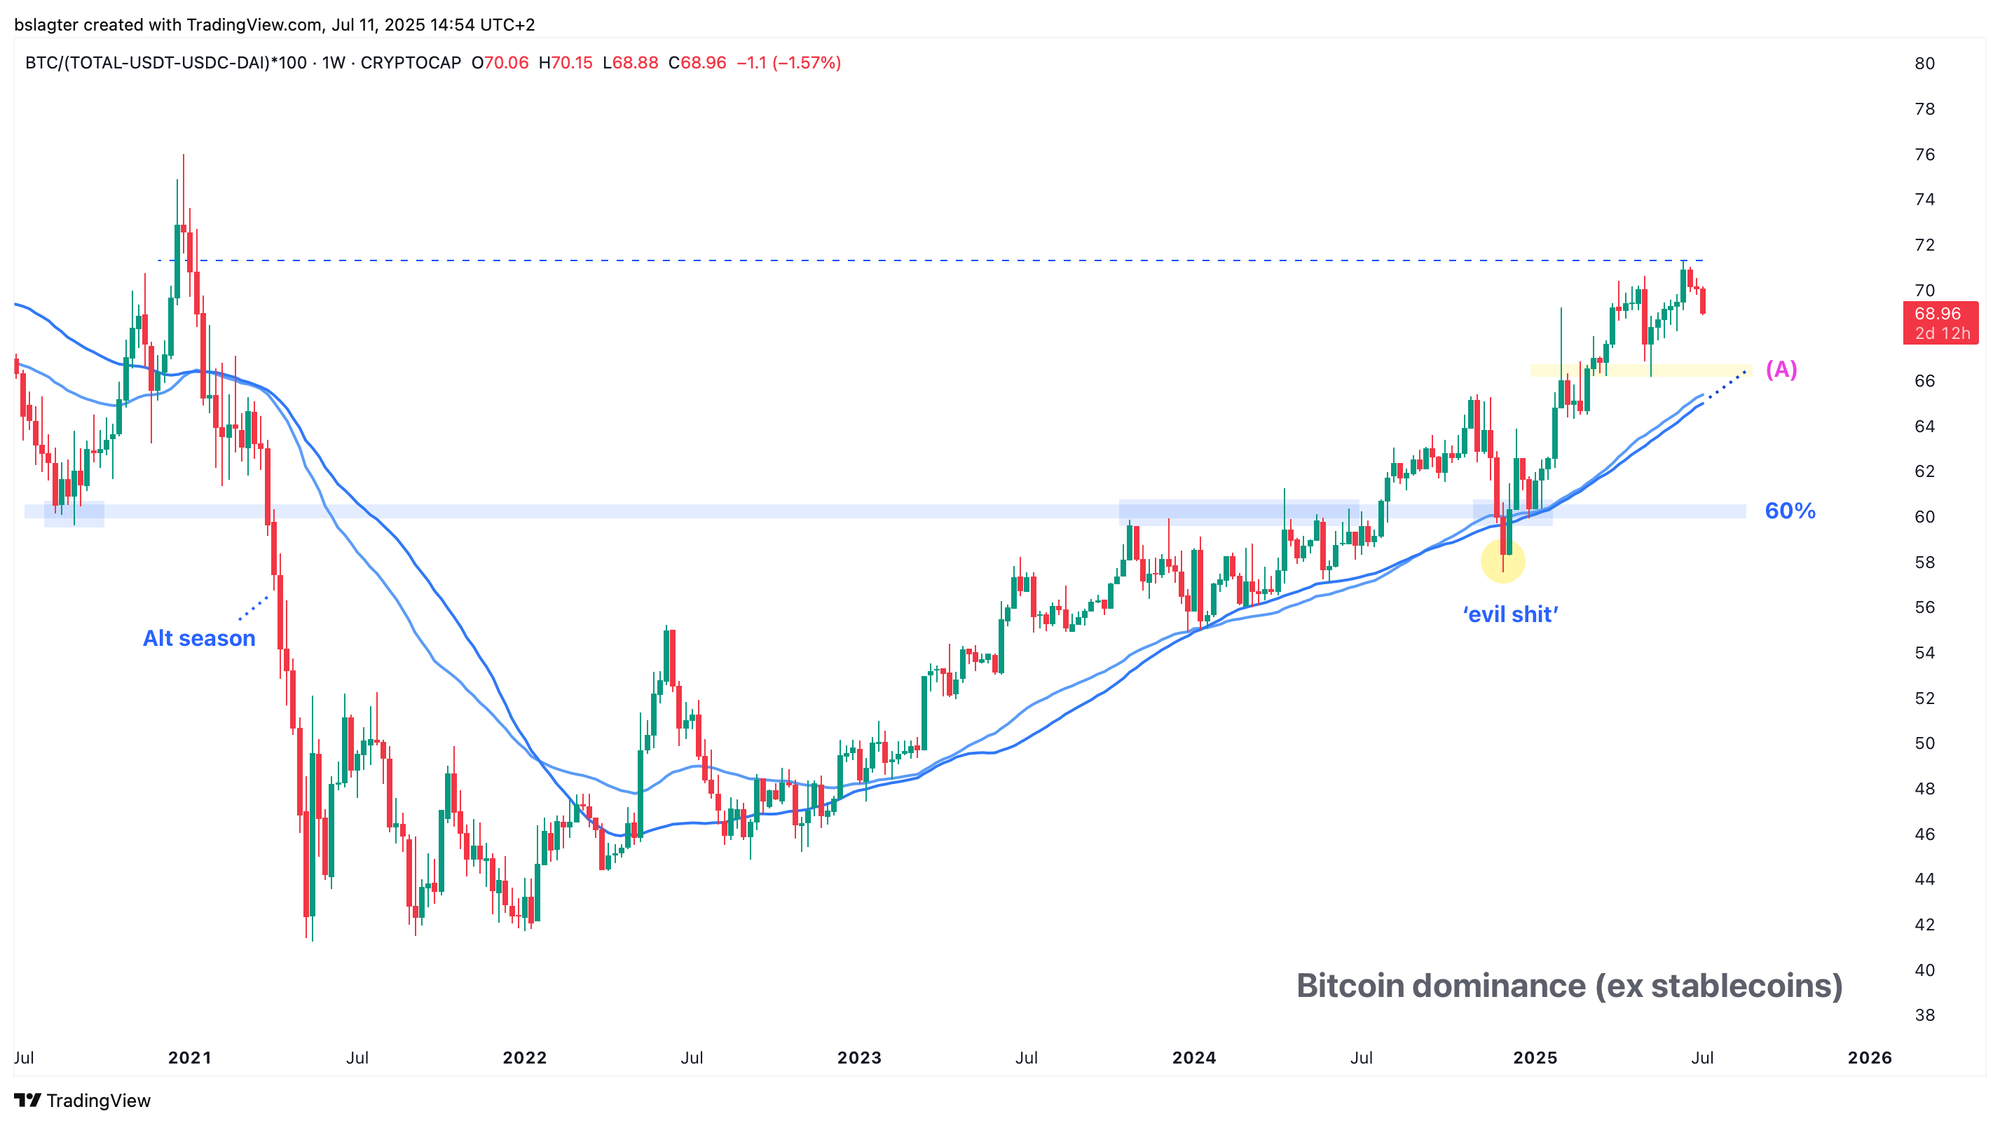
In the crypto market, increased risk appetite in the past was evidenced by a drop in bitcoin dominance. The search for yield led investors to ever riskier and more volatile assets, which, due to limited liquidity, rapidly increased in value.
Whether this trend will continue remains to be seen. Perhaps crypto stocks are the altcoins of this market cycle. But if money eventually finds its way into altcoins, it will show up in the chart below.
A breakthrough of the rising averages and a previous support level (A) would signal that the trend has reversed. Until then, the trend remains upward, and altcoins, on average, are a less attractive investment than bitcoin.
3️⃣ Are There Still Dangers for Bitcoin?
Thom
Anyone following the markets might think otherwise. The U.S. economy is running at full tilt, the labor market remains strong, governments are spending, and central banks appear willing to adjust. Additionally, new publicly traded companies are entering the bitcoin space every week while existing players continue to accumulate.
Based on the overall picture, I remain bullish. Still, I do see some potential obstacles in the short term.
The narrative above seems to be the emerging consensus. The market barely sees any risks in Trump’s trade war. Prices hardly react to news about tariffs. Deadlines are being postponed, or so it seems—the market believes. The panic of April, when bitcoin found its local bottom, has given way to an almost serene calm.
Initially, there was concern that the tariffs would trigger a new wave of inflation. A few months later, that concern has completely disappeared. Is that justified? It might be, but it may also be too early to draw firm conclusions.
My main point is this: sentiment is exceptionally positive right now. Usually, these are precisely the moments when markets are most vulnerable to headwinds. I see no fundamental reason for a trend reversal, but a brief setback wouldn’t surprise me.
Especially when you consider that since the bottom in April, bitcoin has risen by almost 50%, and major U.S. stock indices are reaching new all-time highs after a massive crash.
So, my conclusion: over the longer term, the outlook for bitcoin is very positive, but in the short term, a minor pullback wouldn’t be surprising. However, a deep correction like the one we saw in April or a full-blown bear market seems highly unlikely.
4️⃣ A Policy Mistake by the U.S. Central Bank, Favorable to Bitcoin
Thom
The U.S. labor market is robust, economic growth is steady, Trump isn’t cutting spending and continues to tap into government funds, and the U.S. central bank appears to be making a subtle policy mistake.
This combination of favorable conditions places us in an upward phase of the credit cycle. It is relatively easy for companies and households to obtain credit because confidence in the economy’s resilience is high. As a result, risk appetite is elevated, which typically creates a favorable climate for risk investments like bitcoin.
This is evident, among other things, in the credit spread — the extra interest companies have to pay (reflecting higher risk) compared to government bonds (indicating lower risk), which is moving toward the bottom reached last winter.
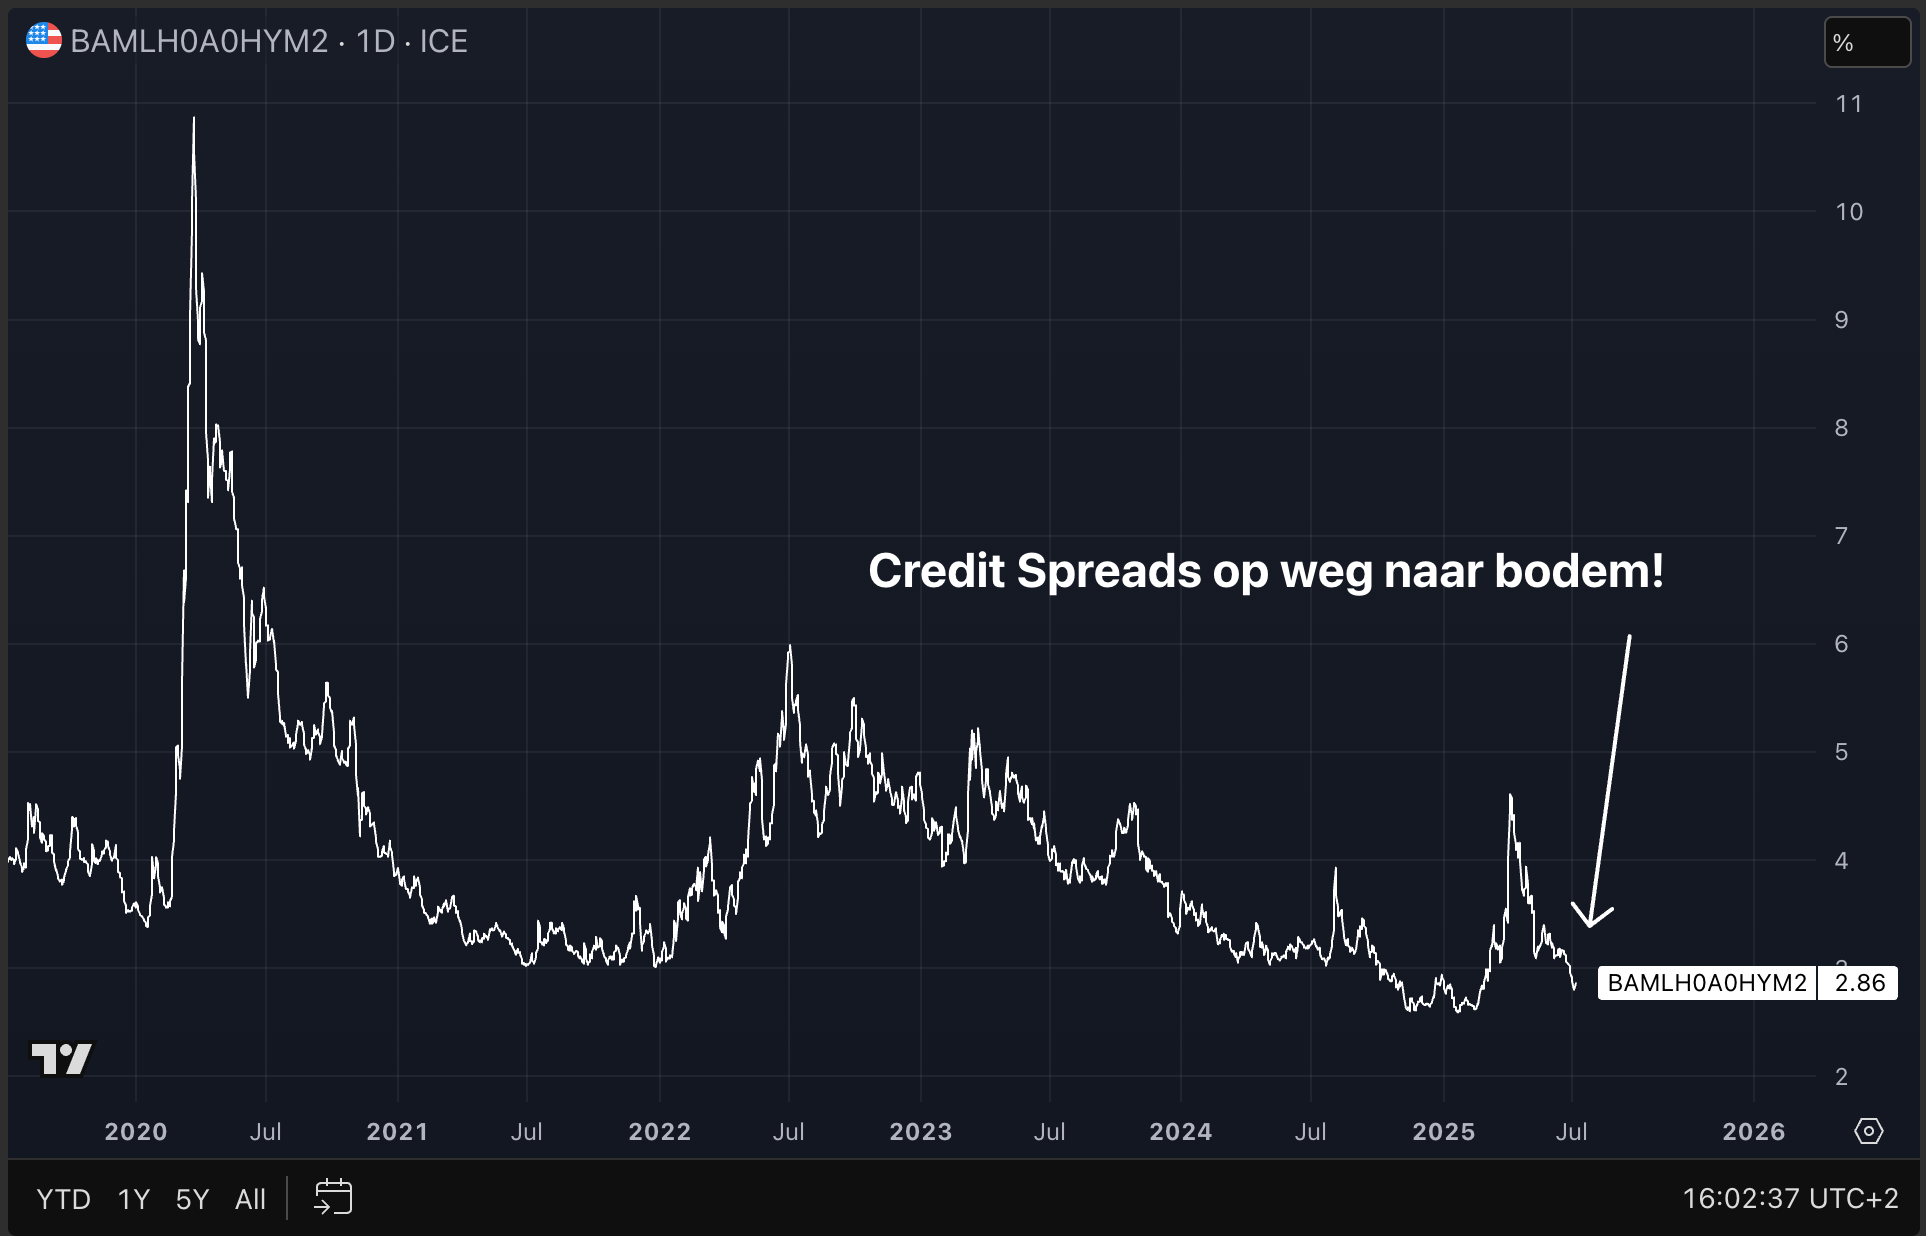
The extra interest companies have to pay falls when lenders perceive little risk in the economy. As the probability of a recession diminishes and the risk of defaults decreases, the credit spread narrows. In other words, the U.S. economy is performing well, and liquidity is flowing abundantly through the system.
At the same time, the U.S. central bank appears to be making a policy error by not responding more robustly to Trump’s political pressure to lower interest rates. The labor market looks strong, economic growth is on track, and the S&P 500 is hitting all-time highs. Under normal circumstances, these are not the conditions under which one would debate rate cuts.
Yet we are witnessing this, and the market is pricing in two to three 25-basis-point rate cuts by the end of 2025. For 2026, roughly two more cuts are expected.
This isn’t a problem for investors—if anything, it’s like throwing fuel on the bull market’s fire. However, it is a policy mistake because the U.S. central bank is effectively giving both economic growth and inflation an extra boost. This leads to higher long-term interest rates (not what Trump wants), which could eventually put an end to the bull market.
Thank you for reading!
To stay informed about the latest market developments and insights, you can follow our team members on X:
- Bart Mol (@Bart_Mol)
- Peter Slagter (@pesla)
- Bert Slagter (@bslagter)
- Mike Lelieveld (@mlelieveld)
We appreciate your continued support and look forward to bringing you more comprehensive analysis in our next edition.
Until then!