Bitcoin grinds its way to a new record high
Bitvavo invites you to join a community event in Amsterdam on Aug 27! Meanwhile, bitcoin found support at $112k, surged 11% to $124,500, then tumbled after its record spike. Can the crypto market’s resilience defy volatility and shifting ETF inflows?

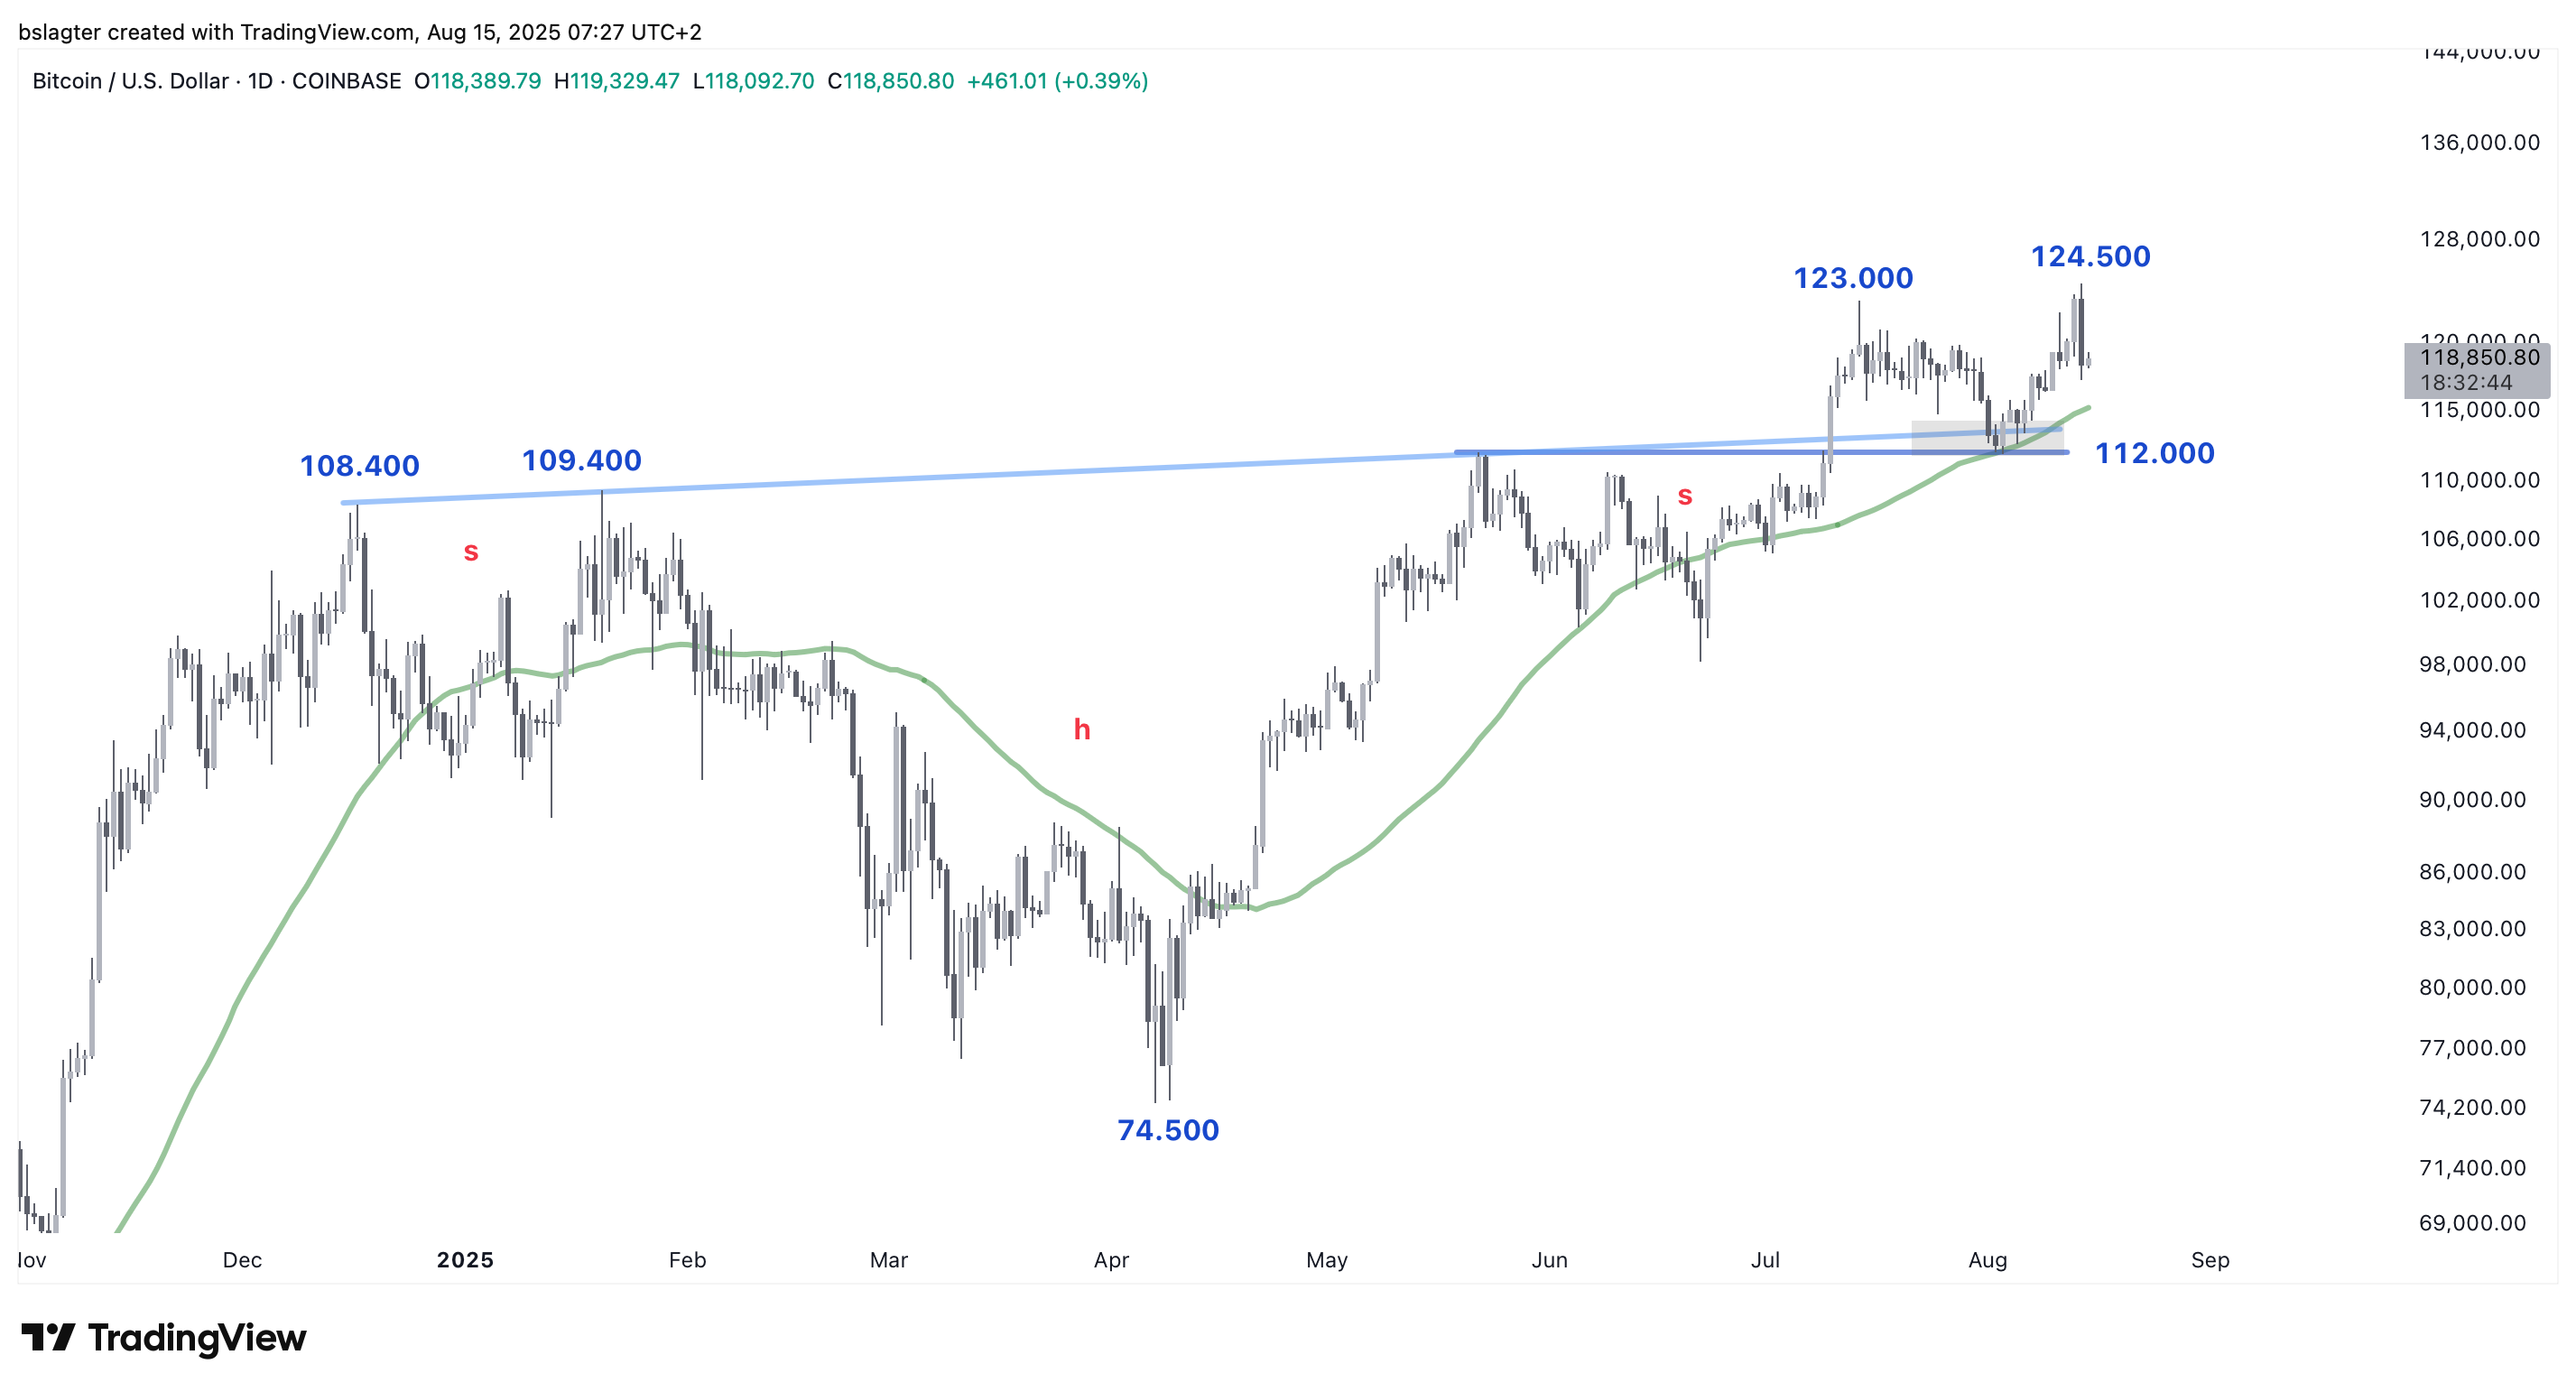
On August 3, bitcoin found support around the $112,000 level. This price had previously marked the all-time high, formed the neck of a significant head-and-shoulders pattern, and aligned with the 50-day moving average.
With the dip to $112,000, the lightly traded zone between 112k and 115k was revisited. The price quickly sliced through this area on July 10, resulting in very little trading activity. CME futures even skipped this price range entirely, as the Chicago exchange was closed at the time.
The test was successful. What was once resistance has now turned into support. In the twelve days following August 3, the price climbed 11% from $112,000 to $124,500.
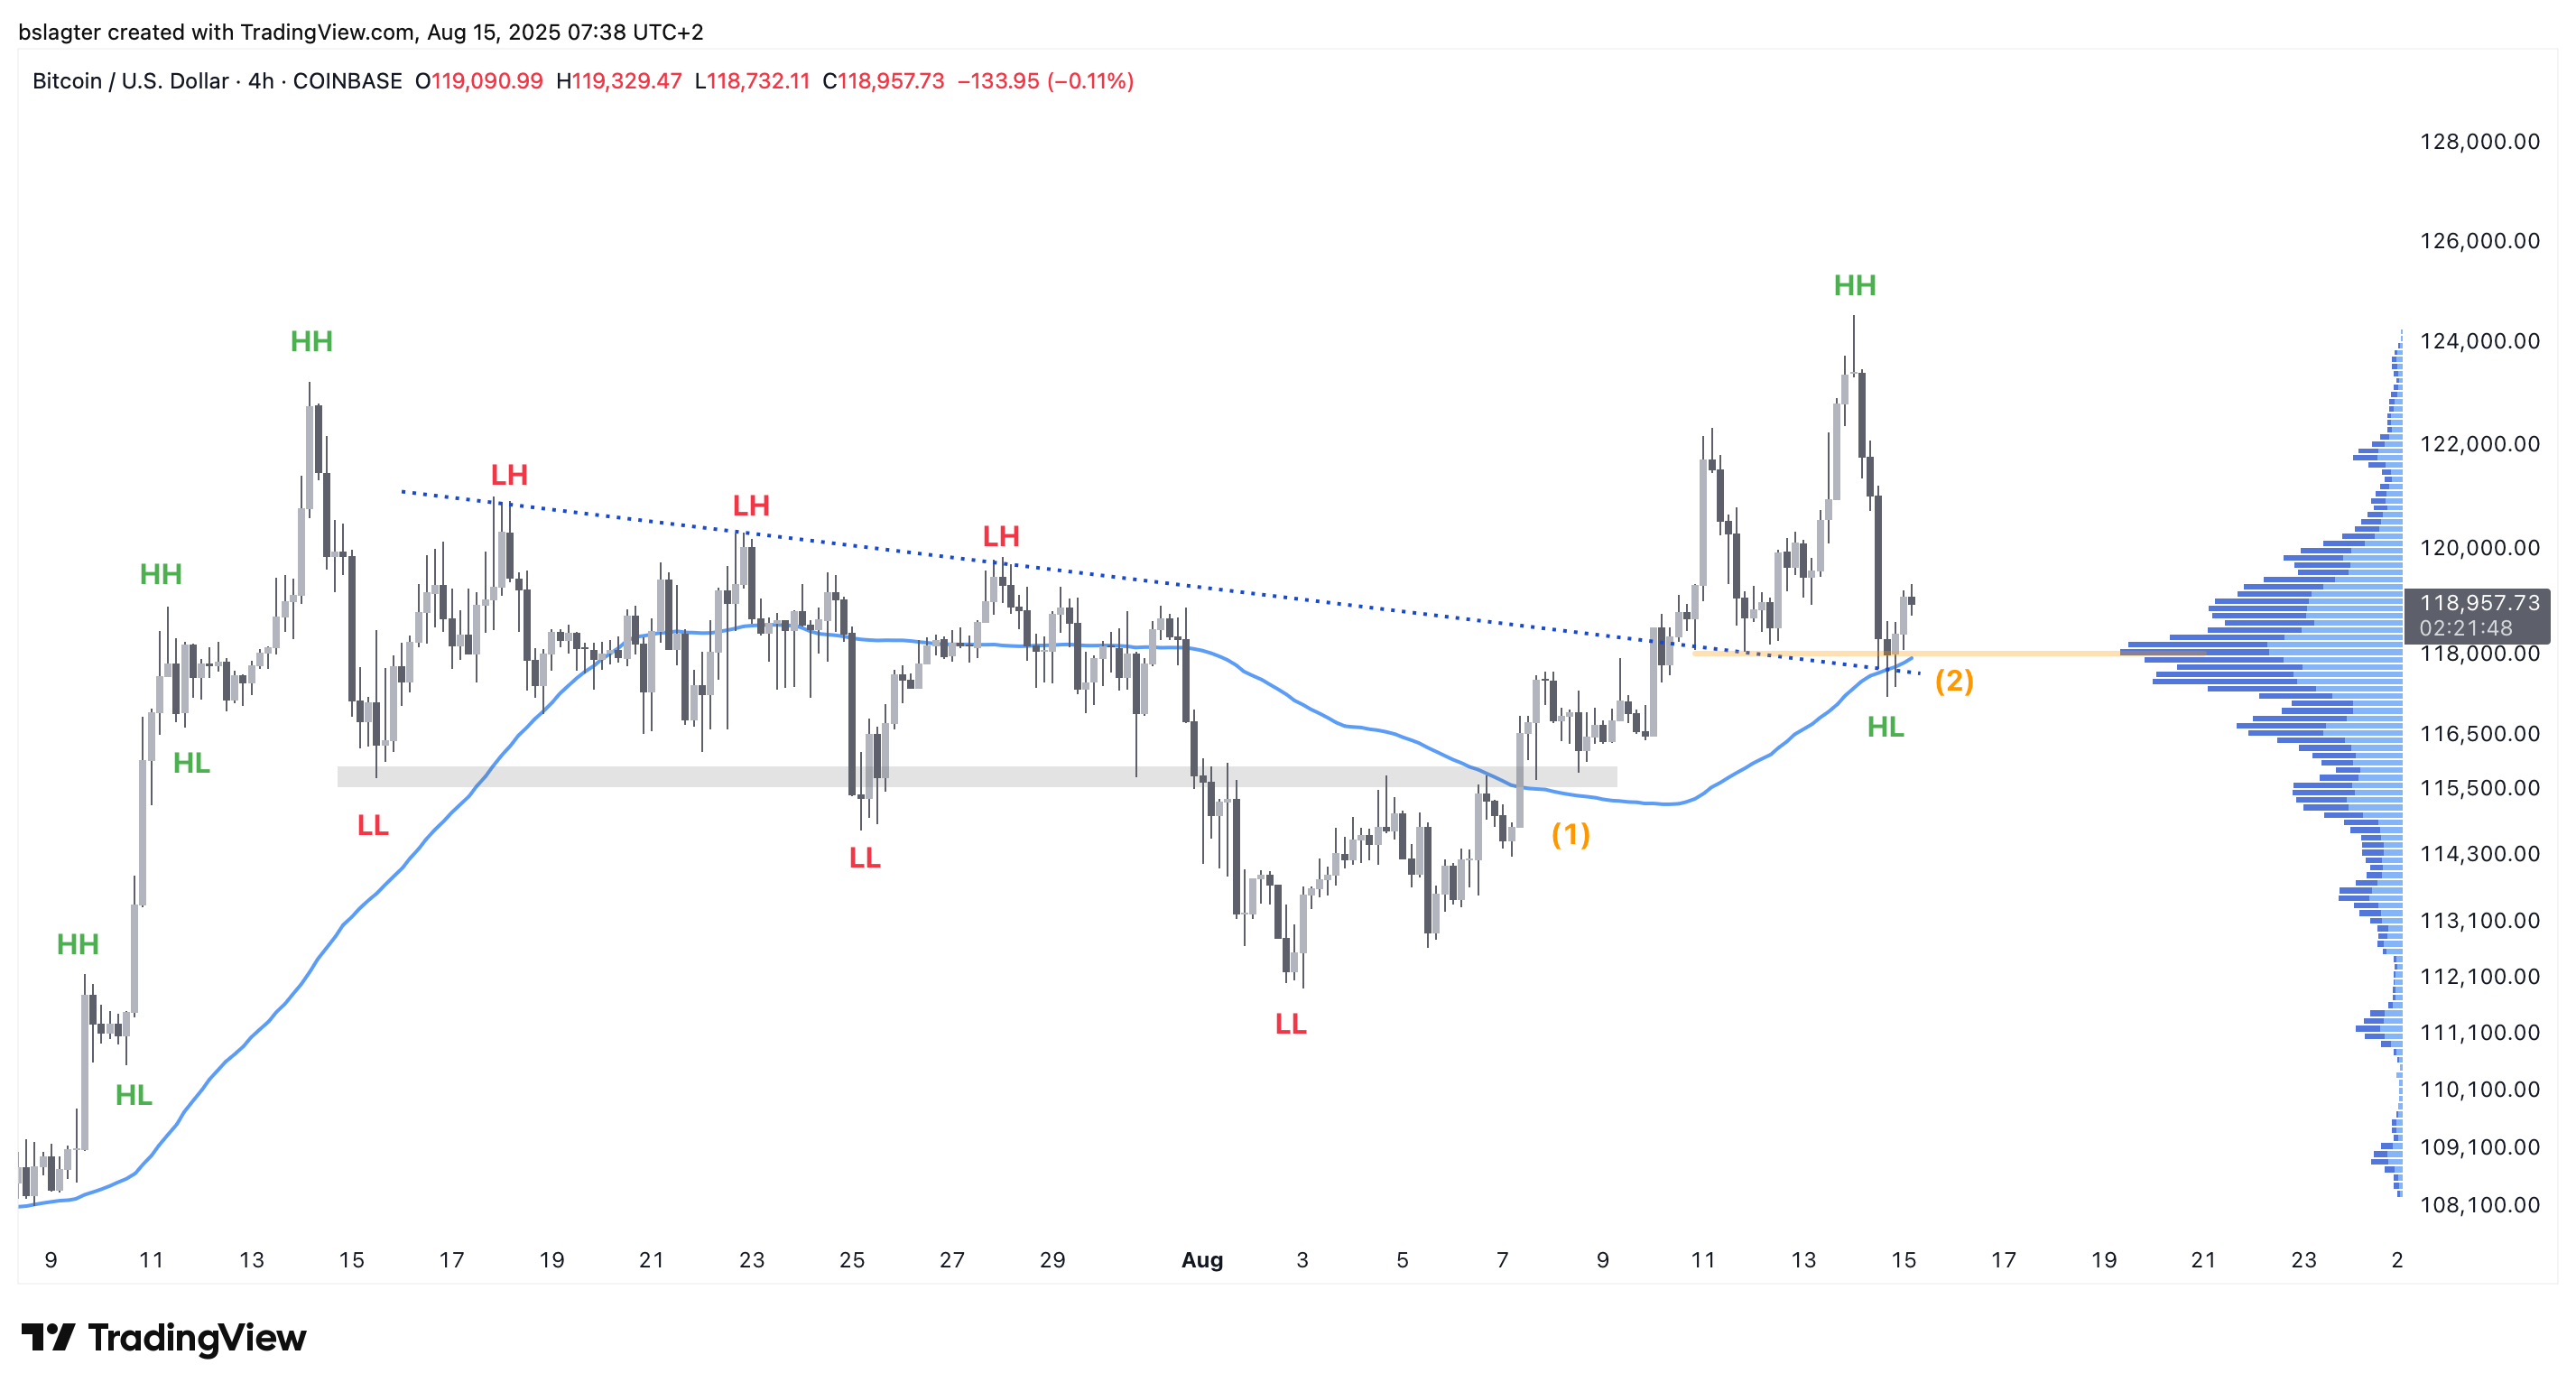
Below is the 4-hour chart, where we highlight two key points, marked as (1) and (2).
First – the bounce above $115,800 on Thursday, August 7. A strong candle pushed bitcoin back above a level that had previously acted as both support and resistance. In doing so, the price also broke through the 10-day moving average, an important indicator that a new daily cycle may be underway.
Moving forward, we hope the horizontal level and the 10-day moving average will provide support; a daily close below these levels would be a setback for the bulls.
Second – the sharp drop on Thursday, August 14. To recount, on Wednesday evening the price soared above $123,000 for the first time, peaking at $124,500 at 2:30 AM on Thursday.
This was an all-time high—just barely surpassing the record set exactly one month earlier on July 14, but a record nonetheless.
Sometimes a breakout is sustained—the price stays above the previous all-time high, prompting traders to jump in to avoid missing the next surge. A spike in trading volume typically reinforces the upward move.
That, however, wasn’t the case here.
Trading volume remained low, and other indicators were less supportive. Inflows to bitcoin ETFs were barely positive, and on-chain data hinted at a slight shift from accumulation to distribution.
After the $124,500 peak, the price gradually drifted lower. Then, at 2:30 PM on Thursday, a major blow occurred: PPI inflation exceeded expectations, sparking panic among leveraged traders. In just four hours, nearly $700 million in leveraged positions were liquidated, according to Coinglass.
Bitcoin’s price fell to $117,200, nearly 6% below the peak achieved less than 24 hours earlier.
This drop isn’t a disaster in itself. A defining trait of an uptrend is a series of higher highs (HH) and higher lows (HL). The $124,500 made a higher high, and now the market has the opportunity to form a higher low as well.
If point (2) indeed represents the low, then the damage is minimal. We would still be above the descending trendline, the 10-day moving average, and the volume profile’s point-of-control. That higher low would then be established.
However, if in the coming days we dip below that level, the short-term outlook would worsen, and it might be necessary to retest the horizontal level of $115,800—or even the $112,000 low.
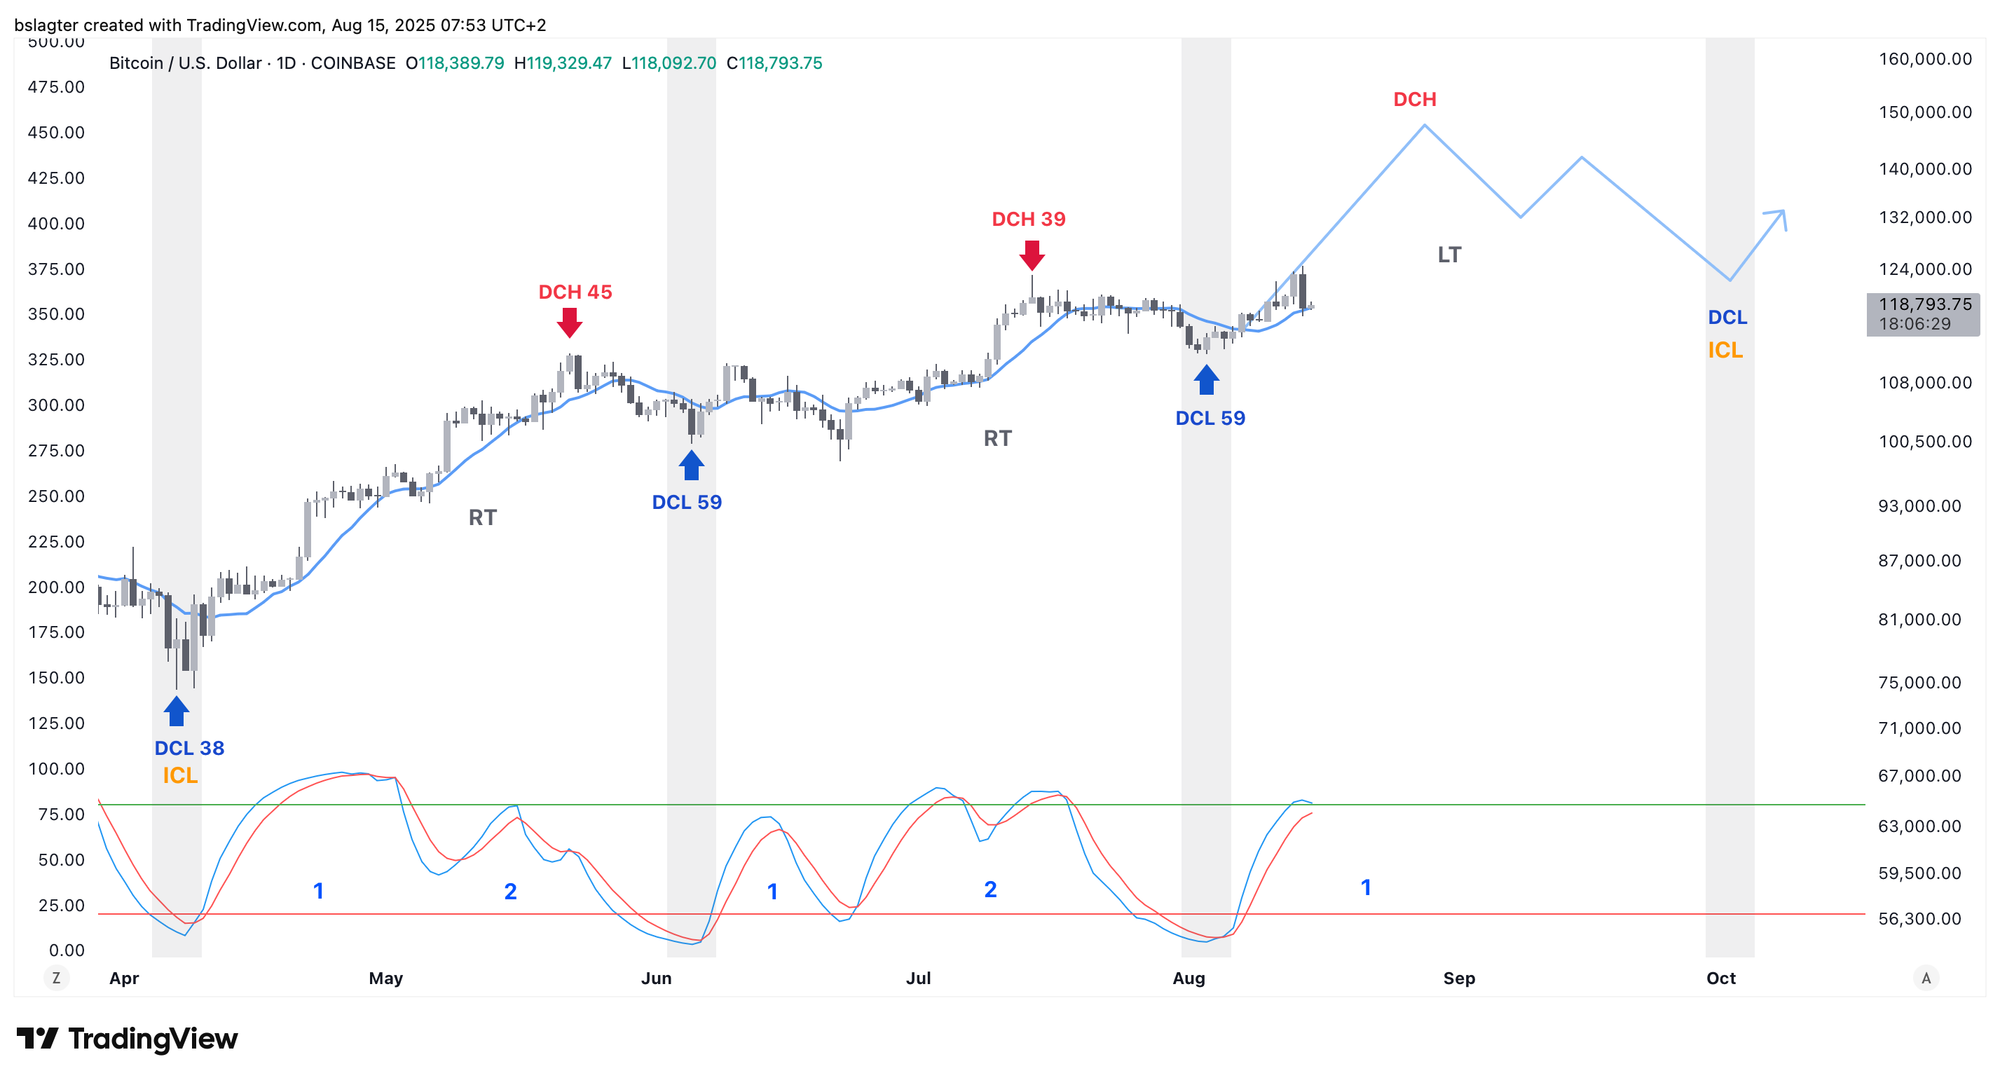
From a cycle analyst’s perspective, there is now enough evidence to designate August 3 as the daily cycle low (DCL). Today marks day 12 of the third daily cycle within this weekly cycle.
Typically, this daily cycle would produce a higher high than the previous cycle within the first 30 days, after which a period of sustained weakness usually leads to the daily and weekly cycle low (ICL).
Cycle analysis helps reveal the rhythm of alternating strength and weakness, setting expectations for how future highs and lows compare to earlier ones. However, it only indicates whether they are “higher” or “lower.” For precise price targets, other tools are needed.
In this YouTube video, we identified a price target between $150,000 and $165,000 for the current weekly cycle. That target now feels quite distant; something truly extraordinary would need to occur in the next two to three weeks to hit that level.
Despite all this, the data show no signs of an explosive upward movement for bitcoin. The bulls are struggling, making two steps forward only to retreat significantly.
One possible reason is that investors have shifted their focus to altcoins, particularly ETH. Since the low on August 3, bitcoin has risen 11% while ether surged by as much as 43%. Even during yesterday’s decline, ETH remained notably resilient.
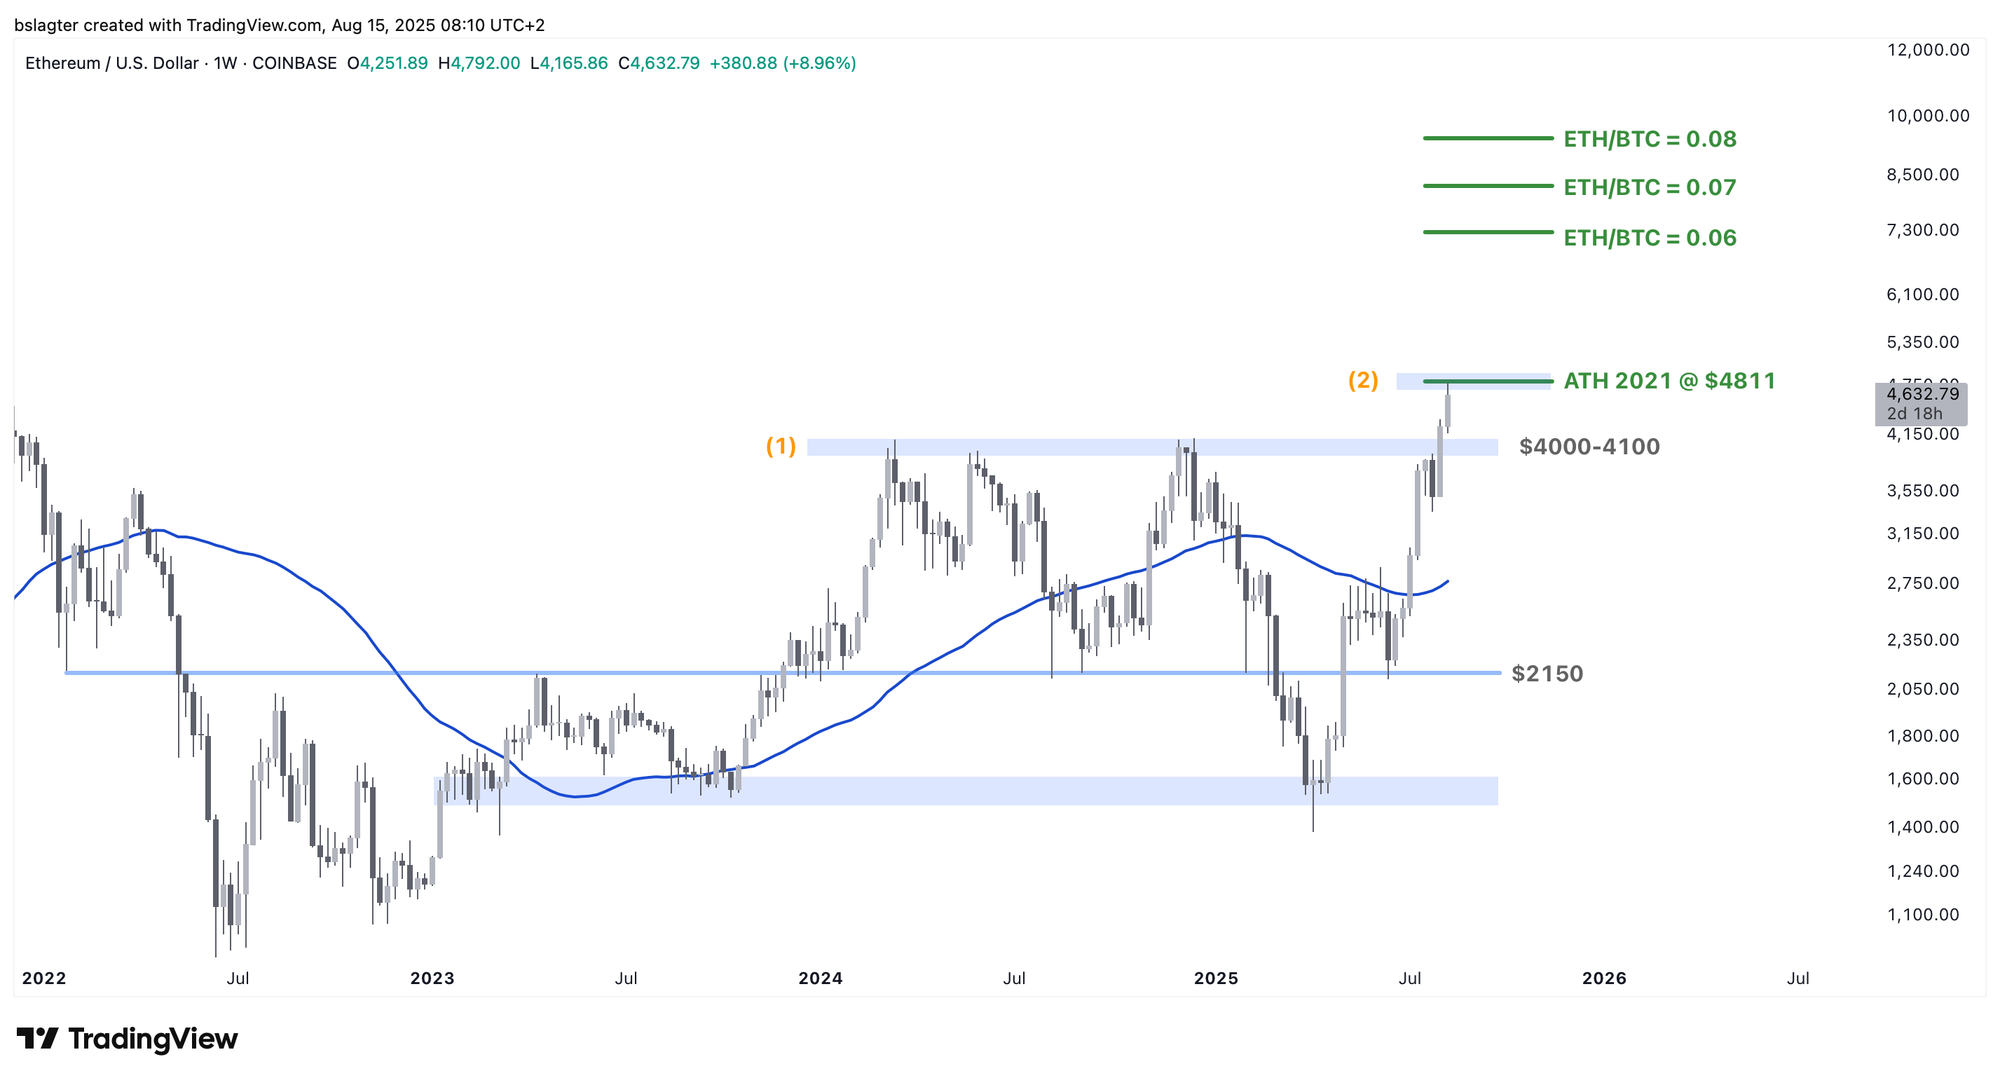
For ETH, two key thresholds have emerged:
- The zone between $4000 and $4100. Over the past year and a half, the price has reached this level three times before stalling. Last week’s weekly close was above it at $4250, and this week we pushed past $4700.
- The zone between $4800 and $5000. This level marks the all-time high from the 2021 bull market and, due to its round number, may serve as a psychological barrier. We approached this zone right before ETH made a significant downward move on Thursday afternoon.
There is a widespread expectation that ETH will find it challenging to hold above its four-year-old all-time high. Many hope that if ether stays below $4800, capital will flow either to smaller altcoins—or possibly give bitcoin room for another upward move.
We don’t have a definitive view on this; much will depend on market sentiment and risk appetite, which are currently so uncertain that nearly anything could happen in the short term.
If the market shifts back into a full risk-on mode and inflows to ether ETFs remain steady, it’s quite possible that ETH will break through the $5000 barrier and explore new highs.
We continue with the following topics for our Alpha Plus members:
- Billions of dollars flowing into ether ETFs
- The most disliked bull market in history
- Can anything still disrupt this market?
- Bitcoin in euros as a dividing line?
1️⃣ Billions of Dollars Flowing into Ether ETFs
Bert
“If bitcoin ETFs didn’t exist, ETHA would have been the fastest asset ever to hit $10 billion,” wrote Eric Balchunas, an ETF analyst at Bloomberg, recently on X. “That just goes to show how incredibly successful bitcoin ETFs have been,” he added.
The launch of ether ETFs in July 2024 disappointed many ether investors. Inflows lagged far behind those into bitcoin ETFs, and ether’s price didn’t seem to benefit much. However, that has changed over the past few weeks.
The chart below shows that since mid-July, ETH has been moving in step with BTC, with similar inflows and outflows. In the last five days, ETH even significantly outperformed BTC, with an average daily inflow of $670 million.
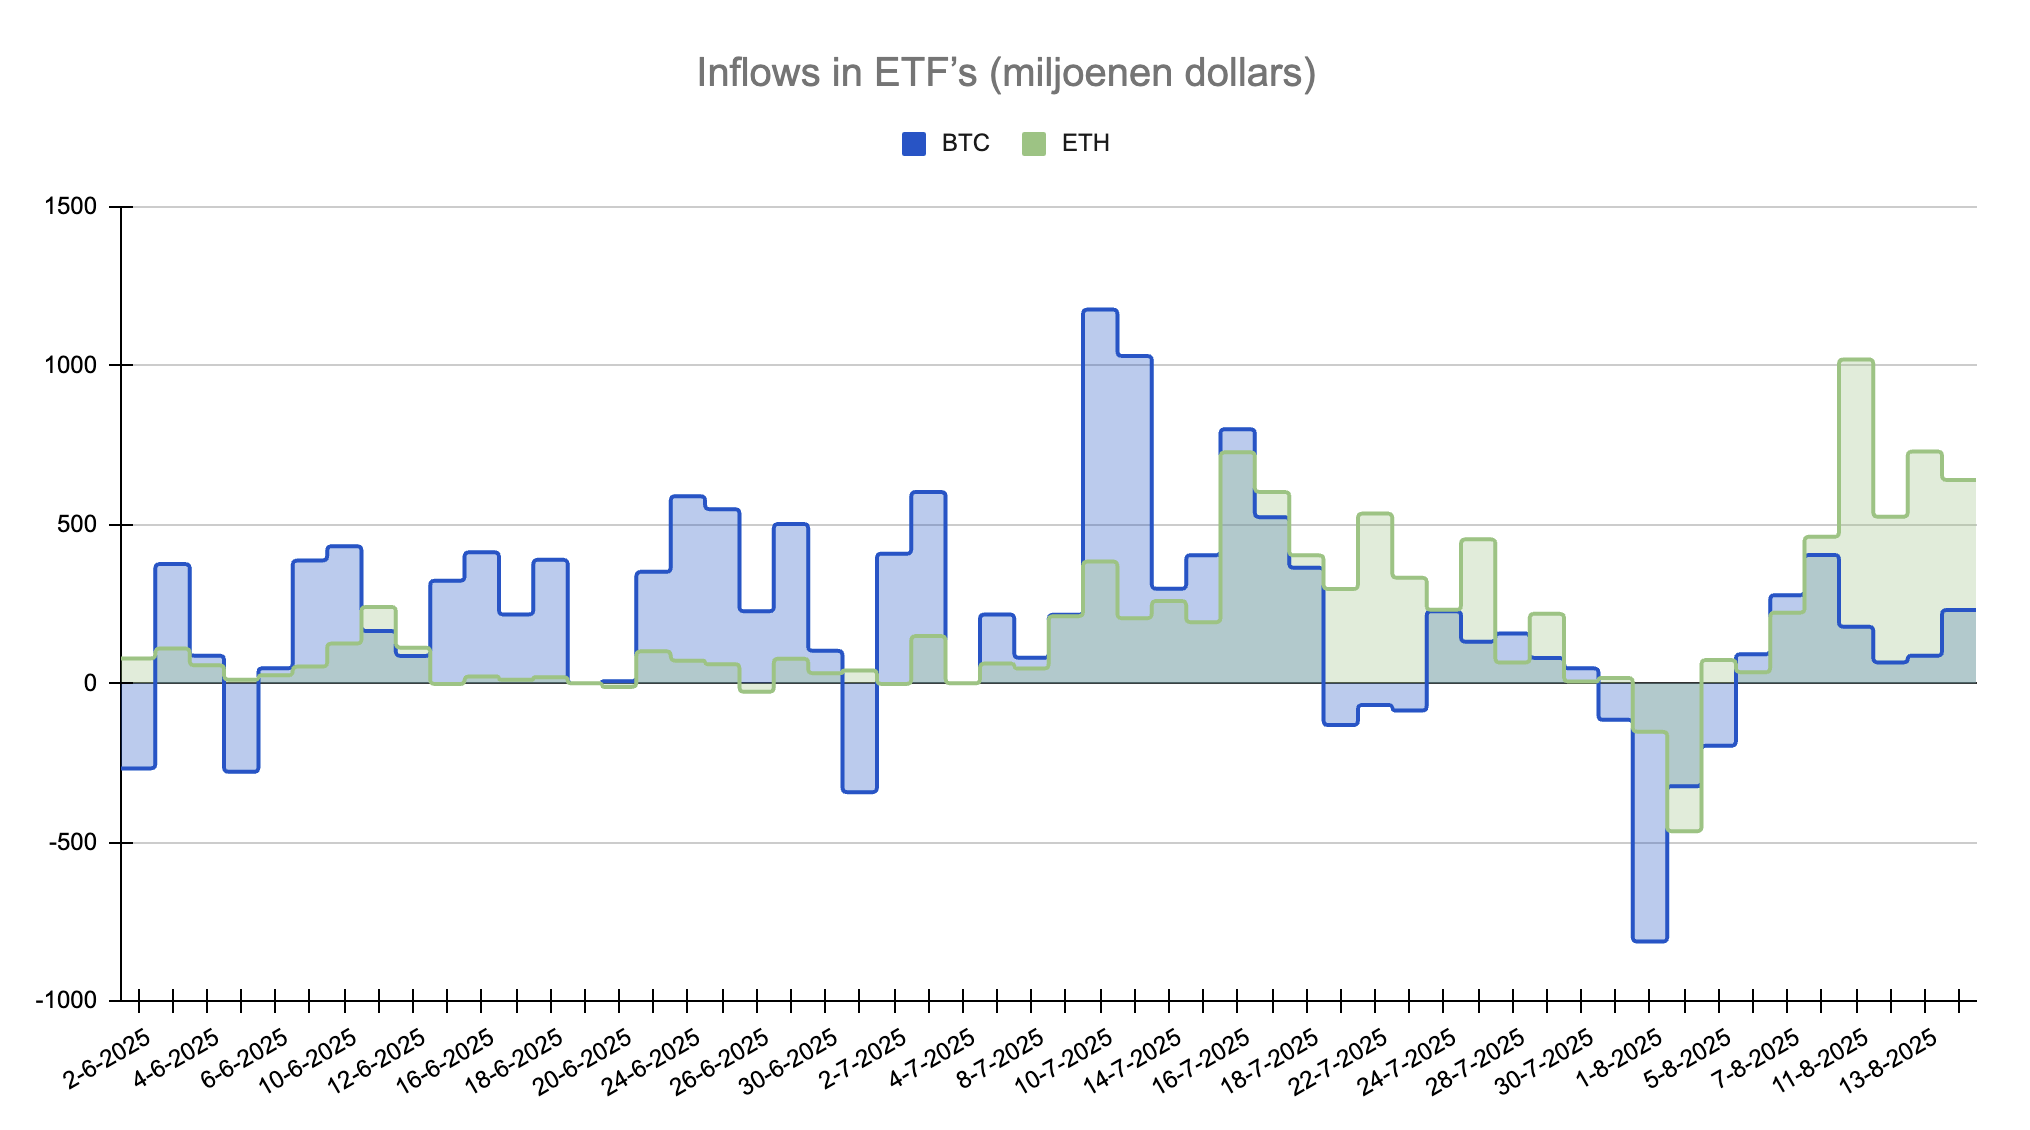
It’s even more impressive when you consider that bitcoin’s total market value is roughly four times that of ETH—$2.4 trillion compared to $560 billion.
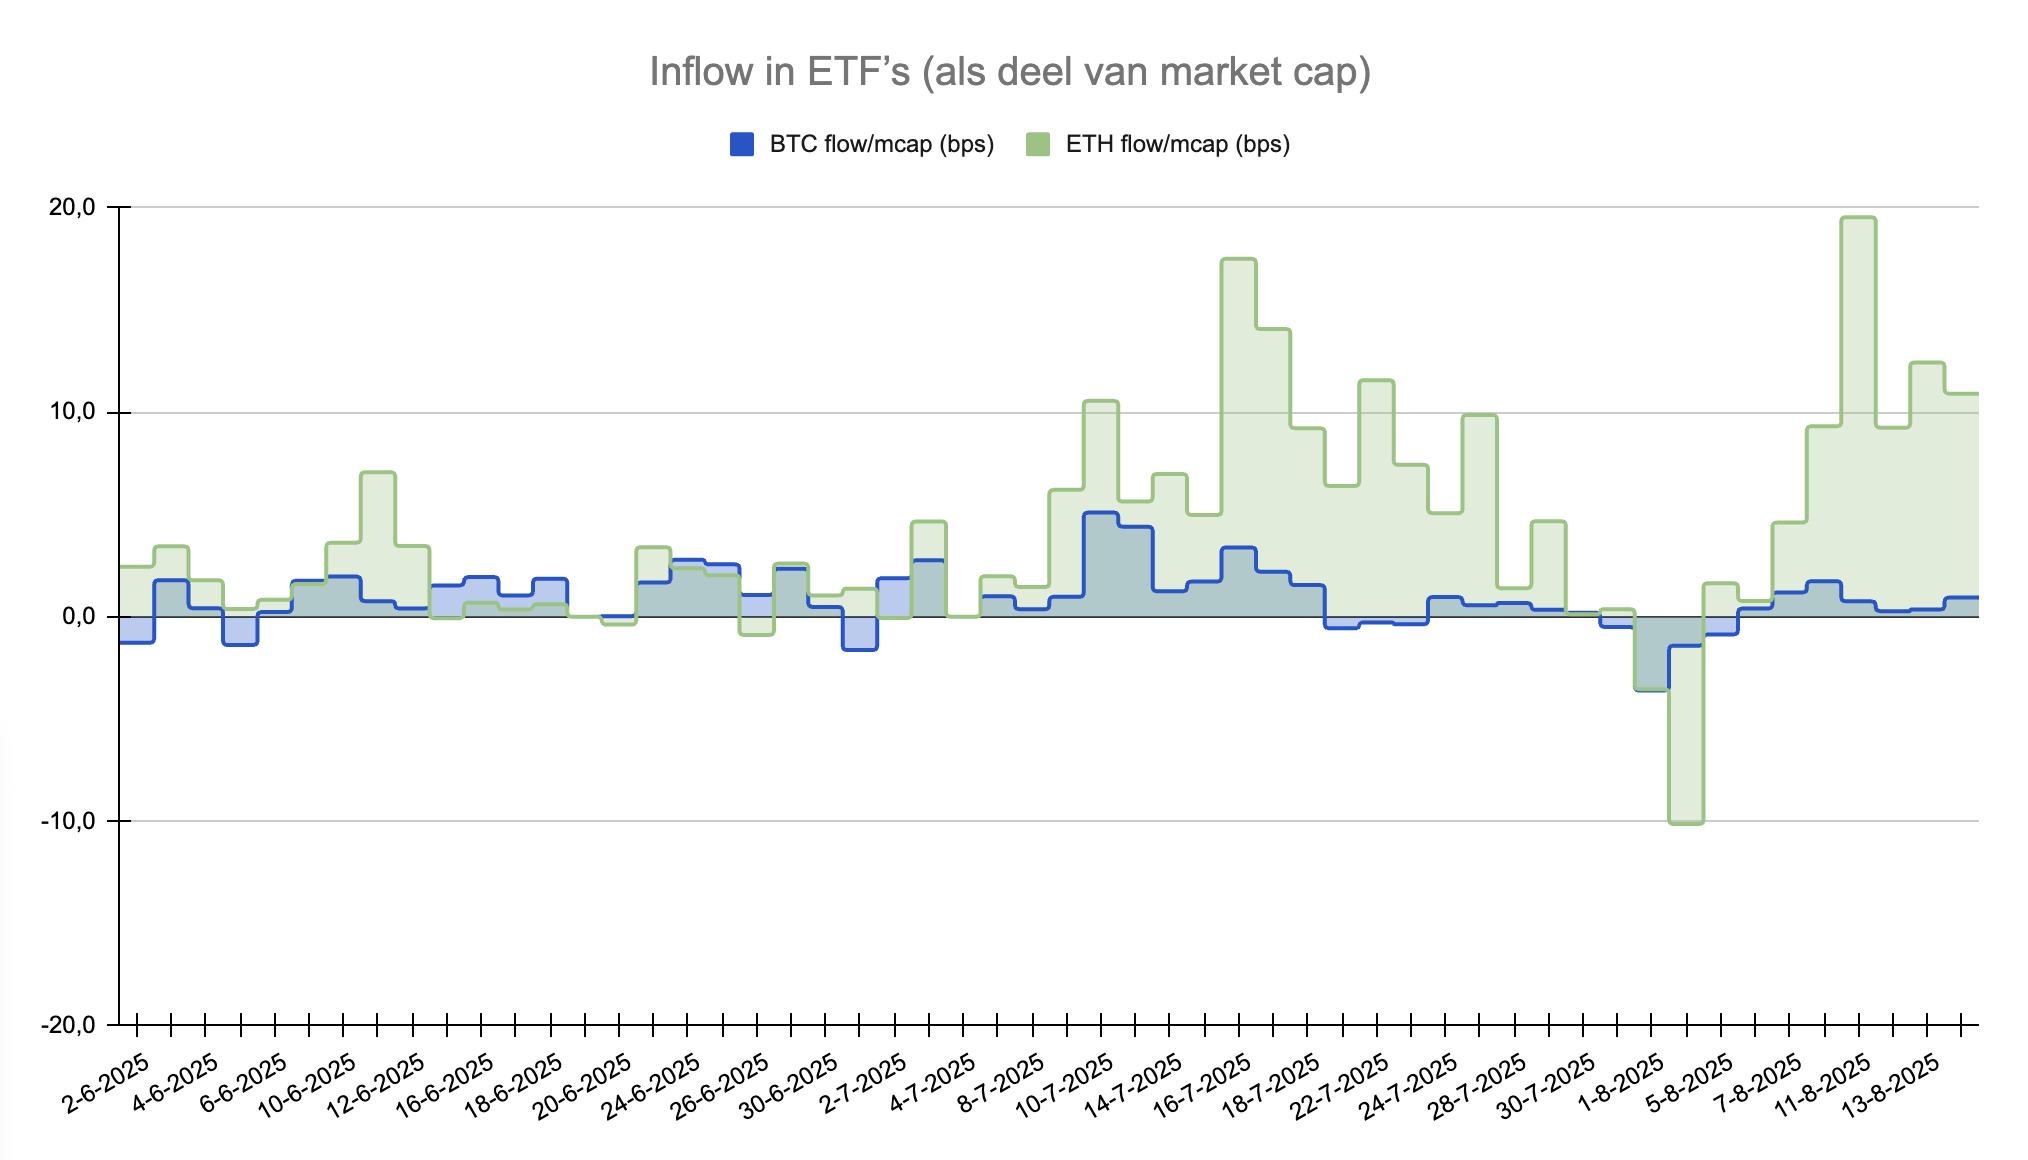
In the chart below, we recalculated ETF inflows as a percentage of total market cap. Last Monday, ETH nearly reached 20 basis points—meaning the inflow accounted for 0.2% of its market cap. In bitcoin’s early days, that figure barely exceeded 10 basis points.
And that’s just considering the ETFs. Additionally, ether treasury companies are withdrawing a significant amount of ETH from the market on a weekly basis.
Ether bull Anthony Sassano calculated yesterday that in 30 days, ether ETFs purchased 1.7 million ETH, while ether treasury companies acquired even more—1.8 million ETH. Combined, that represents about 3% of the total circulating supply.
The question now is whether this trend will continue. The strength of bitcoin ETFs is underscored by their steady inflows over the past year and a half, and MicroStrategy has been buying bitcoin for four years. A short sprint is impressive, but it’s the marathon that truly counts.
Over the last 30 days:
— sassal.eth/acc 🦇🔊 (@sassal0x) August 14, 2025
* Net new ETH issued: 74,000 ETH
* ETH bought by treasury companies: 1.8 million
* ETH bought by the ETFs: 1.7 million
47x more ETH was bought by these entities than was net issued by the network over the last 30 days.
The ETH supply crunch is real!
2️⃣ The Most Disliked Bull Market in History
Thom
All-time highs seem to be everywhere these days—whether it’s U.S. stocks, European stocks, Japanese stocks, Chinese stocks, bitcoin, or even gold. Most financial assets are trading near the upper end of their historical ranges.
Bull markets are typically accompanied by a positive global narrative. In the latter half of the 1980s, during Ronald Reagan’s presidency, the Cold War ended, and Paul Volcker, as chairman of the U.S. Federal Reserve, showed how to tame inflation.
With major problems seemingly behind us, people looked forward with confidence, and an impressive bull run followed. A similar trend was seen during the Dotcom bubble, when immense optimism about the internet and global peace reigned.
Today, while there is optimism around AI, the geopolitical climate is far more volatile. With concerns that Donald Trump could signal the end of democracy in the United States, and with unrest in Ukraine and Gaza, peace remains elusive. Additionally, China’s rising influence poses a significant challenge to U.S. global standing.
Rising inflation remains a threat, and signs of a cooling U.S. economy are emerging. So how do risk assets continue reaching all-time highs? In my view, the answer is multifaceted.
For one, a considerable segment of the media is critical of Trump, often portraying his economic policies in an overly negative light. For instance, in April 2025, many were convinced his tariff wars would trigger a global recession.
Also, passive investing has surged in popularity. More people are consistently investing a fixed amount each month without overthinking the risks, confident that everything will smooth out in the long run.
Technological optimism also plays a significant role—the belief that AI and other innovations will drive enormous growth in wealth.
Perhaps most importantly, investors are increasingly aware that the national debt of the United States and other Western nations poses an unsustainable problem. With ever-increasing borrowing just to service existing debt and inflation likely to rise steadily, there’s less need for fundamental justification during a prolonged bull market.
Trump’s initiatives, including his “One Big Beautiful Bill” and other measures, clearly aim to stimulate the economy by growing it faster than the national debt. In my opinion, there’s a good chance he won’t fully succeed, prompting many investors to seek refuge in scarce assets like bitcoin.
3️⃣ Can Anything Still Disrupt This Market?
Thom
On Friday, August 1, the market was unsettled by a disappointing U.S. jobs report. Job growth fell short of expectations, and the figures from the previous two months were significantly revised downward.
Coupled with rising inflation, there were brief concerns about stagflation, but the situation stabilized within a few days. Bitcoin recovered to above $120,000, and U.S. stock markets continued to record new all-time highs.
It seems nothing can disrupt this market; dips are snapped up almost immediately. This is a good sign, reflecting strong liquidity and ample capital available for risk investments.
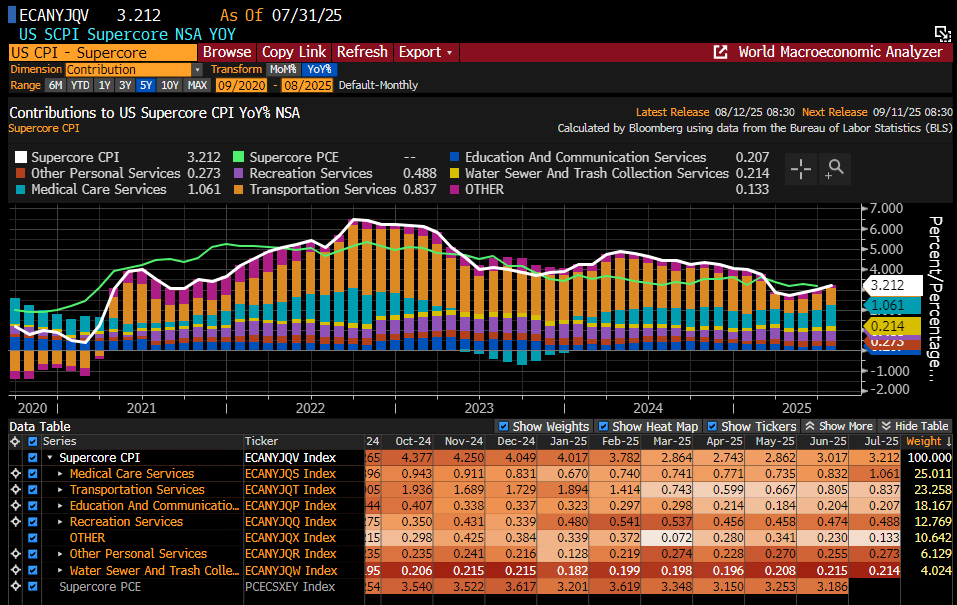
This week showed similar resilience. Although the overall Consumer Price Index (CPI) was slightly softer than expected, both the Core and Supercore CPI figures exceeded forecasts. While tariff adjustments have remained limited so far, they may accelerate, and the persistent inflation in the service sector is a growing concern for the Federal Reserve.
The Supercore CPI rose by 0.481 percentage points month-over-month, reaching an annual rate of 3.212%. These are not the numbers the Federal Reserve had hoped for.
Notably, the likelihood of a rate cut in September has increased in light of this inflation report. There is ample evidence of rising inflation. On Wednesday, the market factored in a 99.9% chance of a rate cut on September 17, with expectations of three rate cuts by the end of 2025.
However, with more key inflation reports on the horizon, I wouldn’t be surprised if that percentage decreases slightly. Even though the labor market and economic growth are cooling, I don’t see an economy urgently calling for rate cuts.
If inflation continues to climb above 3%, it might be wise to delay cutting rates. That said, from an investor’s perspective, it would be most favorable if the Federal Reserve started lowering rates sooner rather than later.
This inflation report, in my view, further underscores the market’s resilience. Every piece of news is interpreted in favor of risk assets, which isn’t surprising given that leaders like Donald Trump in the U.S. are doing everything possible to stimulate the economy and the markets.
That optimism seems to outweigh any reservations about economic fundamentals or rising inflation.
4️⃣ Bitcoin in Euros as a Dividing Line?
Bert
We usually discuss bitcoin’s price in dollars since most trading occurs in that currency, and many analysts, traders, and algorithms focus on the dollar value.
However, it’s also useful to look at bitcoin’s price in other currencies, which reflects different market scales, as we mentioned in the Markets on July 11.
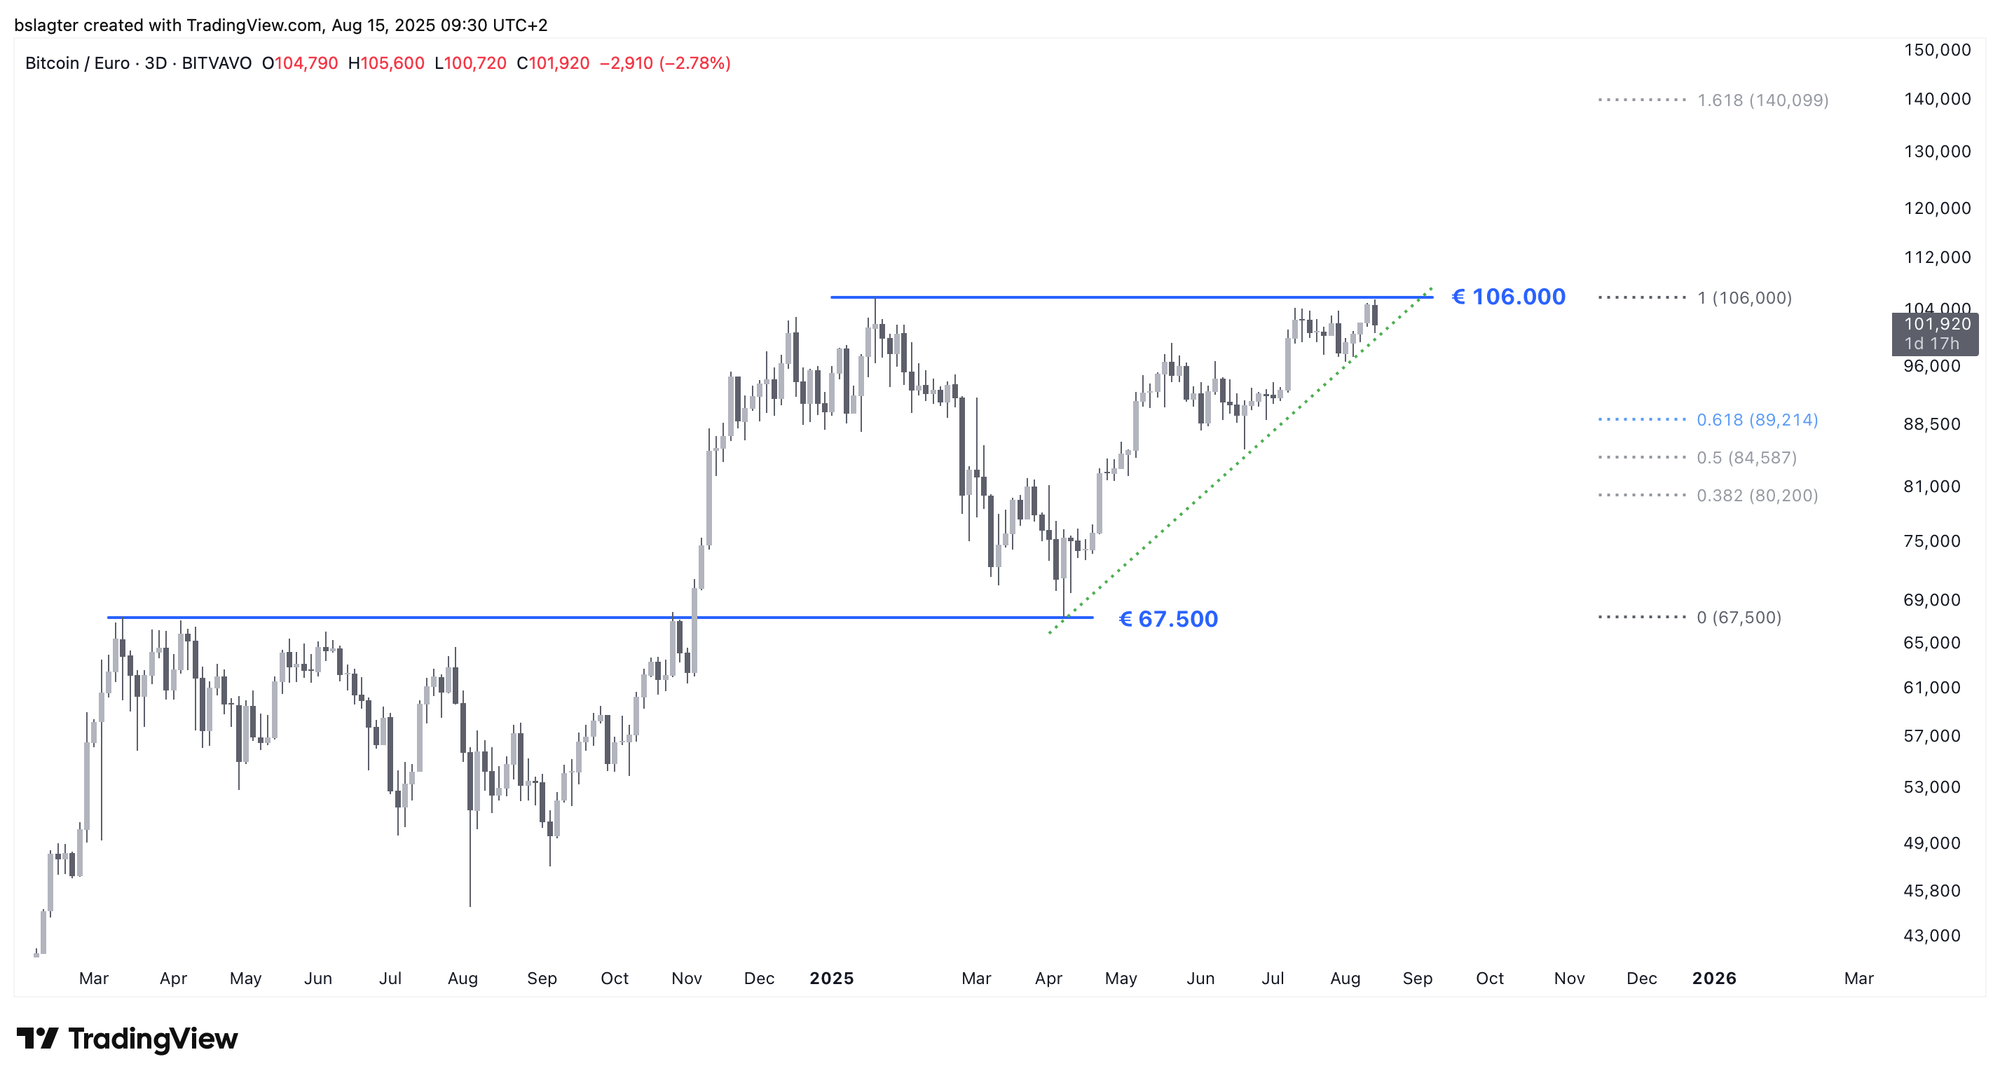
The chart below shows bitcoin’s price in euros, using data from Bitvavo—the largest BTC/EUR market. The all-time high still stands at €106,000 from January 20, and on Thursday the price reached €105,400, just shy of that level.
The $124,500 recorded last Thursday is equivalent to about $109,500 recorded on January 20 when adjusted for the dollar’s depreciation. Perhaps the €106,000 mark will serve as the critical dividing line, with a breakout above it signaling a new phase.
Thank you for reading!
To stay informed about the latest market developments and insights, you can follow our team members on X:
- Bart Mol (@Bart_Mol)
- Peter Slagter (@pesla)
- Bert Slagter (@bslagter)
- Mike Lelieveld (@mlelieveld)
We appreciate your continued support and look forward to bringing you more comprehensive analysis in our next edition.
Until then!