
Bitcoin, Gold, and AI Are Approaching an Attractive Price Zone
Bitcoin is in a bear market, but its character is changing. The end appears to be coming into view. We also break down the charts for gold and AI stocks.

A bear market is a regime in which prices fall and investors expect further declines. And a bull market is a regime in which prices rise and investors expect further gains. From these definitions, you can look at the transition from a bear market to a bull market in two ways:
Trend: the bottom is the point at which the actual trend reverses from falling to rising; from lower highs and lower lows to higher highs and higher lows.
Sentiment: the bottom is the point at which investors' expectations shift from further declines to further gains.
For the first time in this bear market, we've arrived at a period and a price range in which a bottom is plausible, where the actual trend and investor expectations go hand in hand. That's good news, but you can already tell from the wording that you might still need a bit of patience.
Over the past few weeks in the Markets, we've been keeping a checklist to gather evidence for the trend reversal on the weekly chart from falling to rising:
⏹️ A higher high (HH) above the $83,000 from May 6
⏹️ A higher low (HL) above the $57,700 from July 1
⏹️ A weekly close above the 50-week moving average at $86,500
⏹️ A change in direction of that moving average from falling to rising
At this point, we still can't tick a single box. There's no evidence yet of a new uptrend. So the base case remains that we're in a bear market, and therefore, in principle, still expect lower prices.
By the way, note that the level for the third checkmark, the weekly close above the 50-week moving average, dropped by $1,000 in one week. Interesting: the dividing line between bear and bull market is coming toward you.
The objective identification of a new trend always lags behind. You only know for certain that a new uptrend — a new bull market — has begun once it's already been underway for a while.
It's therefore entirely legitimate to sketch out the scenario that $57,700 on July 1 was the bottom of the bear market, that we're now in the very first stretch of a new bull market, and that we won't see the first real evidence of it for another few weeks.
In a moment, we'll present an argument from cycle analysis for an even (slightly) lower (and later) bottom. But first, let's look at the price levels through which the probability of this scenario climbs from very low (now) to high (all four checkmarks).
In the chart below, we see the following prices:
- The June 15 high at $67,200. If this daily cycle is falling, we don't expect the price to climb back above this level. This is also roughly where the realized price of short term holders (STH-RP) sits.
- The 200-day moving average at $73,300. Some analysts use this average as the dividing line between bull and bear markets.
- The VWAP from the top at $80,000. The average purchase price since the top often accompanies the downtrend.
- The May 6 high at $83,000. Above this, we'd have a first higher high (HH) on the weekly chart.
- The 50-week moving average at $86,500. We regard a weekly close above this as an important signal.
We view the first two prices as early indications. We'll be on the edge of our seats if the price gets above them, but it's not yet proof. That only comes with the transition through the zone between $80,000 and $86,500.
At least, those are today's prices tied to the transition zone. In the chart below, we've marked them with the vertical series of dots. Over the coming weeks, the moving averages will fall further. As a result, the zones will become more concentrated.
Later this summer, the early signal will sound after a break through 67k-70k. The actual transition from bear to bull will be the break through 78k-83k.
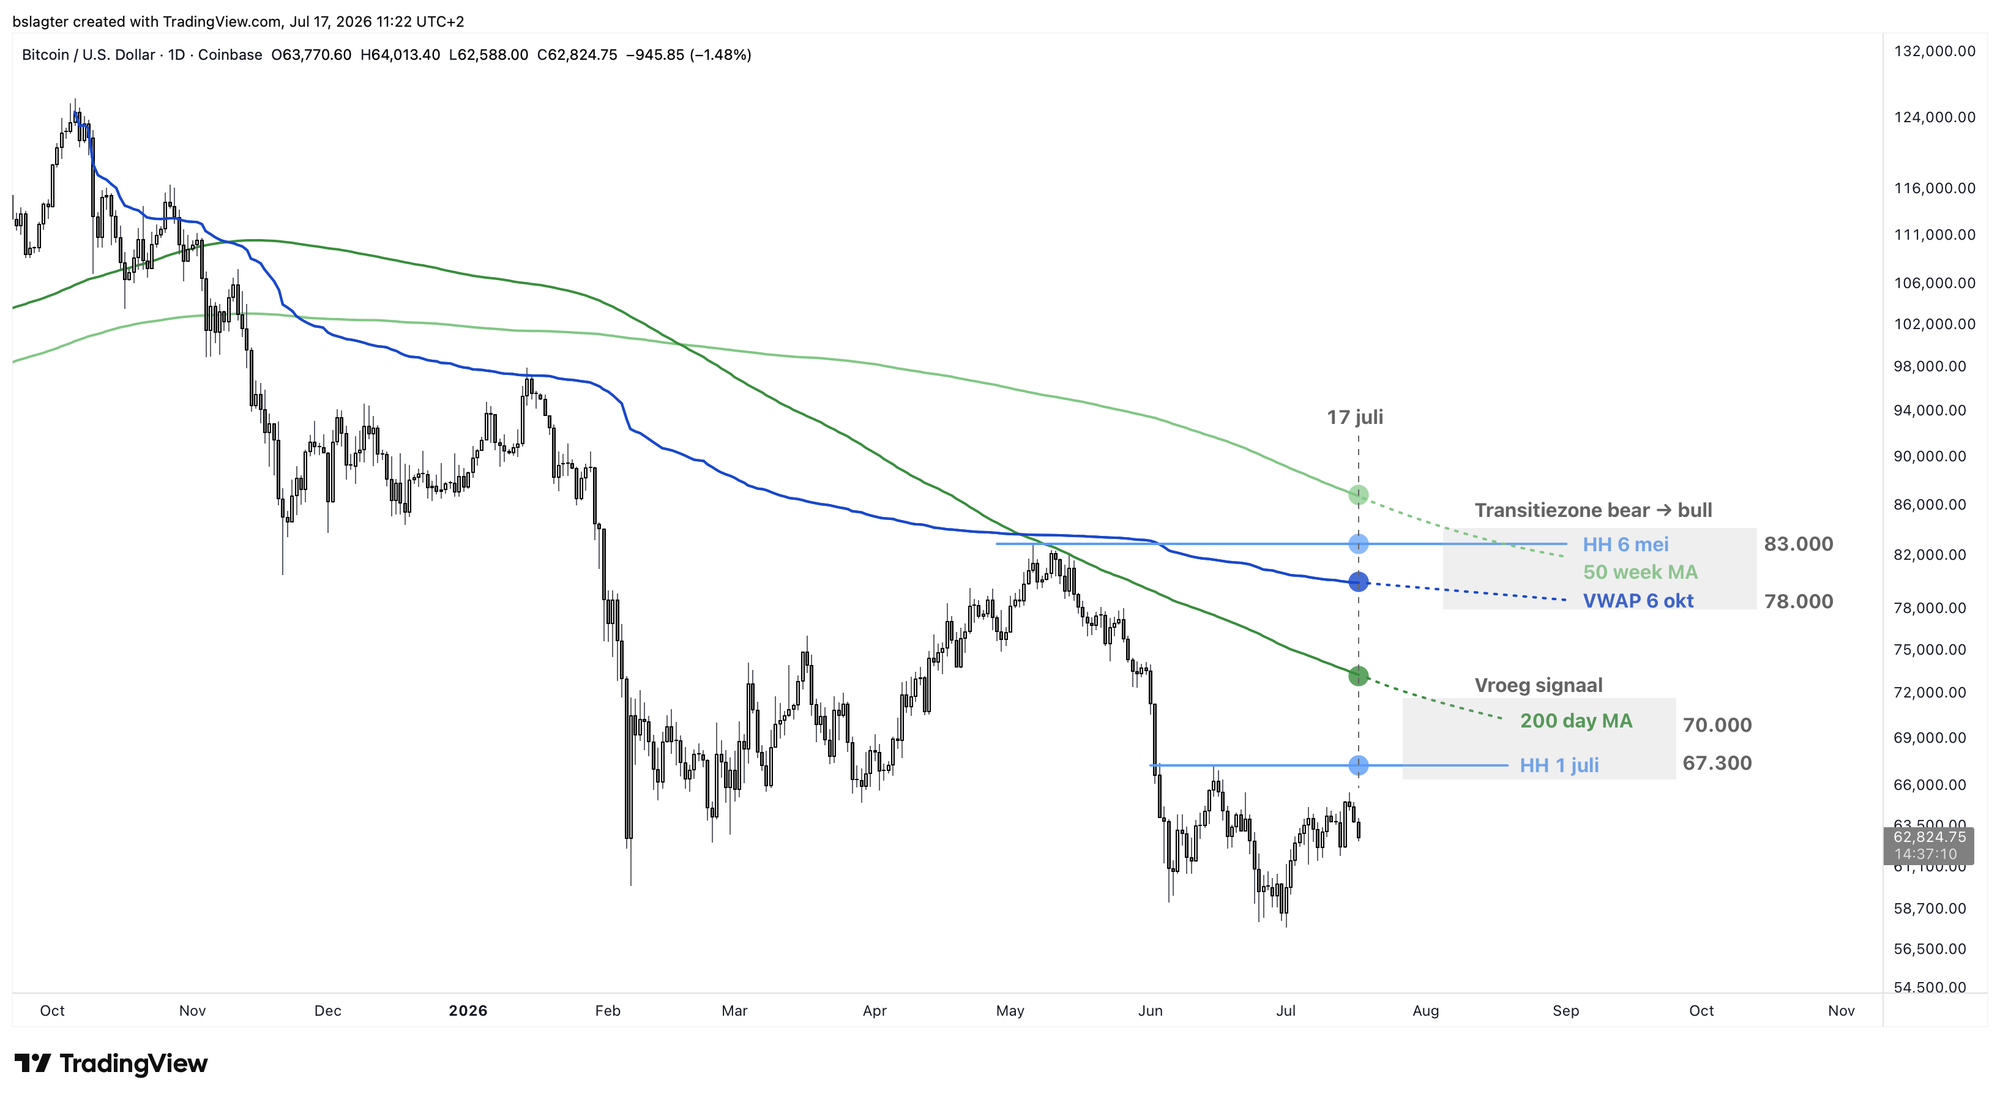
If we get above that, we'll change our base case from "we're in a bear market" to "we're in a new bull market."
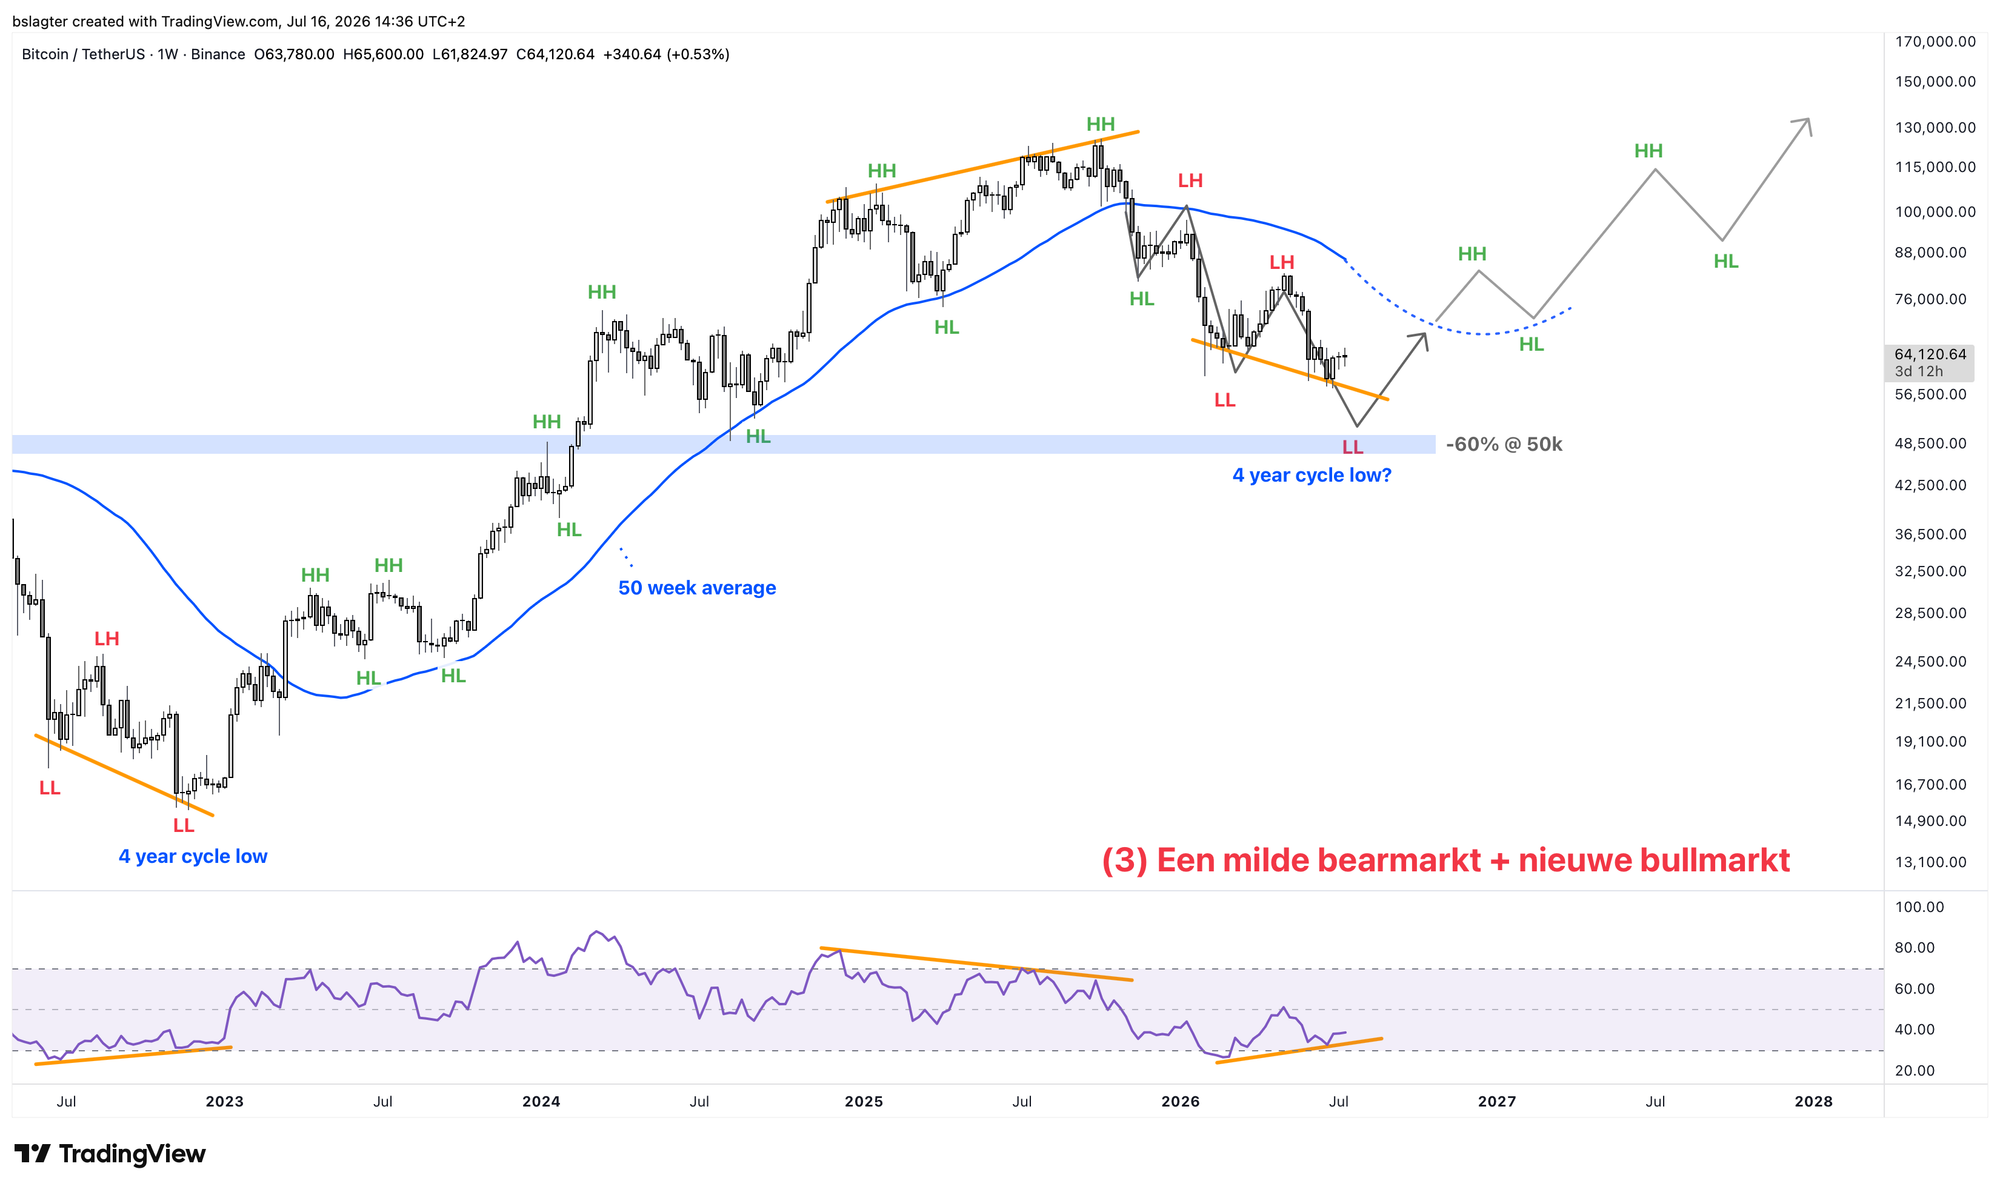
In the chart below, we've extended our current base case with an actual start of a new bull market following a bottom somewhere over the course of this summer.
We'd then climb back above $100,000 in the first half of 2027, and perhaps set a new all-time high above $126,000 in the second half of 2027.
As far as we're concerned, it's still too early to philosophize about the top of that bull market. We'll only do that once we have more evidence that the bottom is genuinely behind us. We can then run the numbers with the data available at that point, such as price levels, on-chain data, crypto fund data, and macroeconomic expectations.
Let's take another look at the daily and weekly cycle. That's where there's an argument to expect even lower prices in this bear market. We'll start with the daily cycle.
We're on day 42 of the current daily cycle. On average, it lasts 60 days, but since the previous one ran a bit longer, it wouldn't be strange for this one to run a little shorter. We expect the daily cycle low (DCL), the end of this daily cycle, in late July or early August.
This cycle has already 'failed,' meaning the price has already dipped below the starting price. It therefore stands to reason that the end of this daily cycle will be lower than the lowest point so far, so below $57,700.
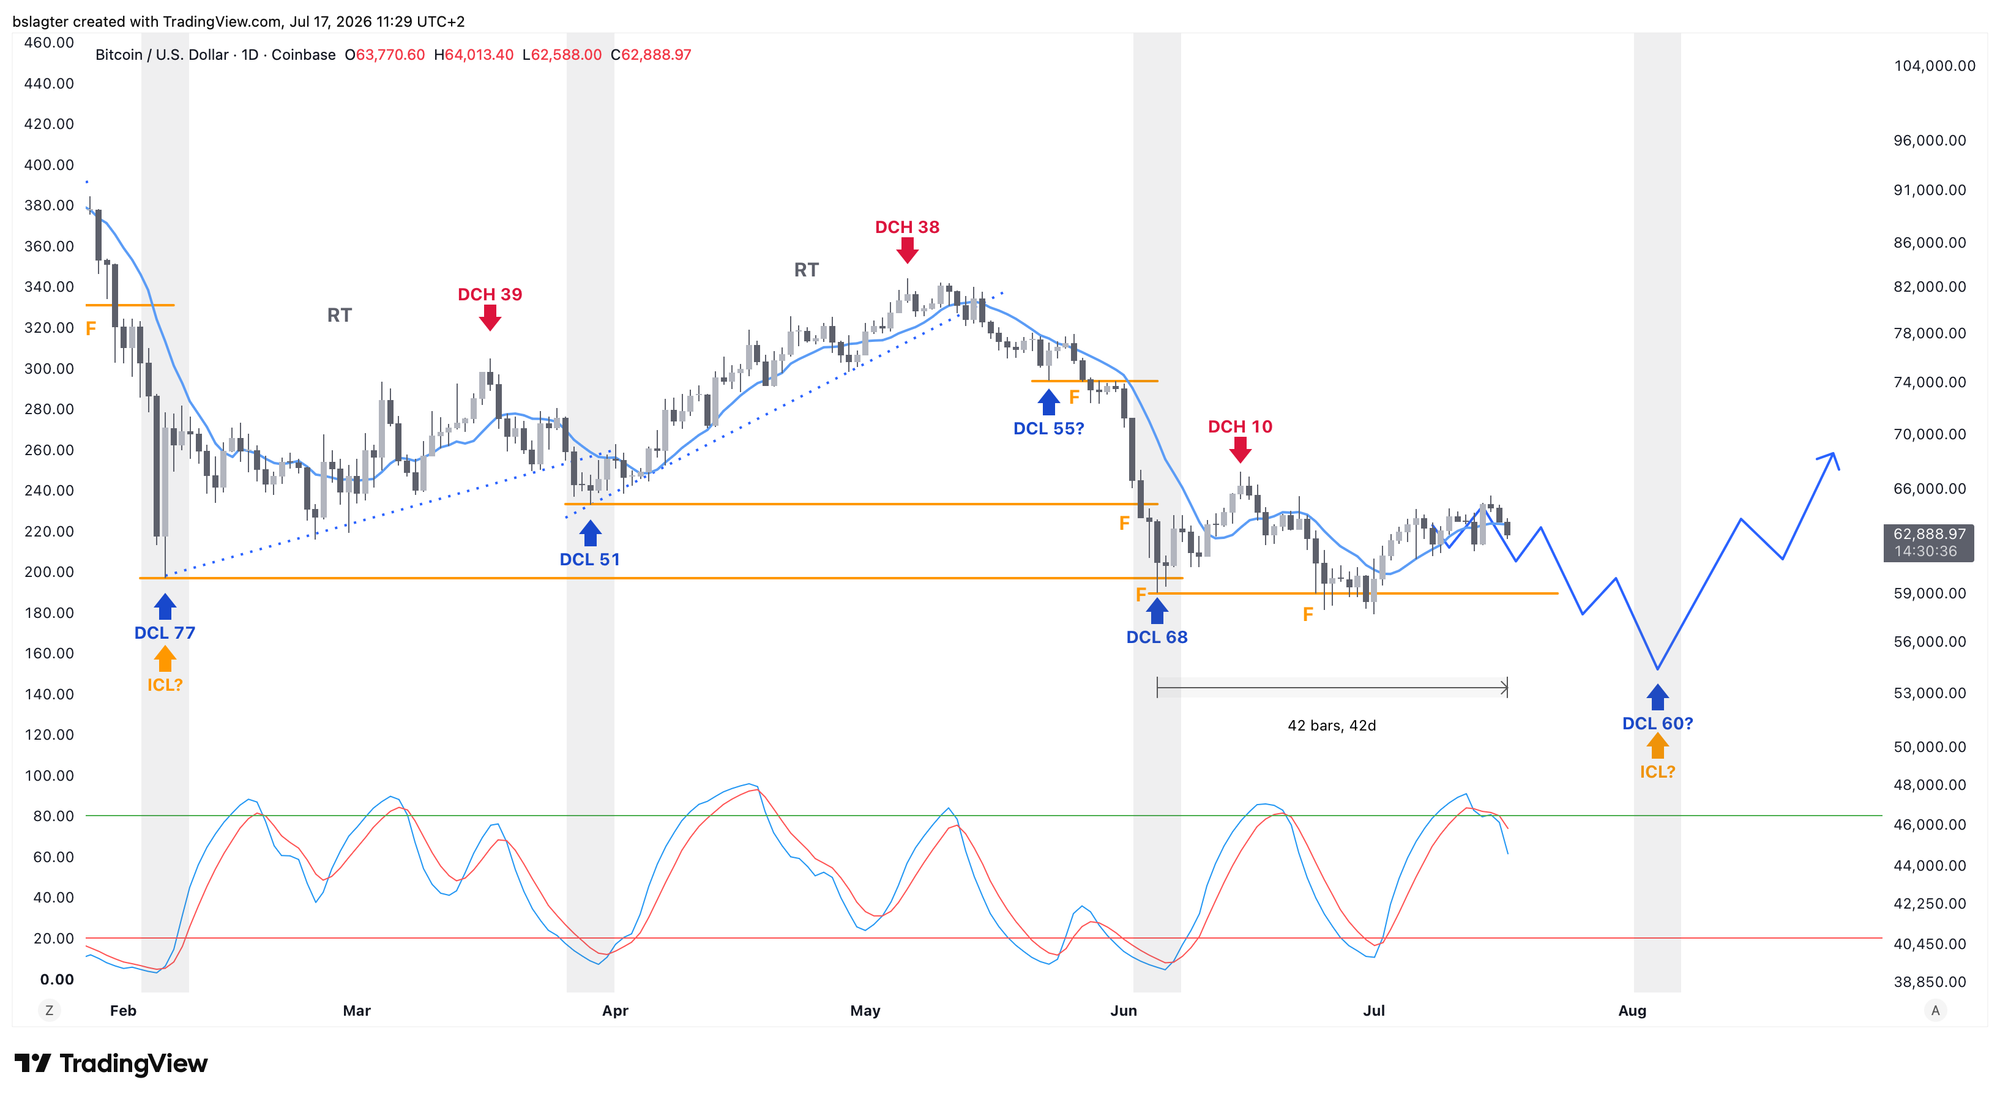
If that happens, then it's plausible that the coming DCL is also immediately the weekly cycle low (ICL) and the yearly cycle low (YCL). The bottom of the bear market, in other words.
An alternative is that another daily cycle follows after this, pushing the ICL and YCL out another 60 days to somewhere in late September or early October. That would once again line up precisely with the myth of the exact 4-year cycle. There are bound to be investors counting on that and trading accordingly.
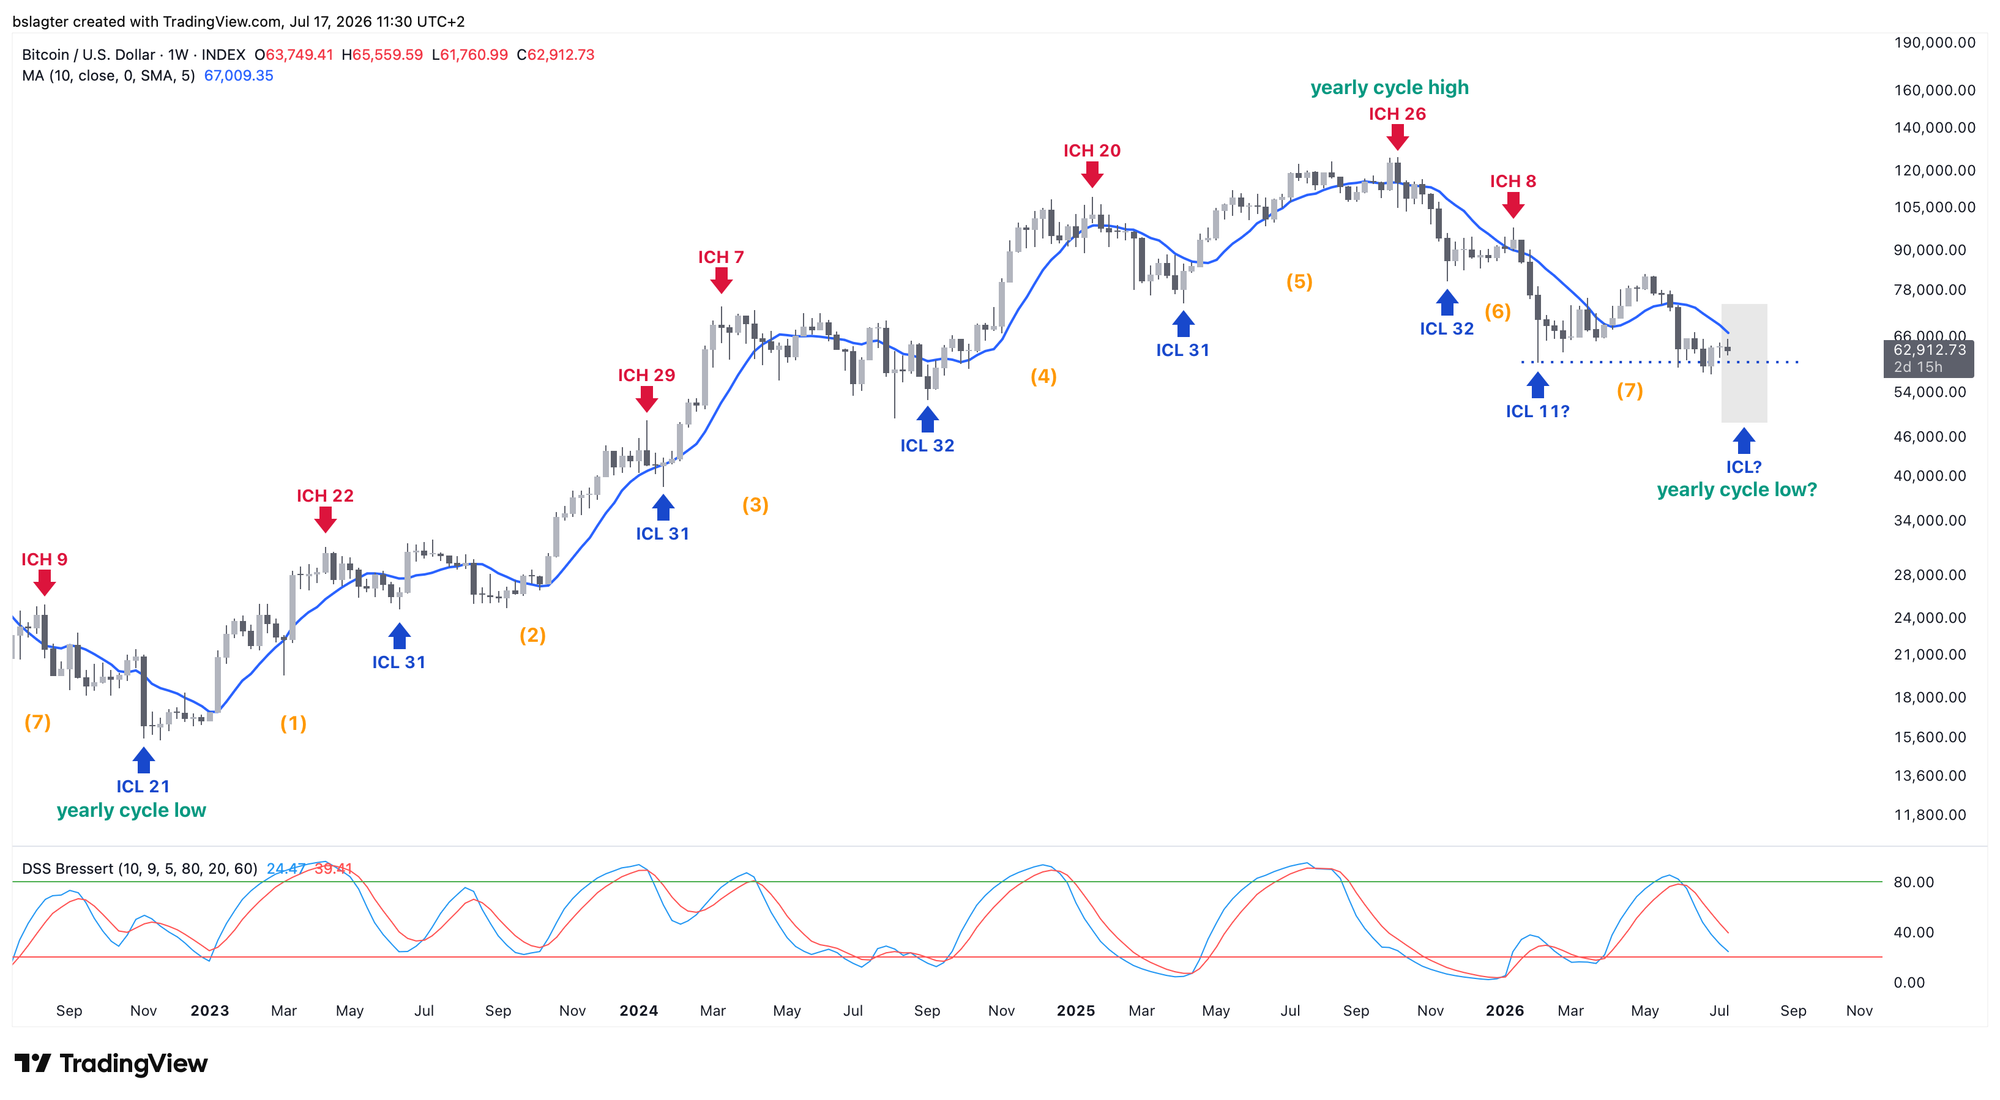
From here on, we're keeping an eye on a number of variants of our base case:
- The bottom was July 1 at $57,700.
- The bottom of the bear market is the coming DCL, in late July or early August.
- The bottom of the bear market is the DCL after that, in late September or early October.
- The bottom of the bear market comes much later.
We give variants 1 and 4 a small chance. Variants 2 and 3 make up the belly of the probability distribution.
Whatever it turns out to be: the break through the price levels from the second chart will tell us that the trend has turned.
We're seeing more and more very early signs that we've arrived at the conditions in which it's realistic to expect a trend reversal. A change of character, as we've called it a few times already.
Let's line up the observations once more:
- We saw strength in bitcoin at the moments when AI stocks showed weakness.
- We saw strength in bitcoin on the day Strategy announced it had sold a serious amount of bitcoin for the first time — 3,500 coins, a good $200 million worth.
- We saw the zone around 60k being defended. The bottom kept dropping slightly lower — 60k, 59k, 58k, 57.7k — but we didn't go into free fall to the next step down.
- Positive divergence is developing between the price and various indicators on the weekly chart.
- In the data, we see that it's mainly long-term investors buying bitcoin here and increasing their positions. That suggests they see these prices as 'value,' as a reasonable valuation.
- We're seeing remarkably little interest in doomsday scenarios and fear stories on the days the price falls. Earlier in this bear market, every bout of weakness immediately drew attention to quantum computing, issues at Binance, problems at Strategy, and chaos over BIP-110.
None of this carries evidentiary weight on its own. Taken together, though, it paints a picture that conditions now are different from, say, 3 or 6 months ago.
With that in mind, we're heading into an interesting summer. Because it's not just bitcoin that's becoming more attractive to buy — gold and silver, and AI stocks are also heading toward zones where it's worth building a position.
We continue with the following topics for our Alpha Plus members:
- Bitcoin, gold, and AI are approaching an attractive price zone
- What happened to the memecoin supercycle?
- A normal bull market correction for AI stocks, for now
- Bitcoin relatively strong in a tough period for growth stocks
1️⃣ Bitcoin, gold, and AI are approaching an attractive price zone
 Contribution by
 Bert
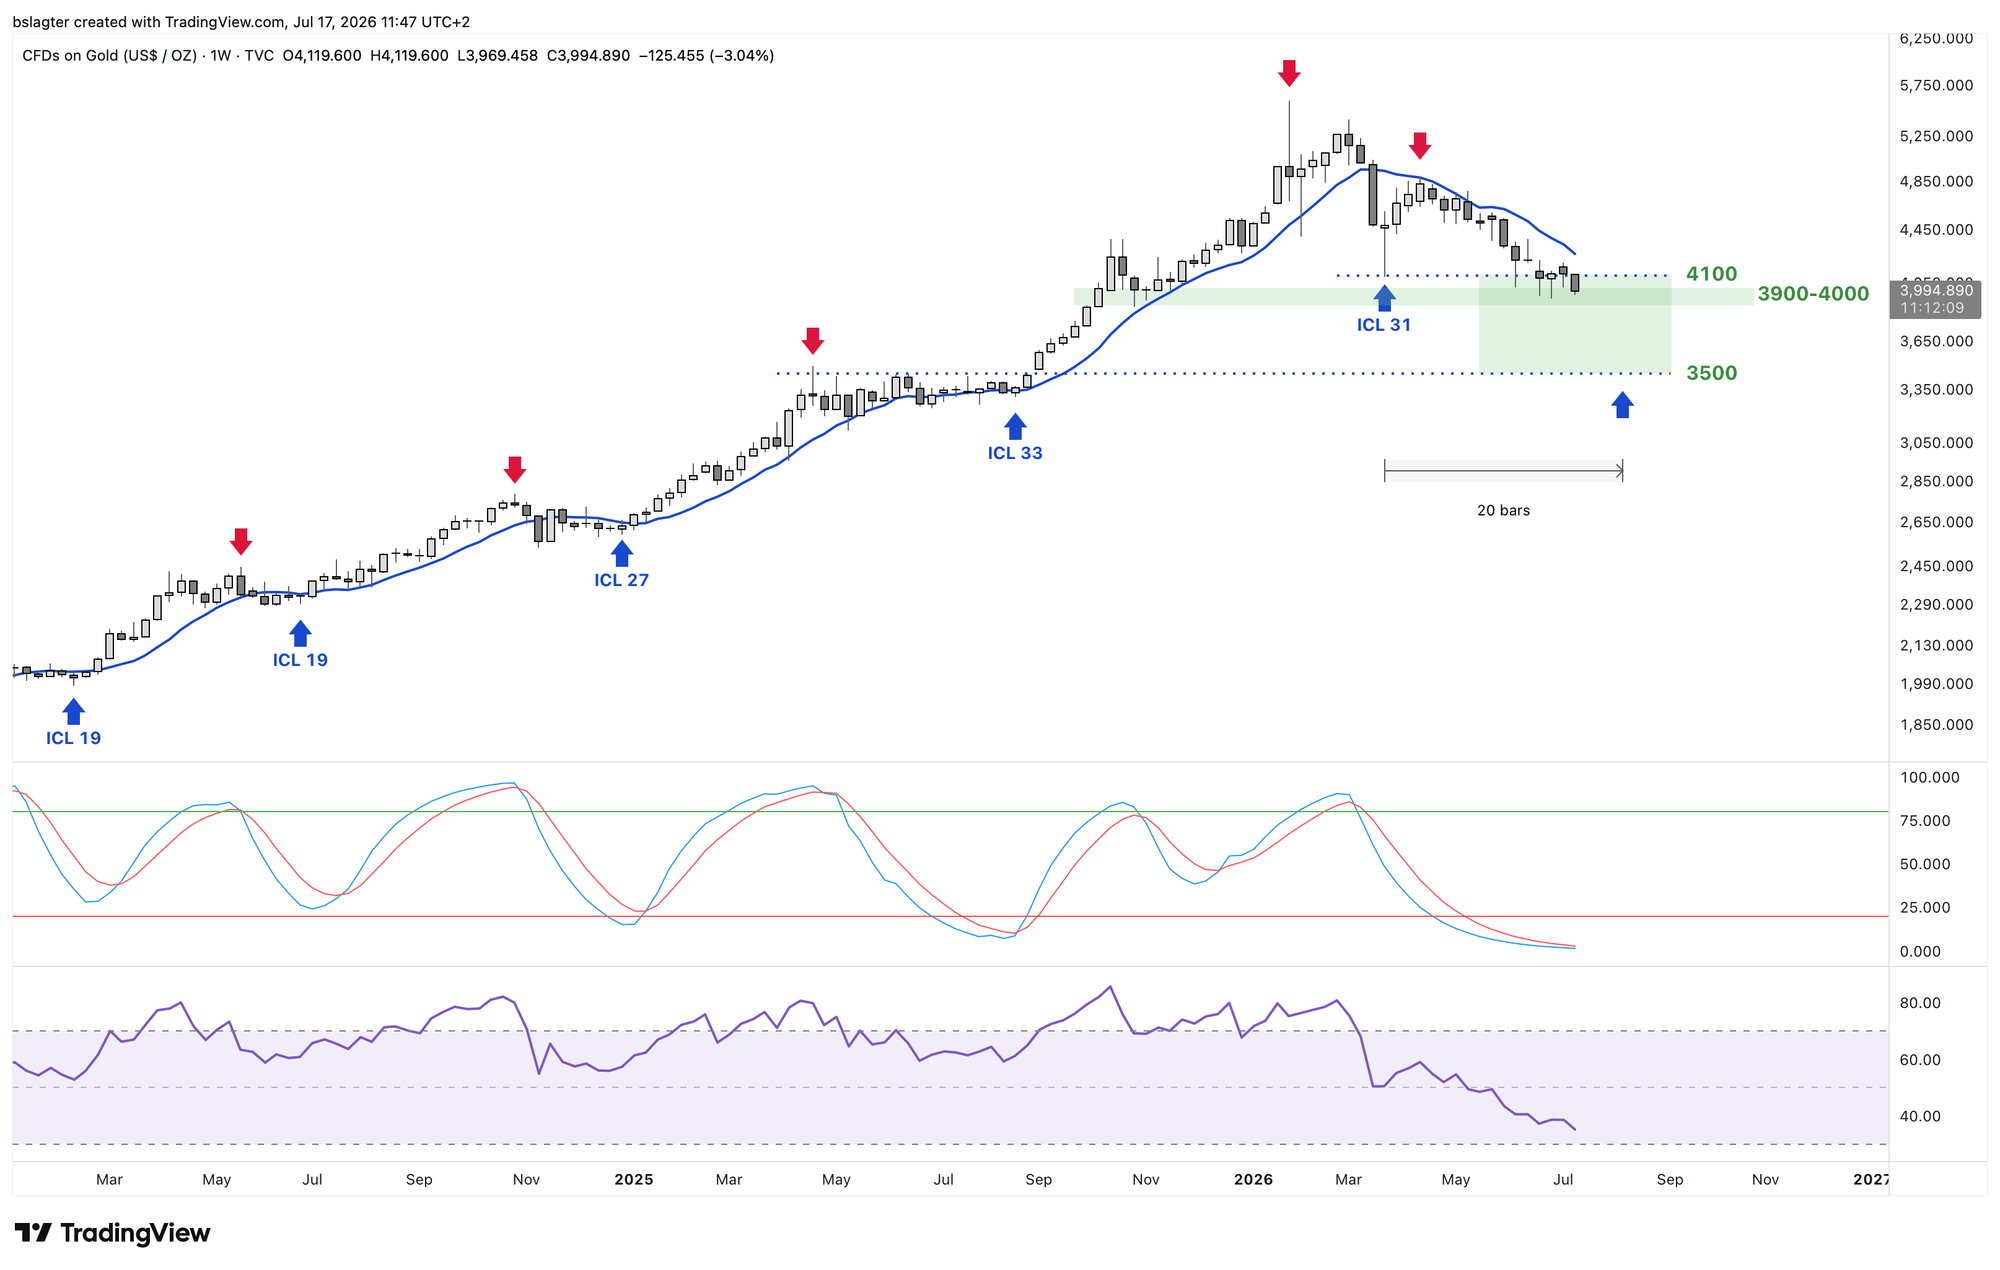
Precious metals saw a phenomenal bull run between August 2025 and January 2026. Gold rose 70% in six months, from $3,300 to nearly $5,600. The silver price tripled over the same period.
If your expectation is that this wasn't a one-off bubble, but that precious metals are in a multi-year bull market, then it's time to pay attention. In that case, it stands to reason that the coming weekly cycle low (ICL) is the end point of a mid-cycle pause, after which the second leg of the bull market begins.
I'm personally interested in the zone between $3,500 and $4,100 to build a position. An ICL in weeks 20 to 24 would put the bottom in August-September. Between 2008 and 2011, gold rose 180% after the mid-cycle pause. From $3,500, that would mean a rise to just under $10,000.
The silver chart is more turbulent. The price has already dropped more than 50%, from $120 to $55. It wouldn't surprise me if we can buy silver between $35 and $40 later this summer. One possible approach is to buy silver based on the gold chart, and thus already start dipping in cautiously at $54-55.
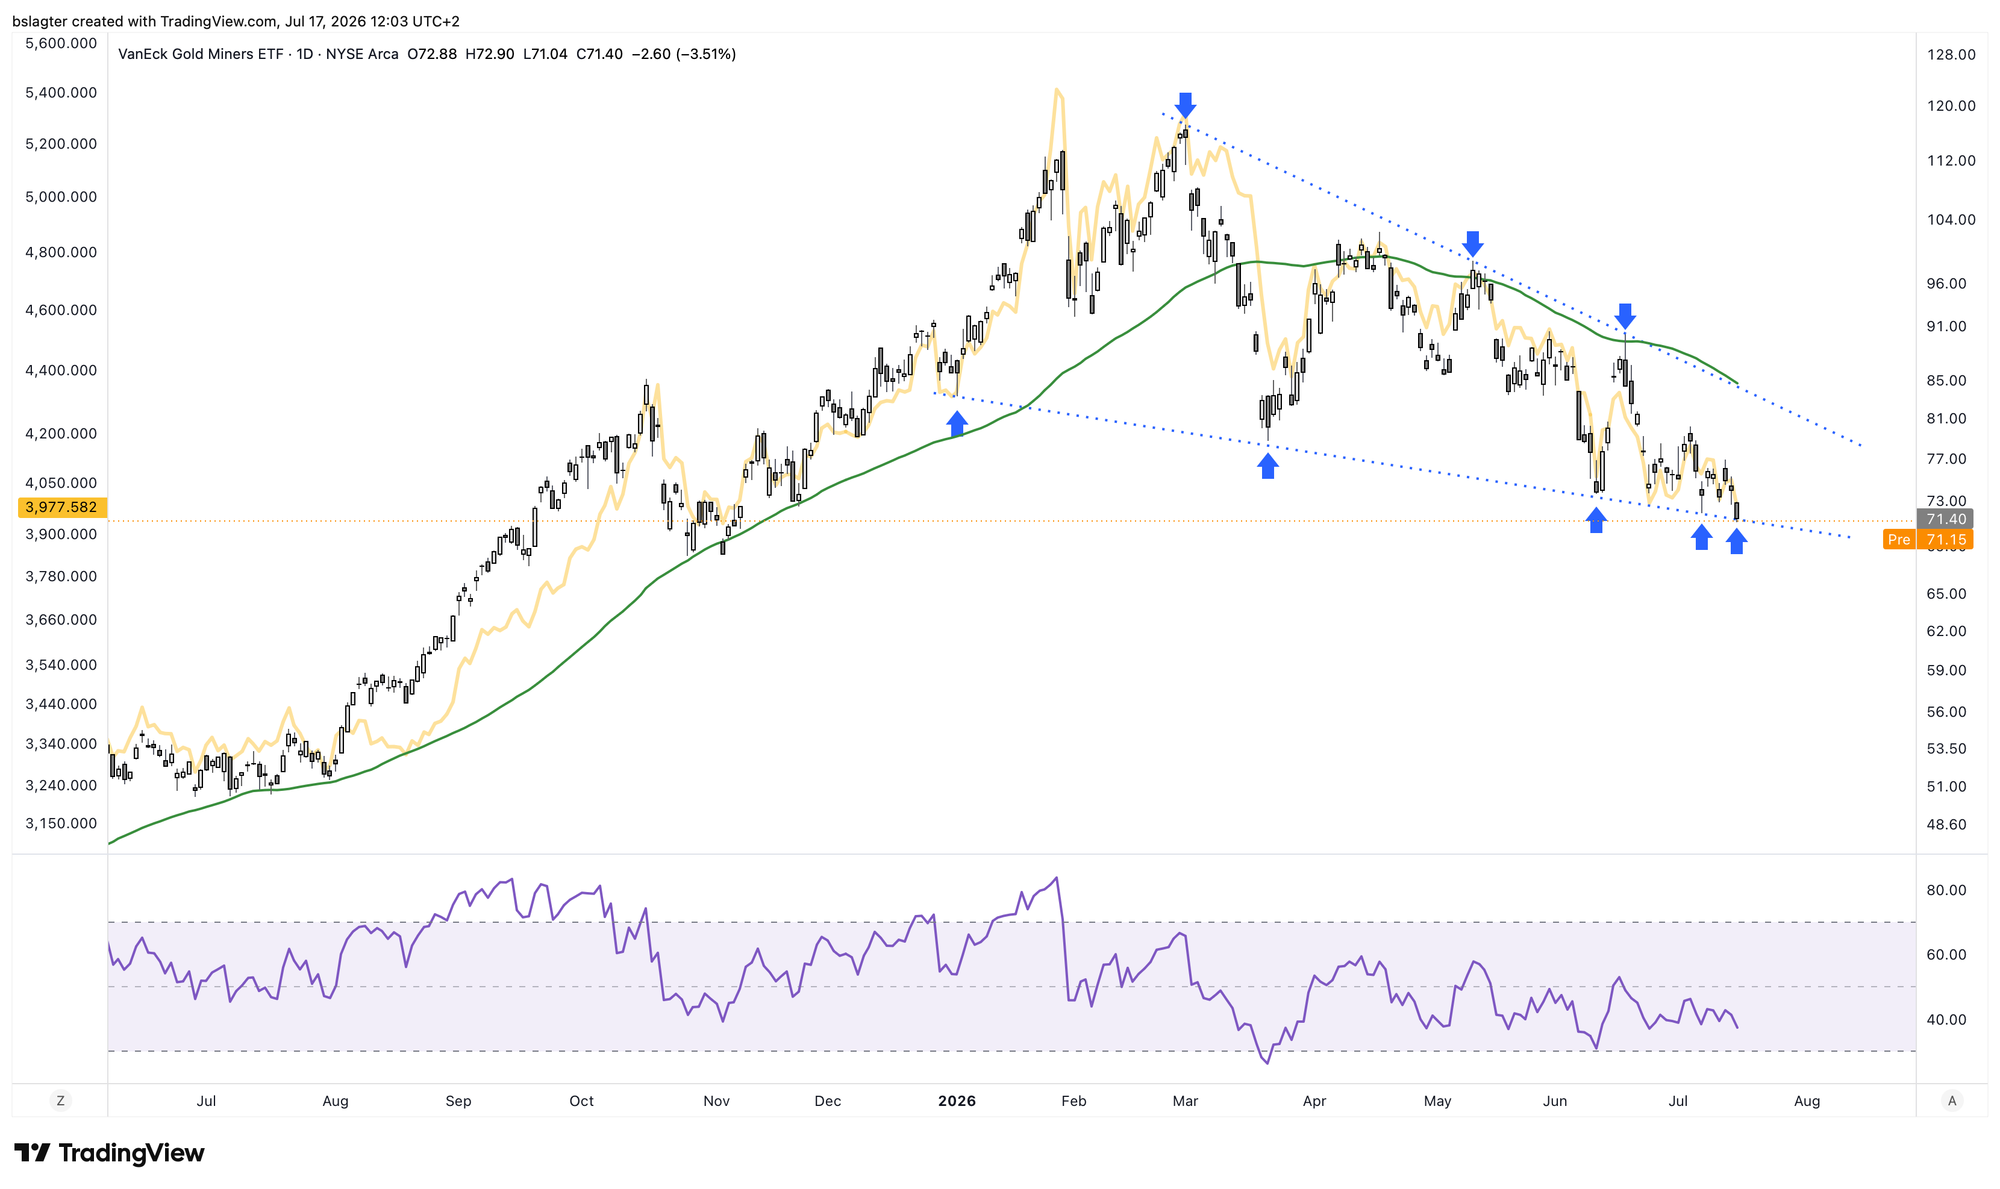
The chart below shows VanEck's Gold Miners ETF (GDX). The yellow line running through it is the price of gold. Since the top, GDX has been following a falling wedge pattern. In the majority of cases, according to Bulkowski, it breaks out to the upside.
The combination with gold's approaching ICL is interesting: if GDX were to follow, it would break out of the pattern to the downside.
In commodity markets, the price sometimes likes to make a "move around the apex" — first breaking down out of the pattern, and then moving sharply higher straight through the tip of the triangle. Caution is therefore warranted, in both directions — for example, by waiting for confirmation of a breakout.
The AI bull market has reached an interesting point. The phenomenal rise in the second half of 2025 and the first half of 2026 was driven by the hundreds of billions the hyperscalers are investing in AI infrastructure.
My base case is that these investments will remain high over the coming years, and that AI infrastructure companies will keep posting solid results in the years ahead. But the easy part of this ride is behind us.
That, by the way, is favorable for bitcoin and precious metals. Momentum traders will go looking for new opportunities, and investors taking profits will reinvest them in other parts of their portfolios.
Back to AI stocks. In episode 4 of Turing Station, I discuss my interpretation of the situation at length — see the video below:
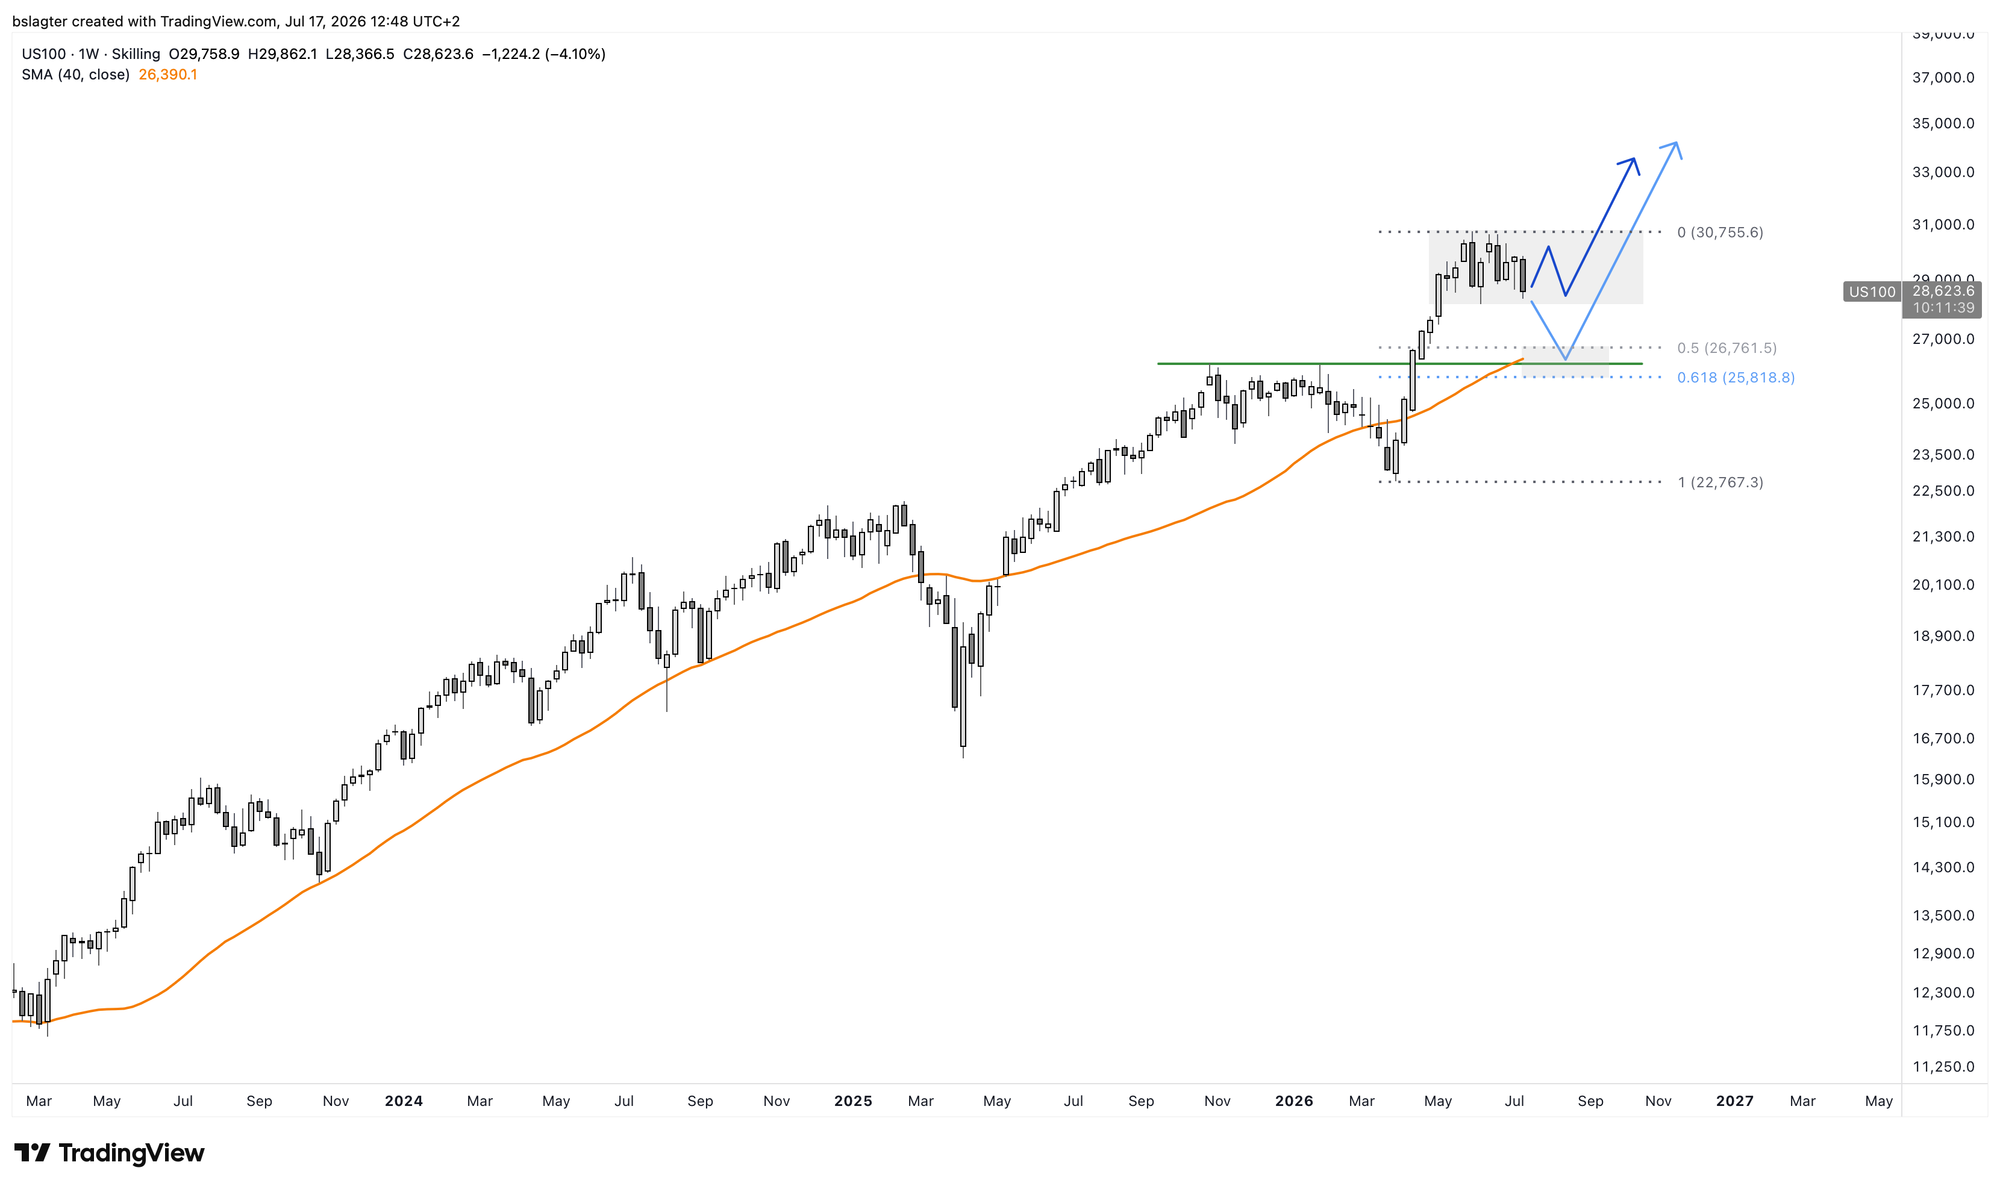
In the chart of the tech index Nasdaq 100, we clearly see a period of consolidation. The index price is moving sideways, and within the index we see rotation. My base case is that we'll begin a new period of rising prices later this year.
The question is whether it stays at consolidation (dark blue) or whether we get a deeper correction (light blue). The Nasdaq regularly seeks out the 40-week moving average, the orange line. That would argue for a somewhat longer period of consolidation or correction.
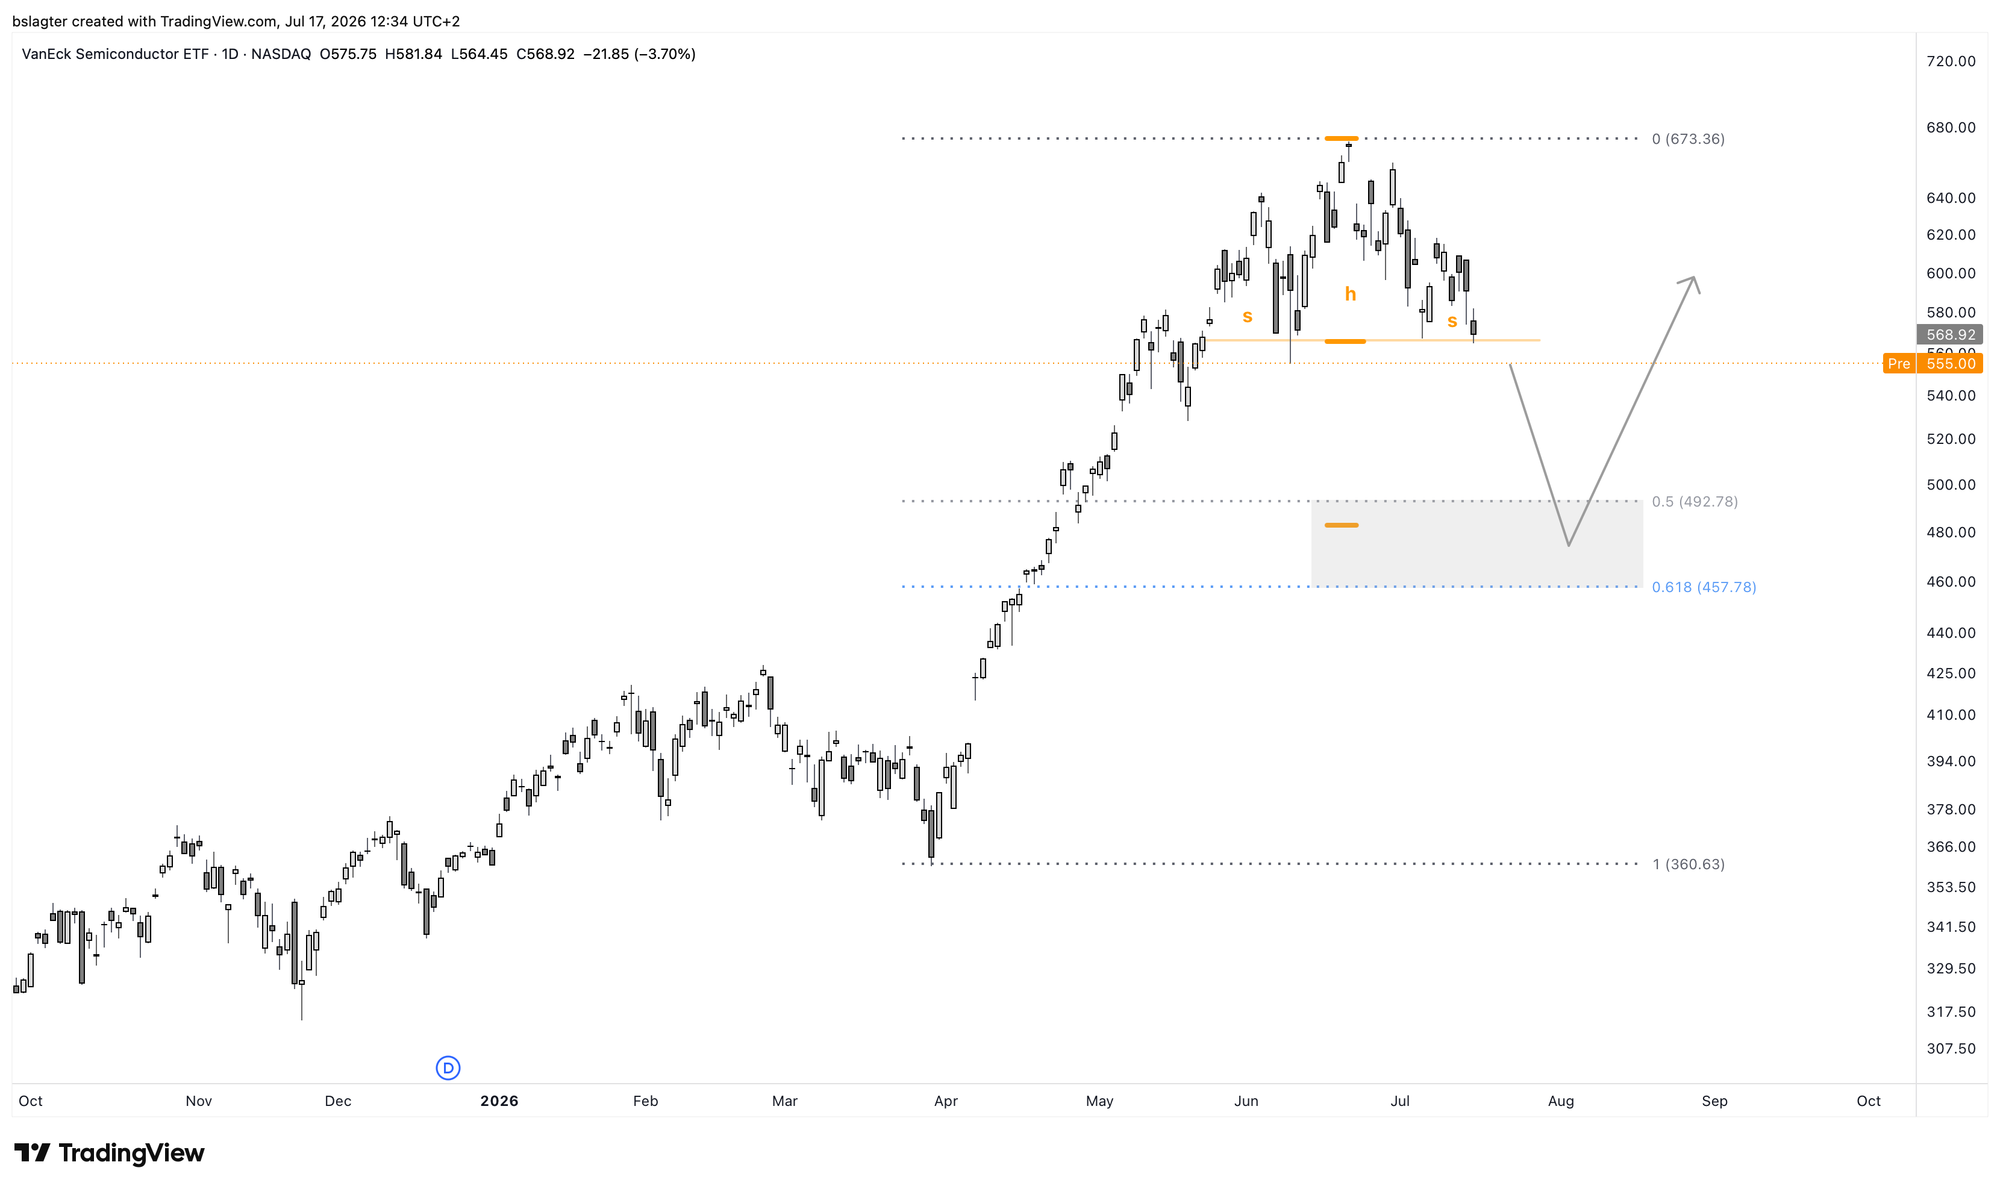
Many of the stocks on the receiving end of the AI investments have fallen quite a bit since the top. Micron (MU) is 34% below its top, SanDisk 40%, and SK Hynix, at its lowest point, already 44%.
VanEck's Semiconductor ETF (SMH) captures this sector fairly well, and now stands 16% below its top. If this doesn't stay at a consolidation and we see a deeper correction, you could interpret the formation as a head-and-shoulders pattern. In that case, it stands to reason that you could enter at prices between $450 and $500.
All in all, the picture emerges that this summer is a good period for bitcoin, gold, silver, and tech stocks to build a position for the years ahead, based on the assumption that AI continues to develop and ultimately supports economic growth.
2️⃣ What happened to the memecoin supercycle?
 Contribution by
 Sam
In 2024, bitcoin finally set a new all-time high above the $69,000 of the 2021 bull market top. In the roughly year and a half that followed, a new top of over $126,000 was set in October 2025.
During that period, altcoins often had a hard time. Thanks to platforms like pump.fun, thousands of new altcoins hit the market every day. Many were designed to make a quick buck and lost most of their market value in no time.
Because of this ample and growing supply, there wasn't enough money in circulation to kick off the 'alt season' phenomenon. Alt season is a period of a few months during which the broad altcoin market shows insane gains, under the motto 'a rising tide lifts all boats.'
Of course, there were weeks when altcoins outperformed bitcoin across the board, but these periods were short, less powerful, and moreover, the gains were given back within a short time.
What was mainly needed were narratives that made a certain group do very well for a certain time. There was the narrative around Celestia (TIA), which could be used to earn airdrops. Altcoins with AI in the name also did well for quite a while.
At a certain point, there was also a strong narrative around memecoins. All sorts of memecoins showed gigantic gains in a short time, and there was talk of the memecoin supercycle. Spoiler alert: it never materialized.
Let's take a look at a few of the more prominent memecoins from that period.
- Popcat rose more than 16,000% on the exchange Poloniex between March 2024 and October 2024, only to give back 99% of it afterward.
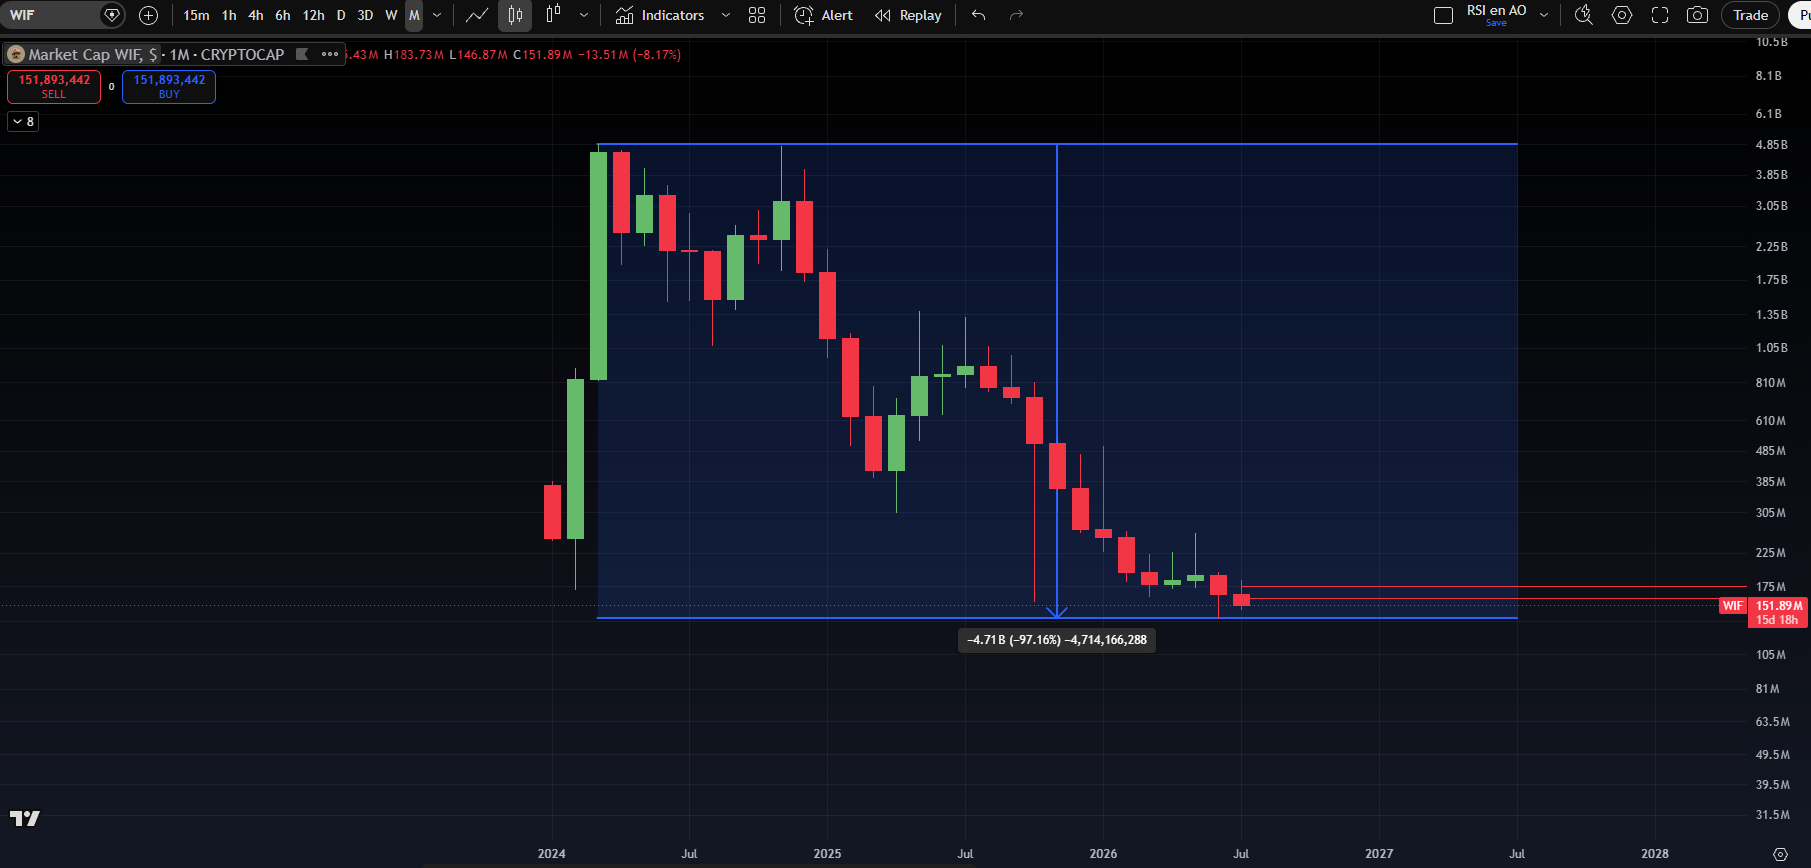
- Dogwifhat (WIF) reached a market cap of nearly $5 billion, only to give back 97% of it.
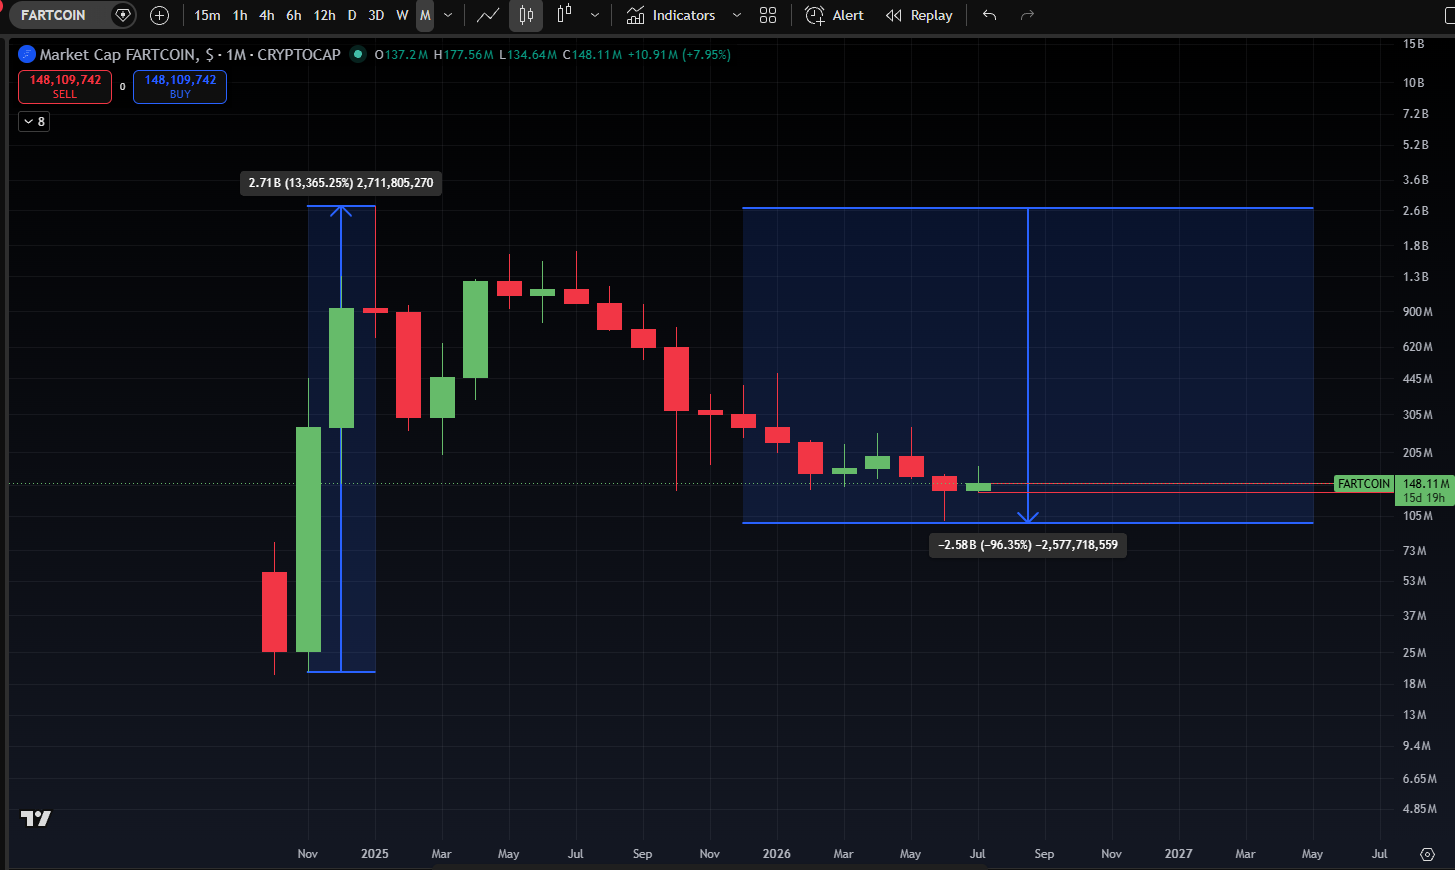
Another well-known example with a lot of mindshare was fartcoin, with a bizarre rise of more than 13,000% in just 3 months. Fartcoin, too, didn't escape the malaise, subsequently dropping 96% from its top.
These examples clearly show what makes the world of crypto both beautiful and difficult. There are wonderful returns to be made in a short time if you spot a good narrative early. But be well aware that these returns only become real when you actually take profits.
No matter how strong a narrative seems, there's always an end to it. So make sure that when the music stops, you're quick to reach the exit.
3️⃣ A normal bull market correction for AI stocks, for now
 Contribution by
 Thom
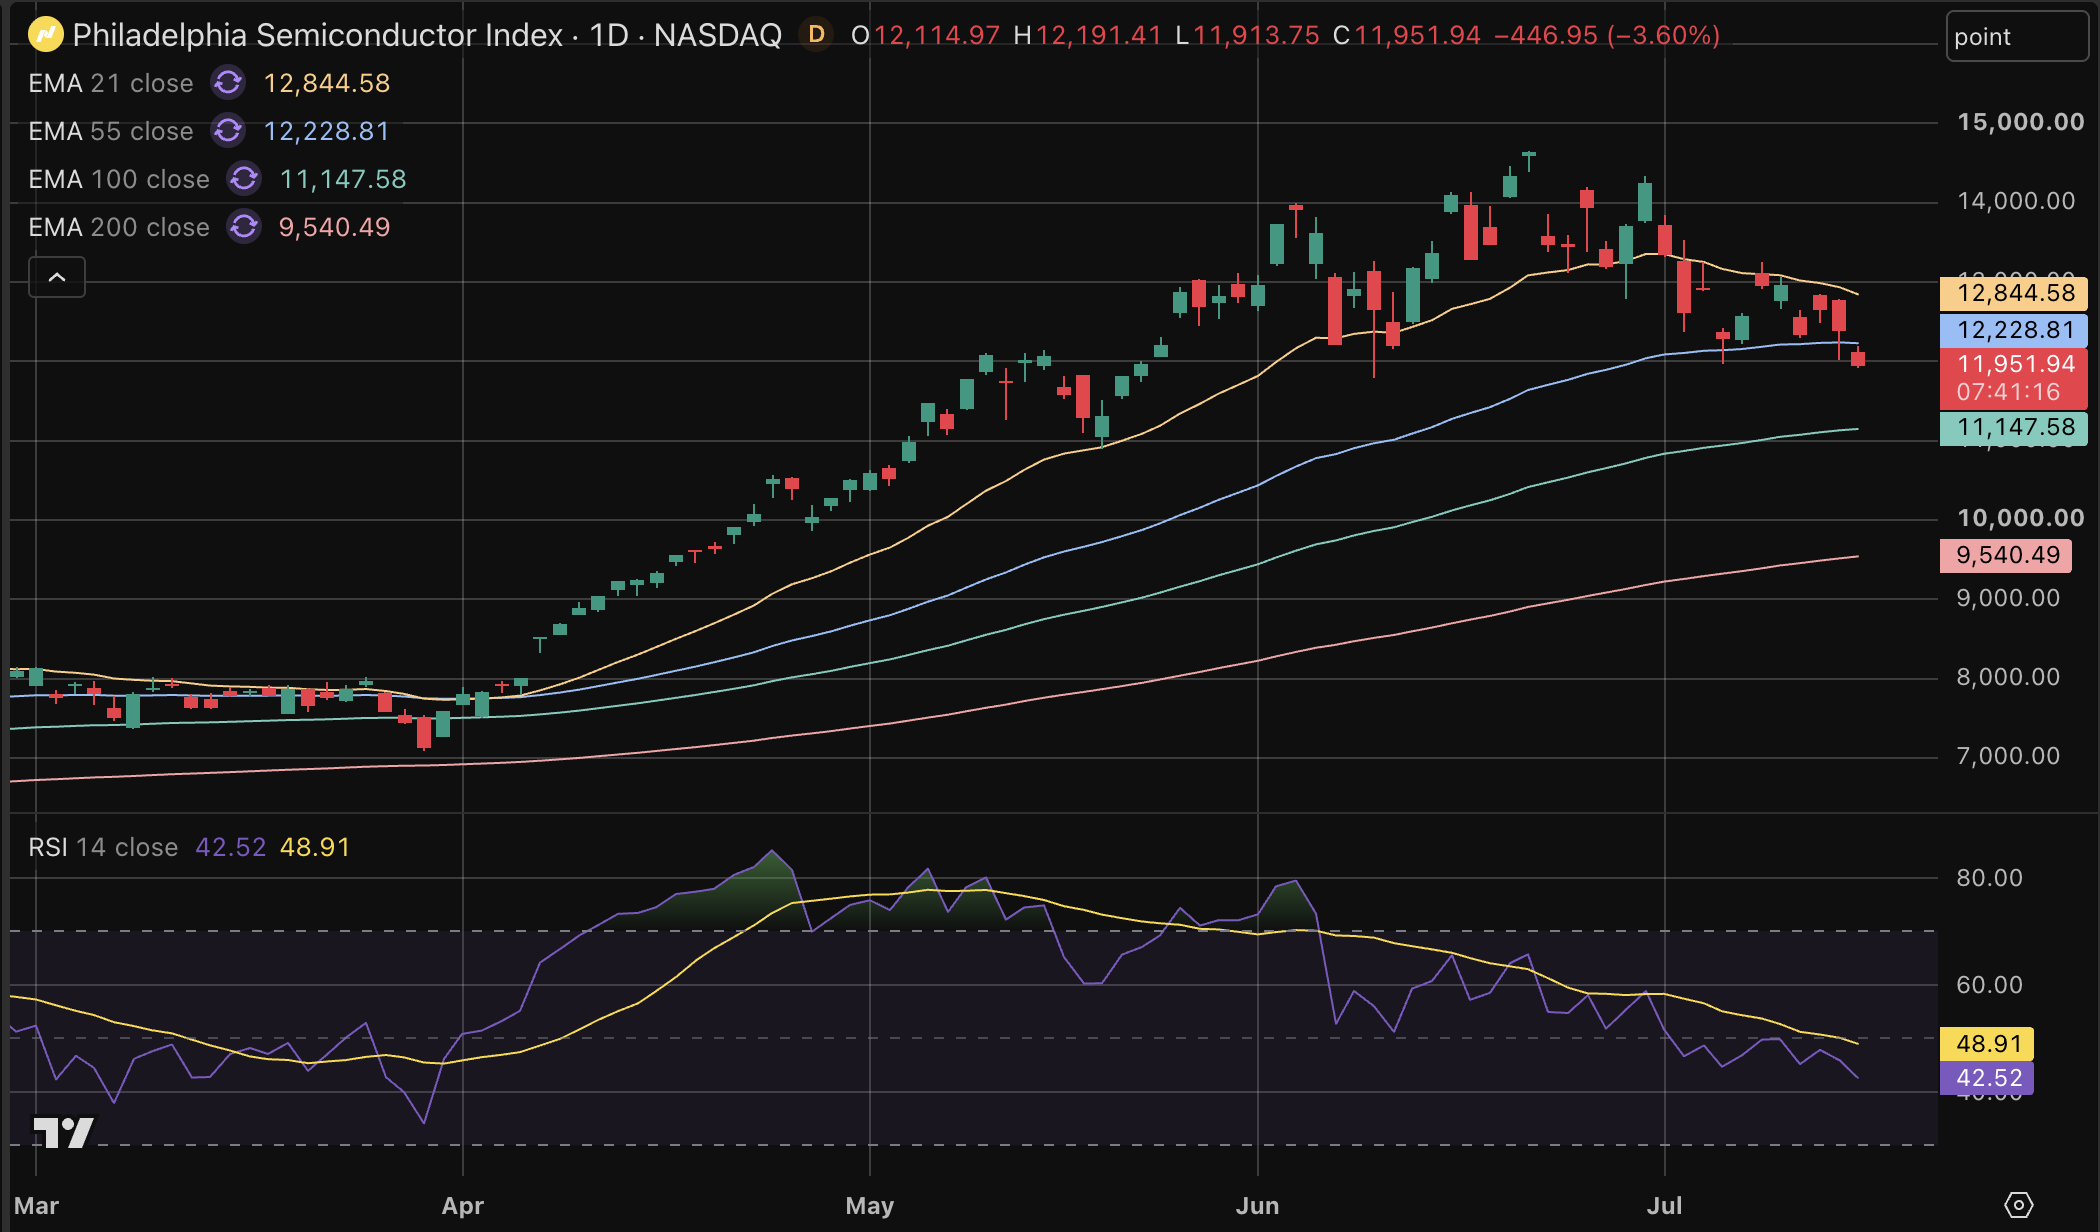
The steep corrections in chip stocks have the market speculating over whether the AI rally has seen its best days. Since the last peak, the US chip index (SOX) has dropped by nearly 20 percent. Some individual stocks took a considerably larger correction on the chin.
In the context of that question, I came across an interesting analysis from Warren Pies, the founder of 3Fourteen Research. His main message is that a powerful structural bull market has historically gone hand in hand just fine with multiple painful corrections. Which is, of course, something we as bitcoiners actually knew all along.
According to Pies, US chip stocks first appeared in his so-called blow-off screen 32 months ago. That model tries to identify situations in which a sector shows extremely strong momentum.
Such a signal sounds negative at first. The term blow-off quickly conjures the image of a final, vertical price surge before a bubble bursts.
History, however, shows according to Pies that such a phase can last far longer than investors expect. A market can be extremely strong, correct hard along the way, and then still go on to reach new highs.
Since the first signal, the chip sector has been through two major corrections. In the second half of 2024, the sector fell 26 percent in roughly one month. In early 2025, a correction of about 35 percent followed over two months.
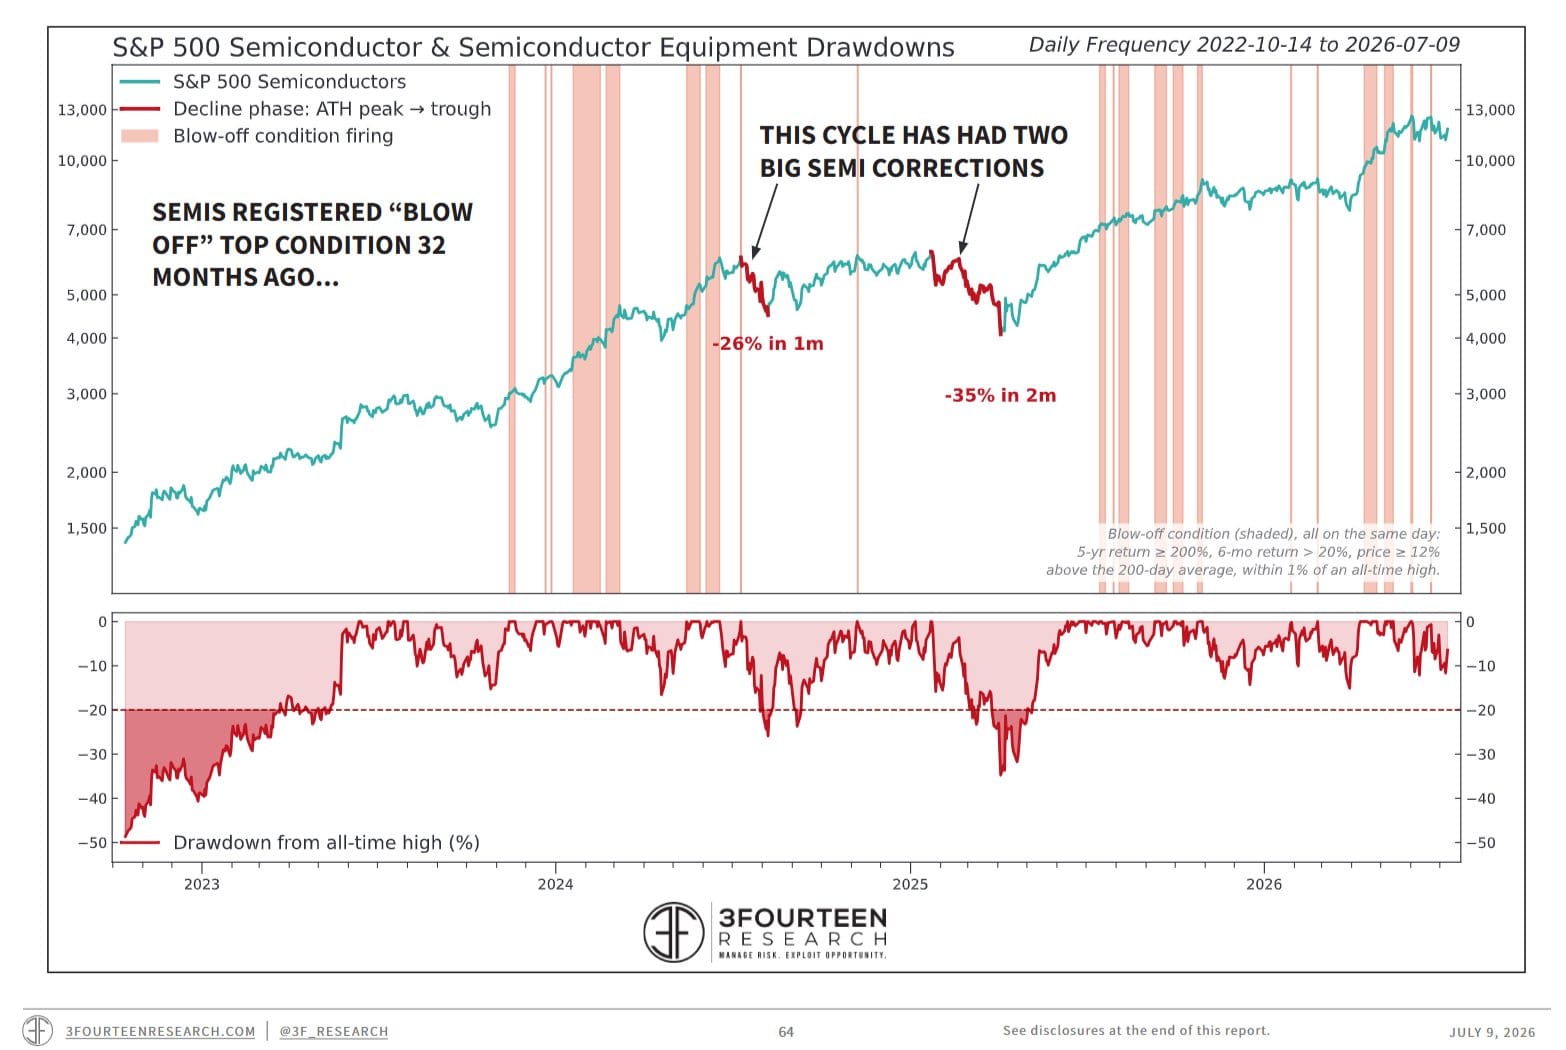
Both declines turned out, in hindsight, not to be the end of the bull market. The current pullback of about 18 percent is therefore, for now, smaller than the earlier corrections within this cycle.
That's no guarantee the bottom has already been reached. It does put the price decline in perspective. A sector that has risen enormously over a few years doesn't have to move up in a straight line to remain in a bull market.
Pies's second chart goes a step further. In it, he lays the current chip cycle alongside the dotcom bubble from 1995 to March 2000. Both lines begin at the moment the sector first met the conditions of his blow-off model. From that starting point, the two cycles show striking similarities.
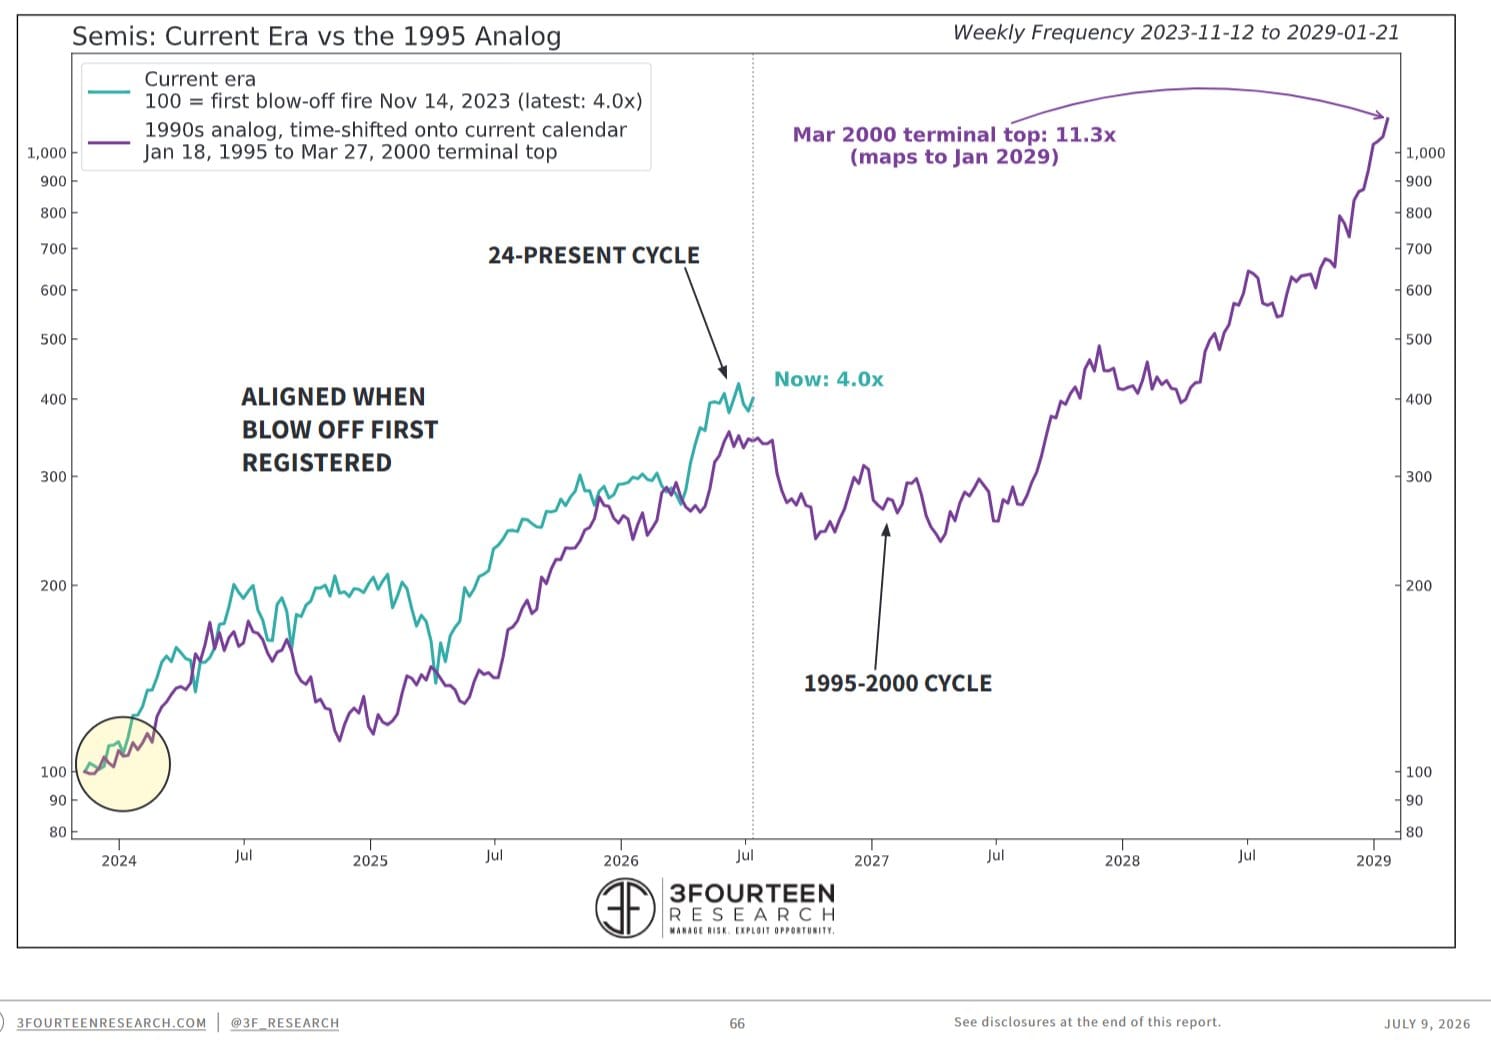
During the 1990s, the bull market lasted another roughly 63 months after the first blow-off signal. Over that period, the sector ultimately rose to more than eleven times the level at which the signal emerged.
That didn't happen without headwinds. According to Pies, chip stocks on average took roughly one 20 percent correction per year.
The route to the top was therefore anything but calm. Investors were regularly confronted with declines that at the time probably felt like the end of the tech bubble.
If the current cycle were to follow the same timeline, the eventual top wouldn't come until around January 2029. For bitcoin, that would mean it also has to fight for capital with the AI complex for quite a while longer. That's not ideal, but it does create opportunities.
4️⃣ Bitcoin relatively strong in a tough period for growth stocks
Contribution by Thom
Chip stocks are under pressure, despite unexpectedly strong earnings from big names like ASML and TSMC. The market seems mainly worried about the ever-rising investments.
The fact that TSMC says it wants to pour even more capital into expansion is in itself a powerful signal of confidence in the AI cycle. At the same time, that wave of investment is beginning to create macroeconomic pressure.
The buildout of AI infrastructure is strong enough to support economic growth and corporate profits, but in doing so it also contributes to higher interest rates. As a result, the bar for returns on all those investments keeps rising.
Genuine growth stocks in particular suffer from this. The cash-rich Magnificent Seven are less sensitive to higher financing costs and, after a period of relative stagnation, are beginning to break out again relative to the rest of the market.
This week initially started off positive. ASML posted strong figures, while the US inflation prints came in lower than expected. The market thus got support on two fronts: earnings growth held up and interest rates fell.
Still, the US 10-year yield remains above 4.5 percent. Moreover, virtually the entire rate complex rose following the resumption of the war with Iran. The real interest rate — the inflation-adjusted price of capital — is also rising in the United States.
The market seems to be having an increasingly hard time with that. Previously, the message that more was being invested in AI was often enough to push prices higher. By now, hardly anyone still doubts that the tech giants will keep investing heavily.
The main question now is whether those investments will ultimately generate enough return to justify their scale.
On top of that comes the war with Iran. Due to the ongoing escalation, this week's lower inflation figures could barely provide lasting relief. De-escalation seems out of the question for now.
As a result, the interest rate question for the US central bank has mainly been kicked down the road. A rate hike in July appears to be off the table for now, but for September and October the debate remains wide open.
What's notable is that bitcoin is meanwhile holding up relatively well, while large parts of the AI complex are having to weather steep price declines. Stocks that recently showed extreme gains in particular are taking hard hits.
Still, it's too early to break out the flags. First, there needs to be more clarity about the war and the development of the oil price. That combination could, via higher inflation expectations and interest rates, still leave a bitter aftertaste.
It's also important that the lower inflation figures the market reacted to so enthusiastically this week related to a period in which the war and the rising oil price were far less prominent.
Finally
You can read back all previous editions of Alpha Markets in the archive. Questions, comments, and suggestions are warmly welcome in the community.
Thank you for reading!
To stay informed about the latest market developments and insights, follow our team members on X:
- Bart Mol (@Bart_Mol)
- Peter Slagter (@pesla)
- Bert Slagter (@bslagter)
- Mike Lelieveld (@mlelieveld)
We appreciate your continued support and look forward to bringing you more comprehensive analysis in our next edition.
Until then!