Bitcoin Back Above $70,000
Following the Middle East ceasefire, bitcoin climbed back above $70,000. But our base case remains that the bear market bottom still lies ahead. Patience is key.

In the short term, the war in Iran is driving sentiment across financial markets. Prices swing back and forth between hope and fear, fueled by a constant stream of conflicting reports.
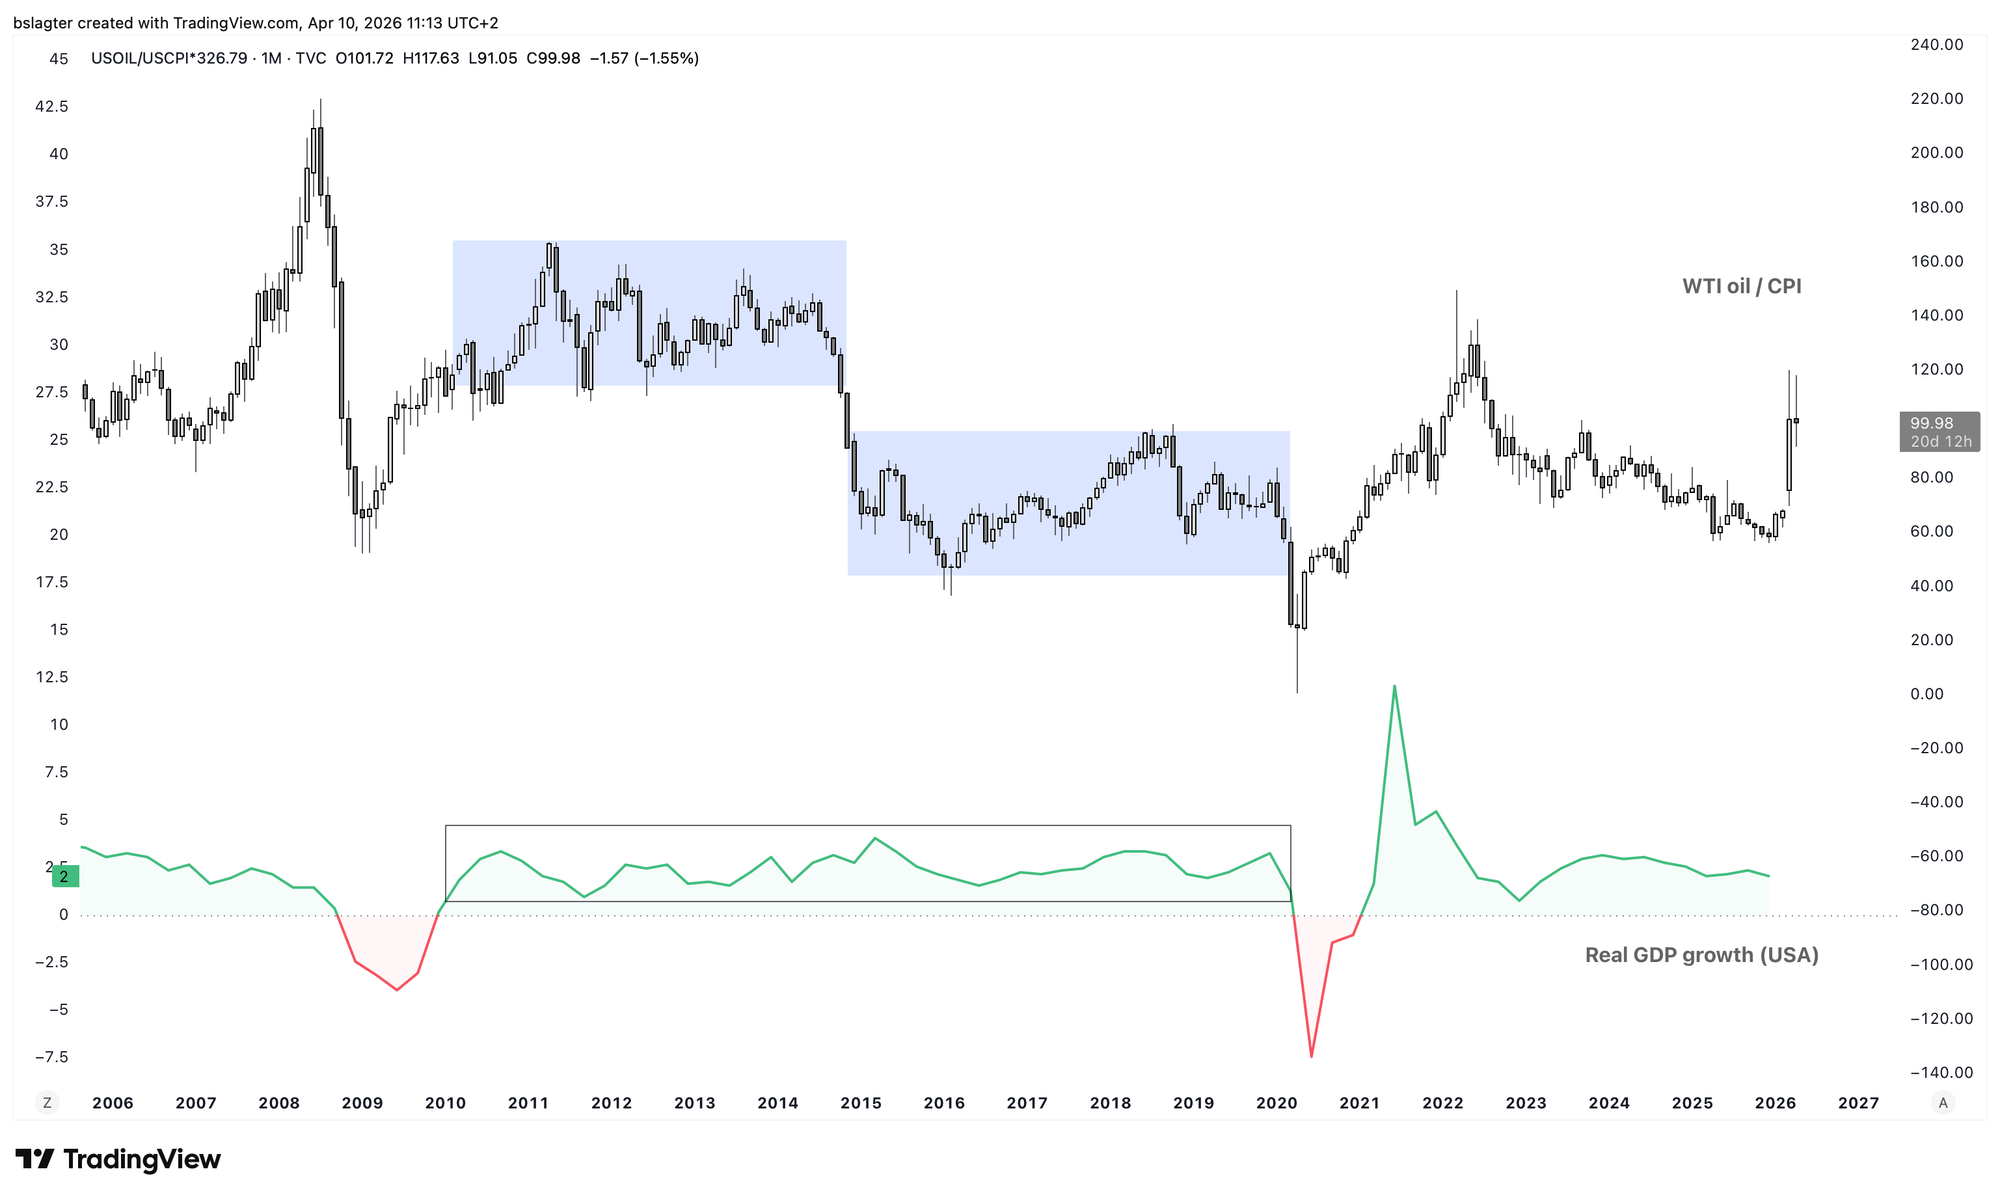
The main concern isn't the current oil price itself. At $100 to $150 per barrel, it's considerably higher than the roughly $60 to $80 range of recent years, but the economy can handle that.
The chart below shows the price per barrel of US oil, adjusted for inflation. Between 2010 and 2020, you saw the same economic growth with two very different oil prices. Measured in 2026 dollars, the oil price averaged $140 per barrel between 2010 and 2015, and $70 per barrel between 2015 and 2020.
What investors are worried about is the right tail of the probability distribution. That's where unlikely events live — like escalation into nuclear war and oil at $350 per barrel.
You can think of the sharp market swings as investors constantly reassessing the probability that such a scenario actually unfolds. As soon as a scenario shifts from plausible back to unlikely in investors' eyes, markets can return to business as usual.
Compare it to the war in Ukraine (2022) and the trade war (2025). Both are still ongoing, but for markets they've become background noise. We've seen the maximum escalation; everything now plays out within those boundaries.
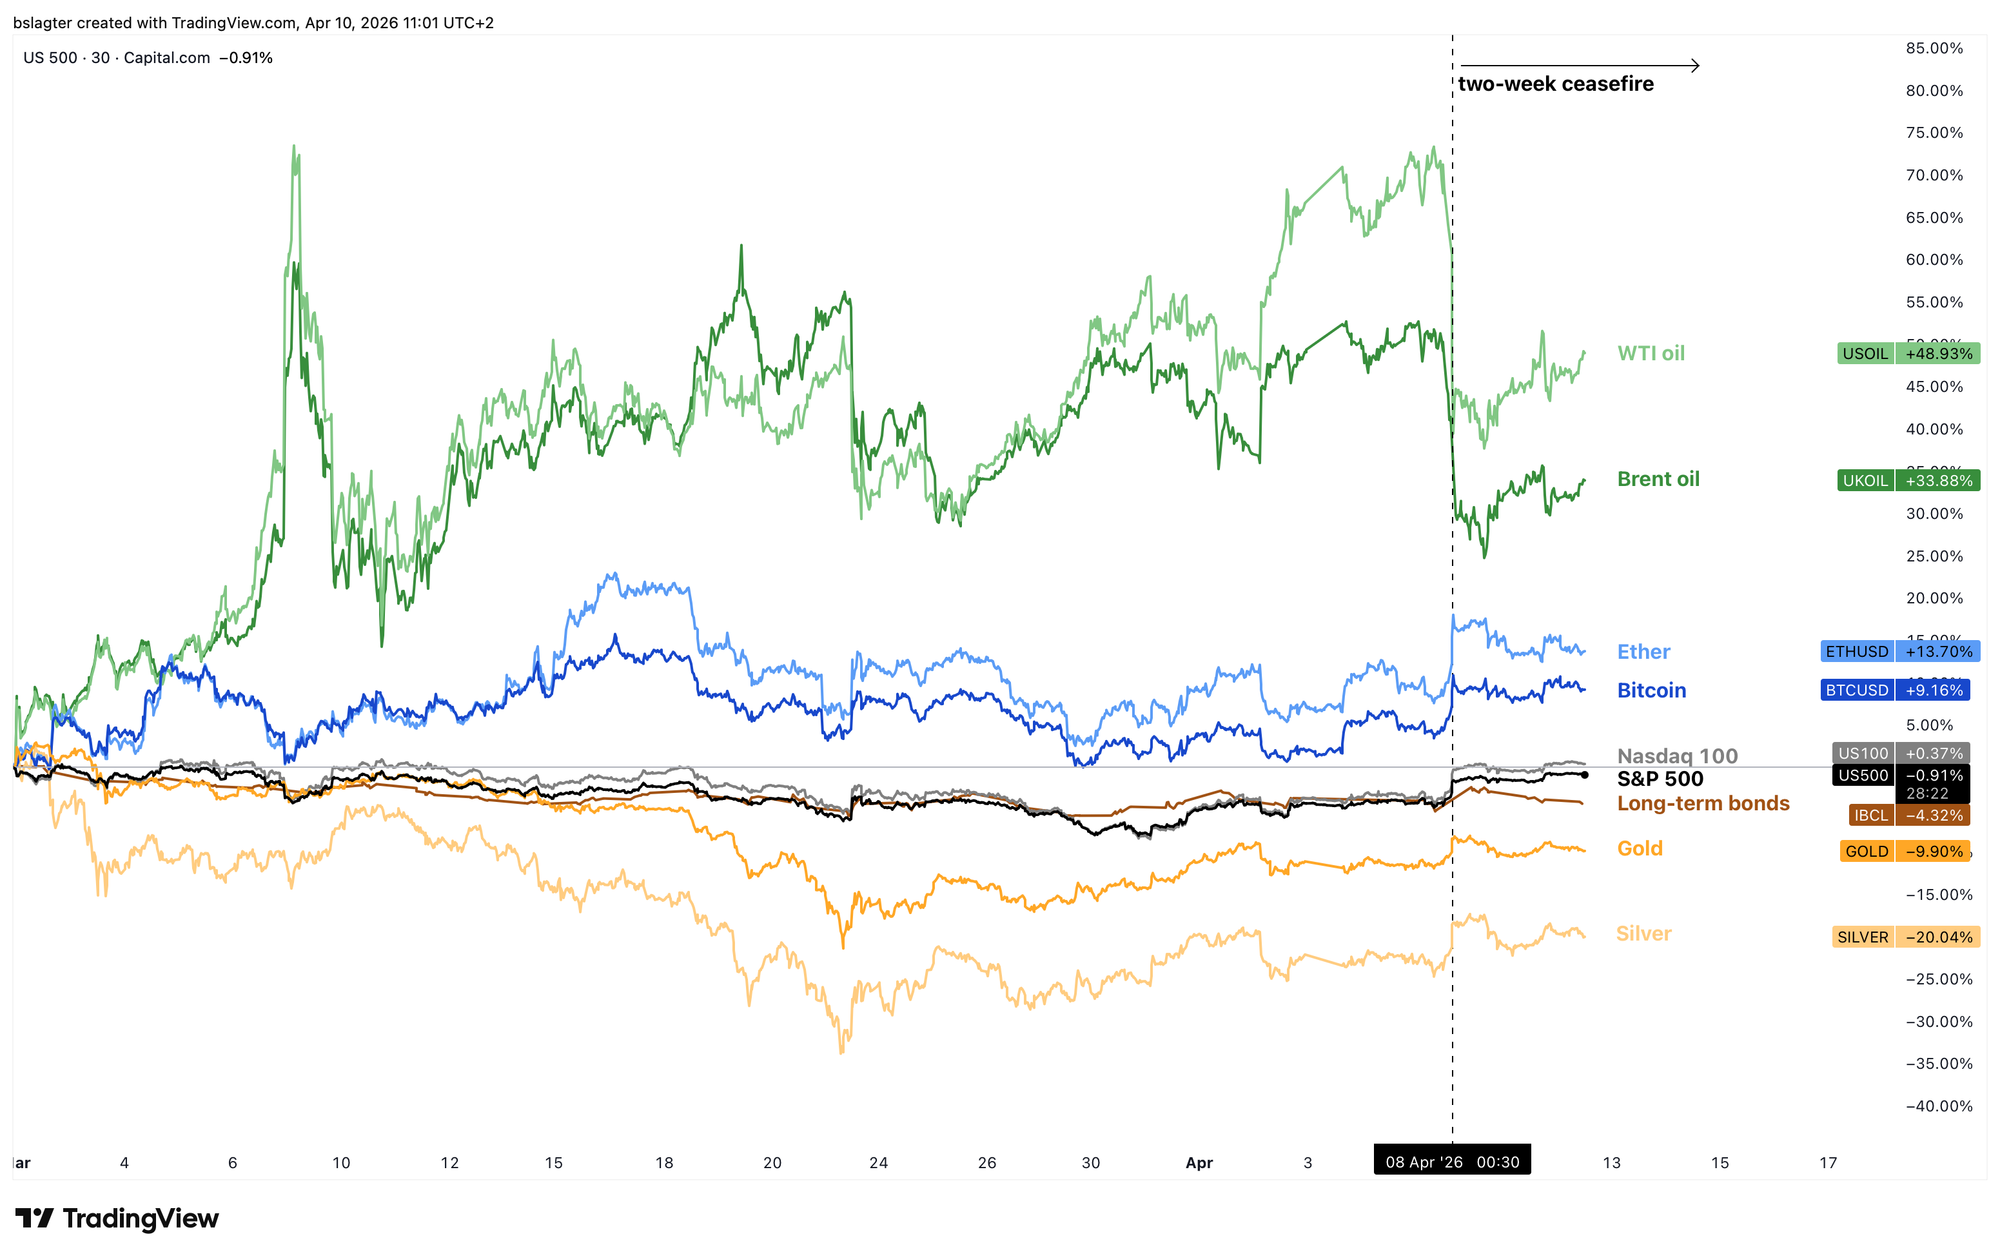
Last Wednesday, Iran and the US agreed to a ceasefire. They're taking two weeks to work toward a definitive end to the war. The market reacted with relief, as shown in the chart below.
But it's not enough to put the conflict behind us. It remains uncertain whether we've already seen the outer limits of escalation. The ceasefire is fragile and trust between the many parties involved is brittle.
Bitcoin is riding the waves of war rhetoric. But it's doing so within a narrow band, with each weekly close between $65,000 and $73,000. That relative stability continues to stand out. It's not proof of bitcoin as a safe haven — you need a much longer track record for that. But it does add another checkmark for the narrative of bitcoin as digital gold.
In the short term (days, weeks), the Iran war dominates. In the long term (decades), bitcoin's price follows adoption — the degree to which people worldwide have embraced bitcoin as a store of value.
Right in between lies the market cycle: the alternation of strength and weakness that we call bull and bear markets in crypto.
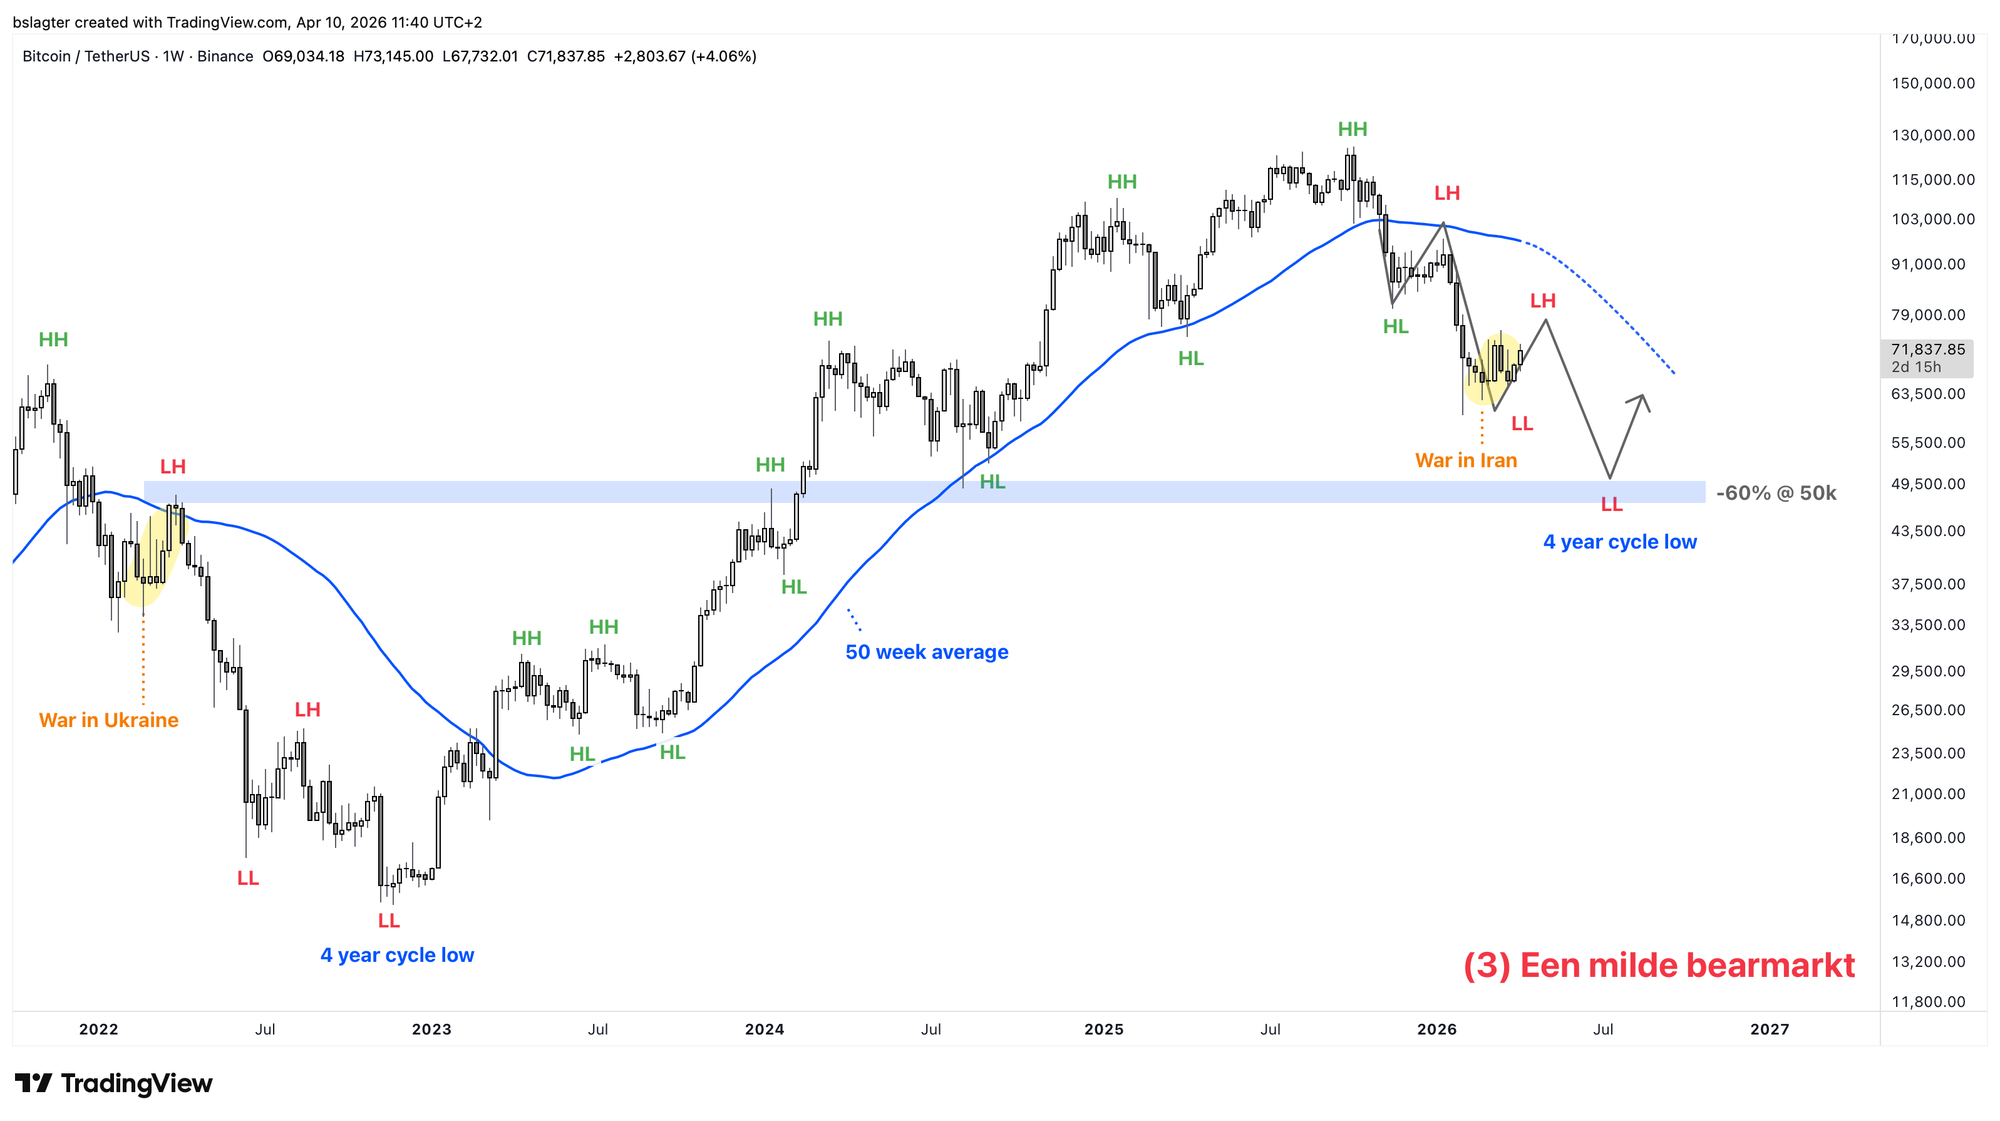
And in that wave pattern, we're currently in the bear market. The weekly chart trend is down: lower highs, lower lows, and price below the dominant moving average. And there's still little evidence for the scenario that we've already hit the bottom.
The medium term (months) demands a lot of patience. In last week's Alpha Markets, we described the progress in the bottoming process. Are we there yet? No, probably not.
From a cycle analysis perspective, the first point at which an end to this bear market becomes plausible is getting closer. At the end of the second quarter, we expect a weekly cycle low, and that could very well also be the yearly cycle low — the bear market bottom. More on that in the section for our Alpha Plus members.

We continue with the following topics for our Alpha Plus members:
- A new daily cycle
- This is the bottom, unless...
- Ether takes its time
- Rising risk appetite as volatility declines?
- Economic data remains encouraging for bitcoin
1️⃣ A new daily cycle
Bert
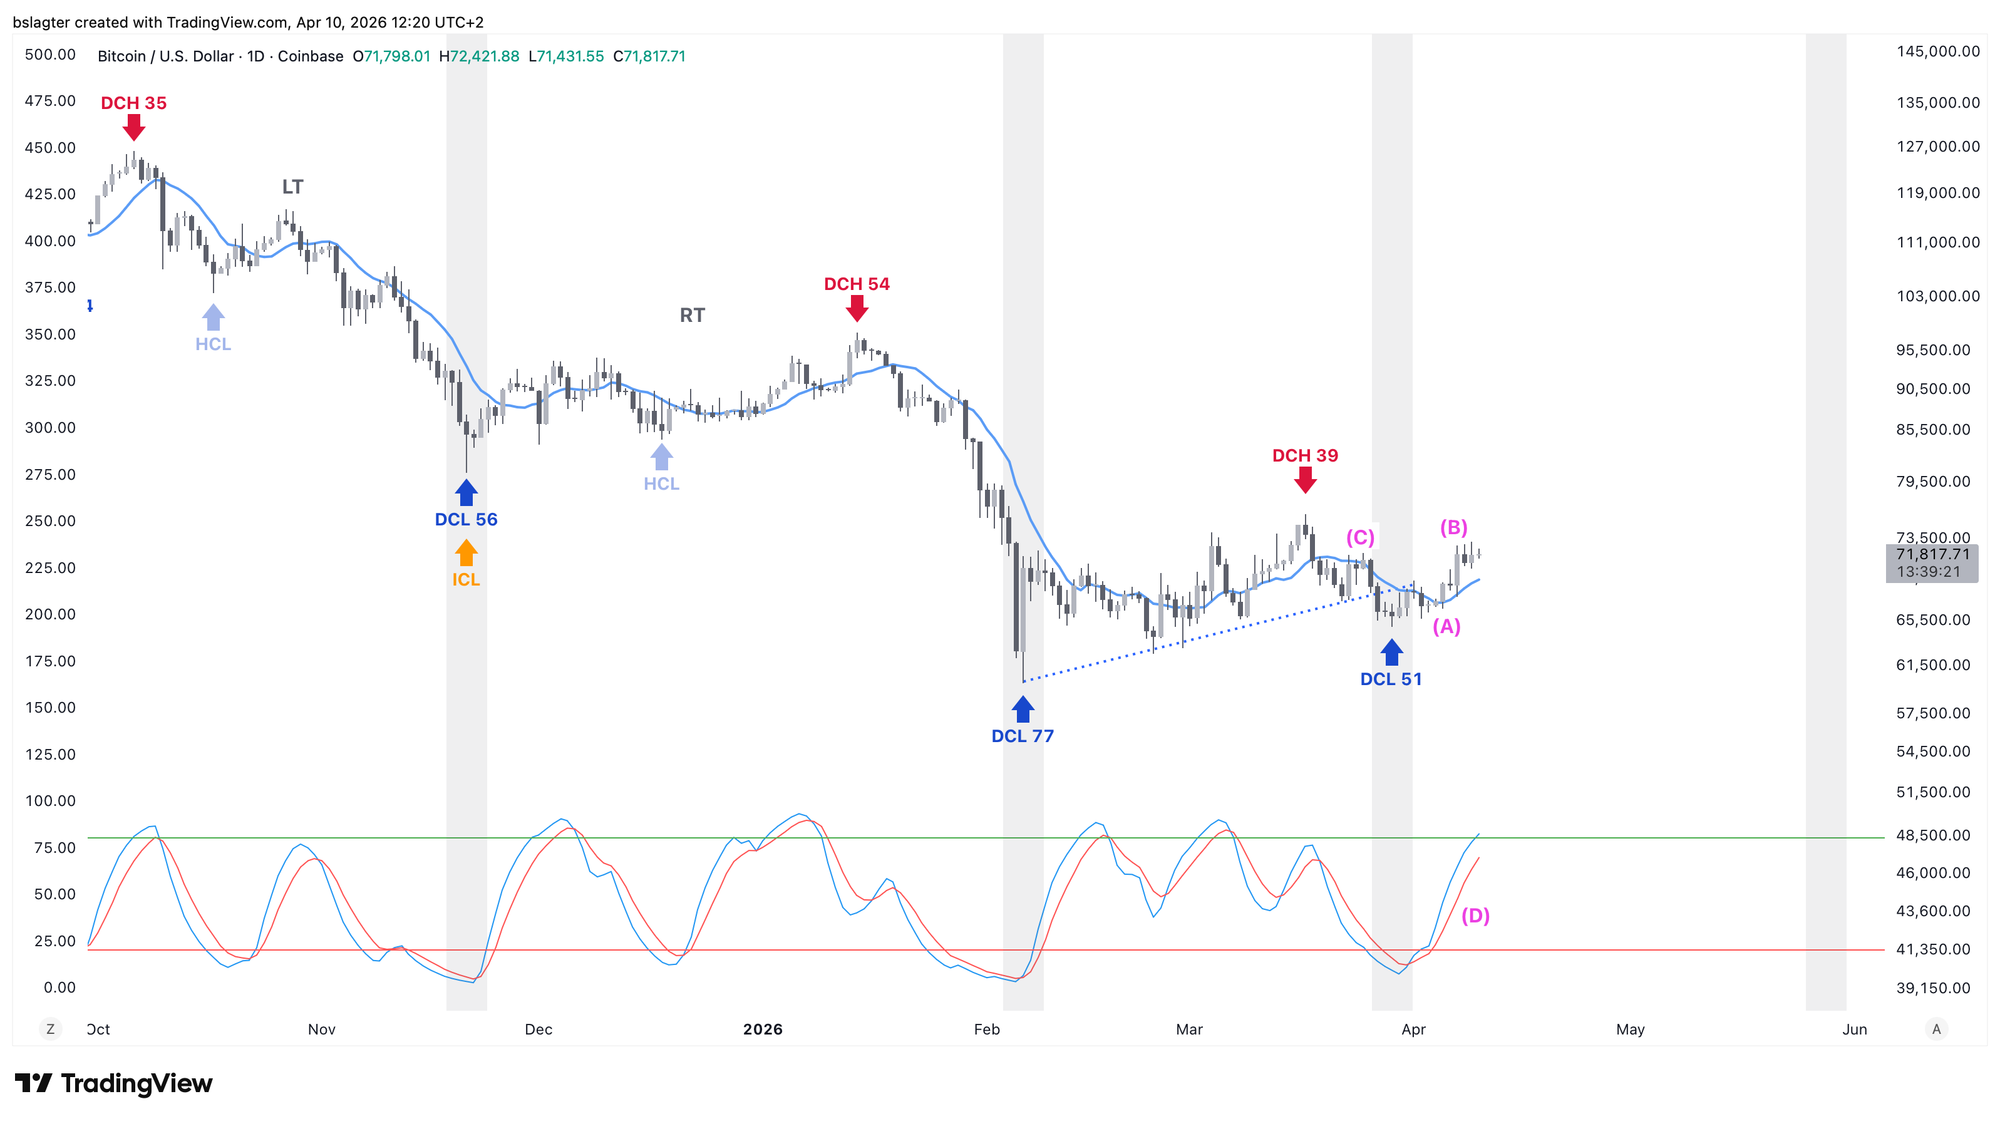
All signs point to March 29 being the daily cycle low (DCL) in a somewhat shorter daily cycle of 51 days. The average is 60 days. A shorter daily cycle is fairly common after a long one — the previous cycle was 77 days.
The arguments are: the break above the 10-day moving average (A), the strong continuation of the rally afterward (B), a rise above the point where we dropped below the 10-day moving average (C), and confirmation from the oscillator (D).
Now we can start counting.
- Suppose this weekly cycle consists of three daily cycles, and this is the last daily cycle in this weekly cycle. The daily cycle low (DCL) would then also be the weekly cycle low (ICL).
- Suppose this weekly cycle is the last weekly cycle of this yearly cycle. The weekly cycle low (ICL) would then also be the yearly cycle low (YCL) — the bear market bottom.
The probability isn't 100%; sometimes a (short) fourth daily cycle follows. And we may still have another weekly cycle in this market cycle. But my base case is that this weekly cycle ends at the bear market bottom.
A daily cycle low on March 29 gives us a time target of May 28 (+/- one week), slightly earlier than previously thought, but still at the end of the second quarter.
It wouldn't be surprising if bitcoin's price climbs a bit further in the first half of this daily cycle. That would create room for the pattern we typically see around bottoms (and inversely around tops) on bitcoin's weekly chart — namely bullish divergence between price and momentum indicators.
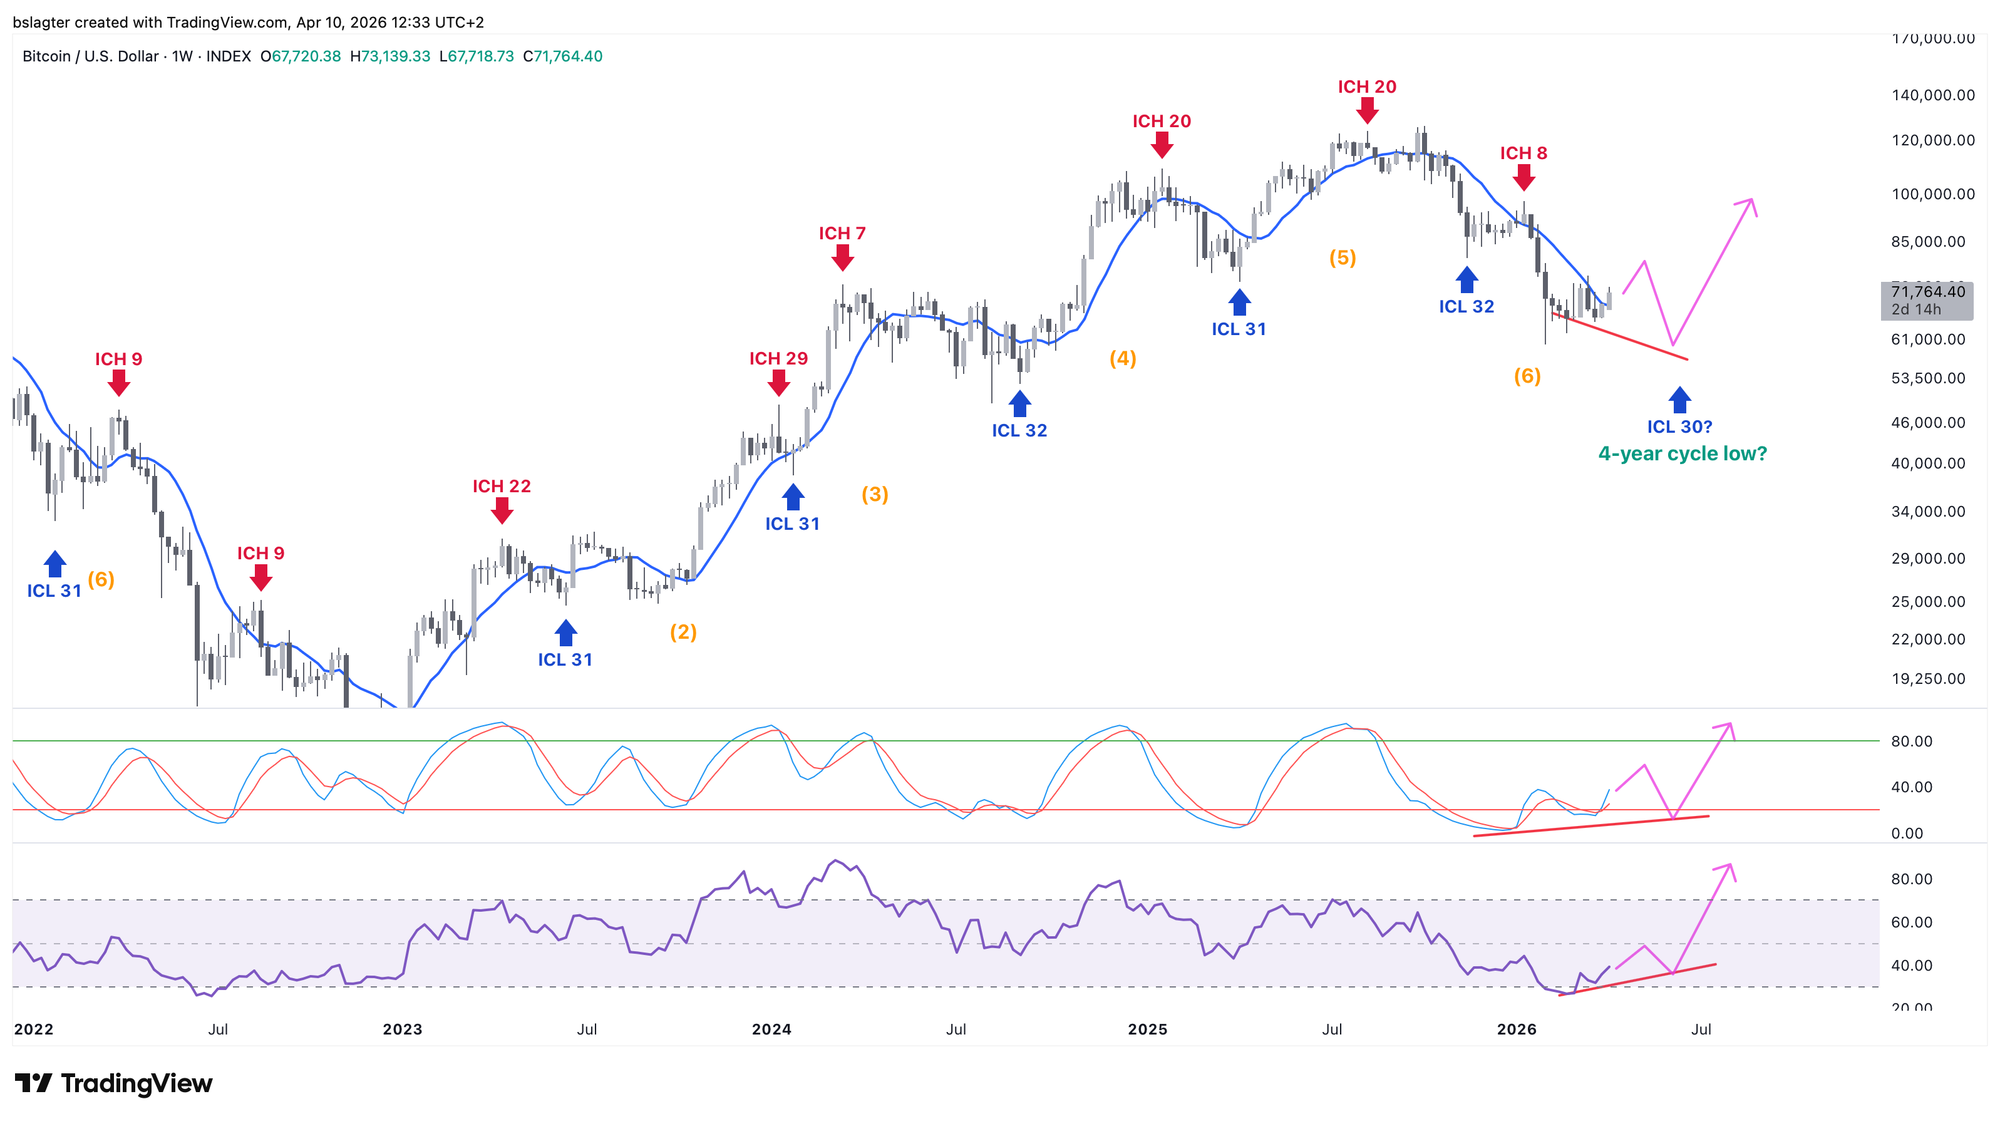
Below is the chart of bitcoin's weekly cycle. We're in week 20 of an average 30 weeks. Late May would put us in week 27, well within the normal range.
The arrows indicate a path where that bullish divergence would emerge. Note that divergences are always drawn across the candle bodies. So you look at the closing price, not the lowest point. For this pattern, the price doesn't need to go much lower.
2️⃣ This is the bottom, unless...
Bert
More and more indicators suggest that prices between $60K and $70K are low enough to form a bear market bottom. Sellers are increasingly less interested in selling, while buyers find the price low enough to step in.
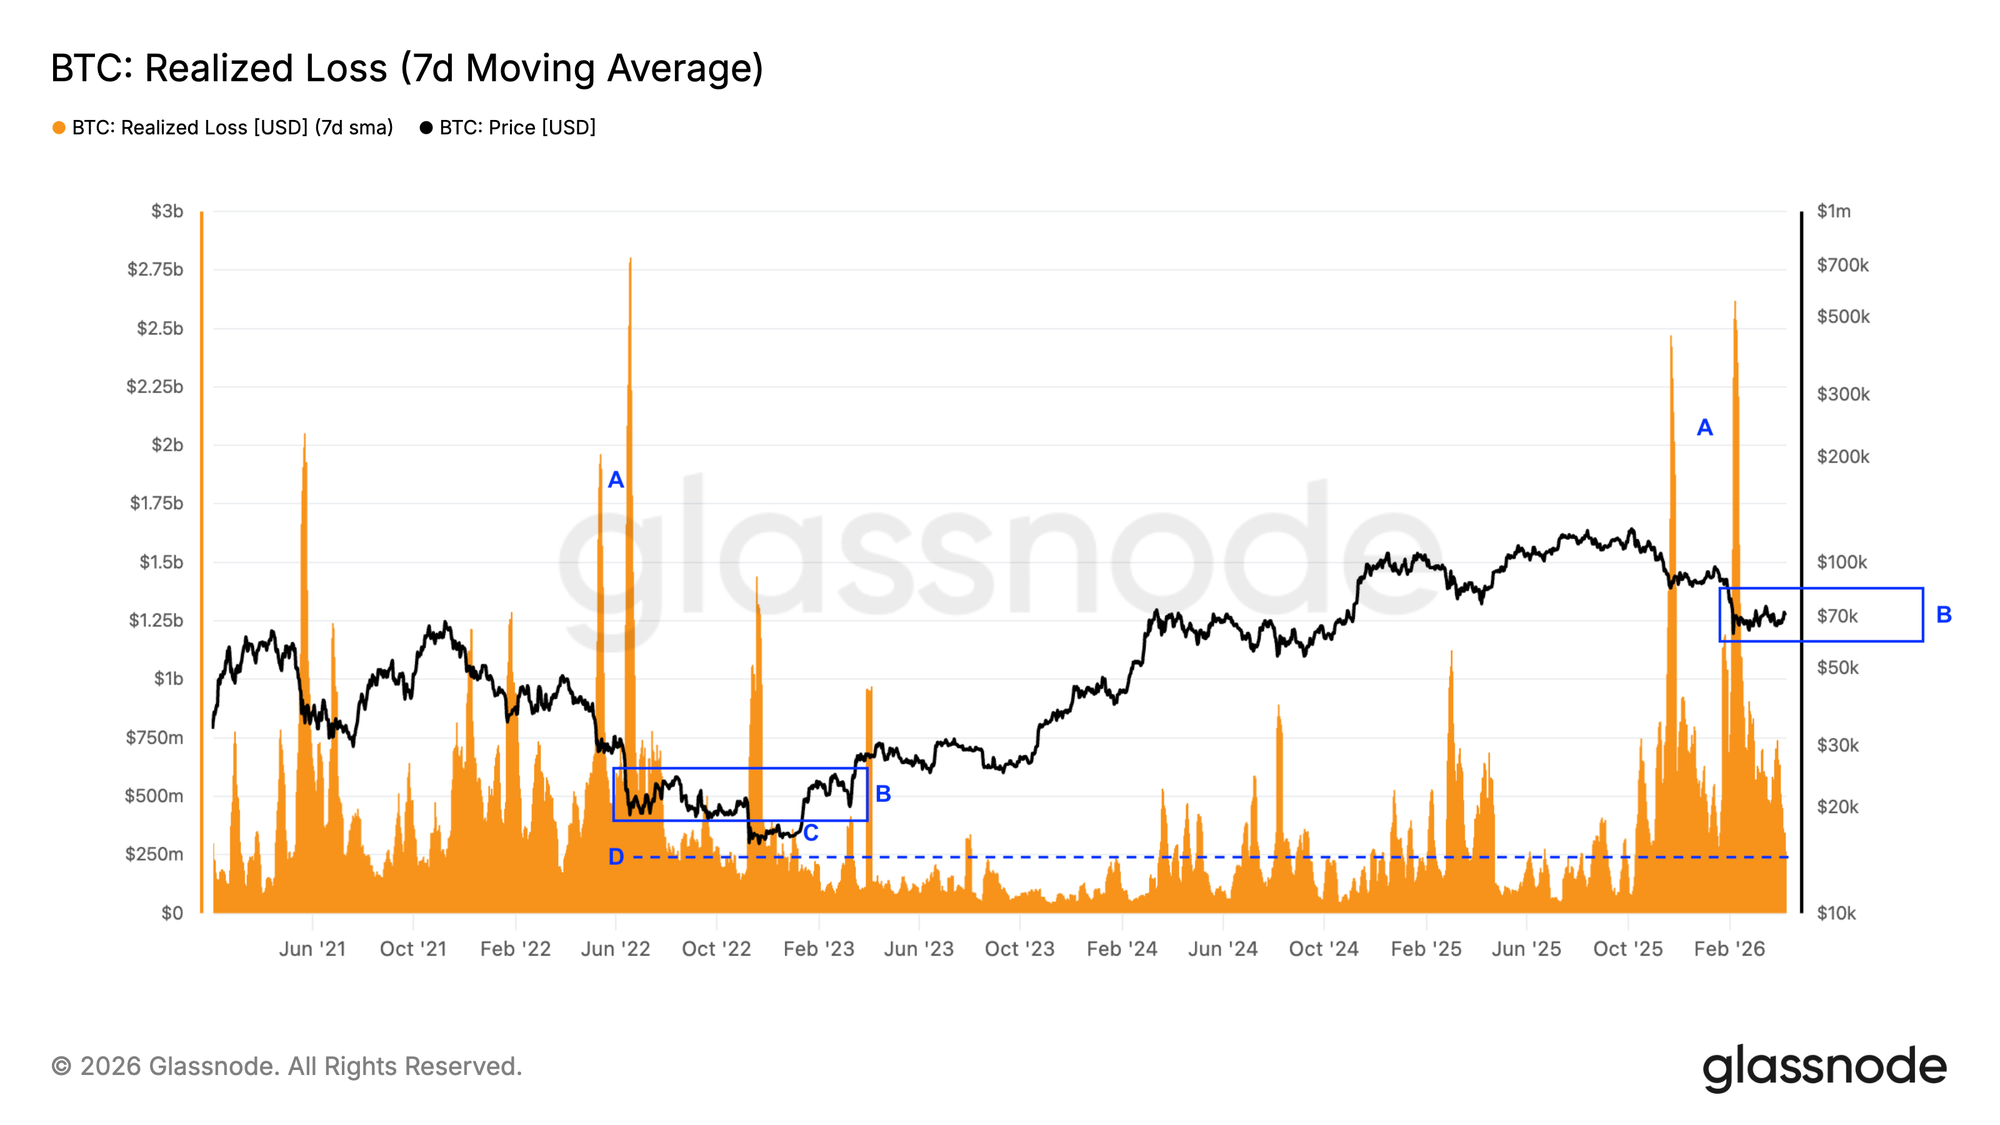
The chart below shows the realized loss — the loss that investors realize on a given day as observed in on-chain data.
Let's look at the previous bear market in 2022. In May and June we saw two major spikes — two serious capitulations (A). After that, the price entered the range around the 200-week moving average and the realized price (B). The price did briefly dip below that (C), but you could argue that was an exceptional situation driven by the collapse of FTX.
Now we see a similar pattern. After two serious capitulations, the realized loss has dropped to the same level as in 2022 (D). Could this again be the price range where the bottom forms?
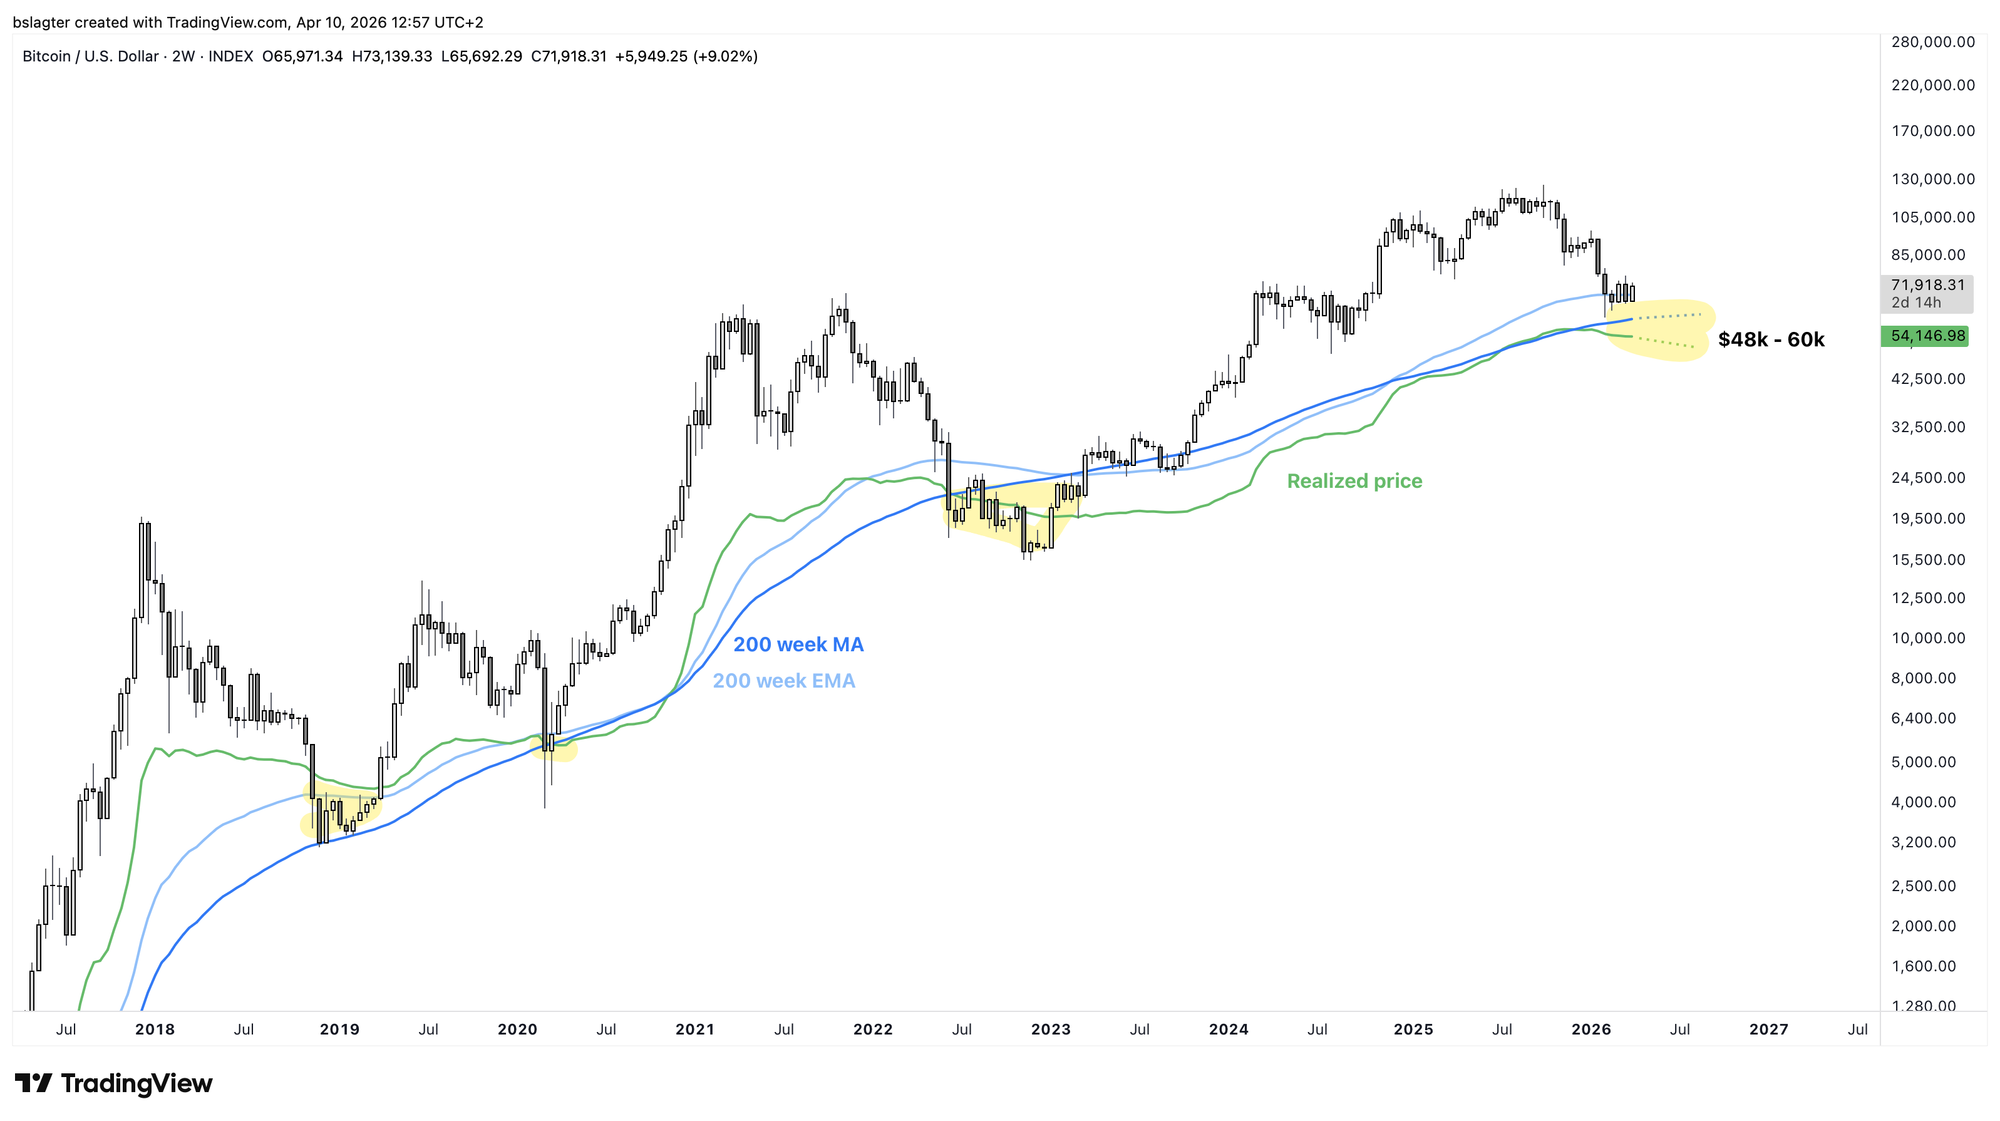
The current price is still slightly above commonly used bottom markers like the aforementioned 200-week moving average and the realized price. In that regard, we could still dip a touch lower.
But it's not necessary. We're seeing enough signals that buyers find these prices attractive — such as the dominance of market buys on spot exchanges, inflows into the ETFs, and a decrease in old bitcoins coming to market.
Barring another black swan event like the FTX collapse in 2022, our base case is that we're now in the zone where the bottom of this bear market is being formed.
3️⃣ Ether takes its time
Sam
In the February 27 Alpha Markets, we discussed the ETHBTC chart in the piece "Is ether temporarily stepping out of bitcoin's shadow?" We argued that if the price moved above the blue line around 0.03, it would be reasonable to expect ether to outperform bitcoin in the following weeks.
Six weeks later, ETHBTC is trading at roughly the same price as back then. At first glance, nothing has changed — and at the end of the day, there certainly haven't been weeks of outperformance. Yet there are two strong arguments for why ether could still outperform bitcoin in the period ahead.
At the time of writing that Alpha Markets on February 26, the price had just posted a strong daily close above the blue line, with the condition that it needed several days of acceptance above it to give the outperformance thesis a fair chance. As visible in the chart, the price quickly slipped back below.
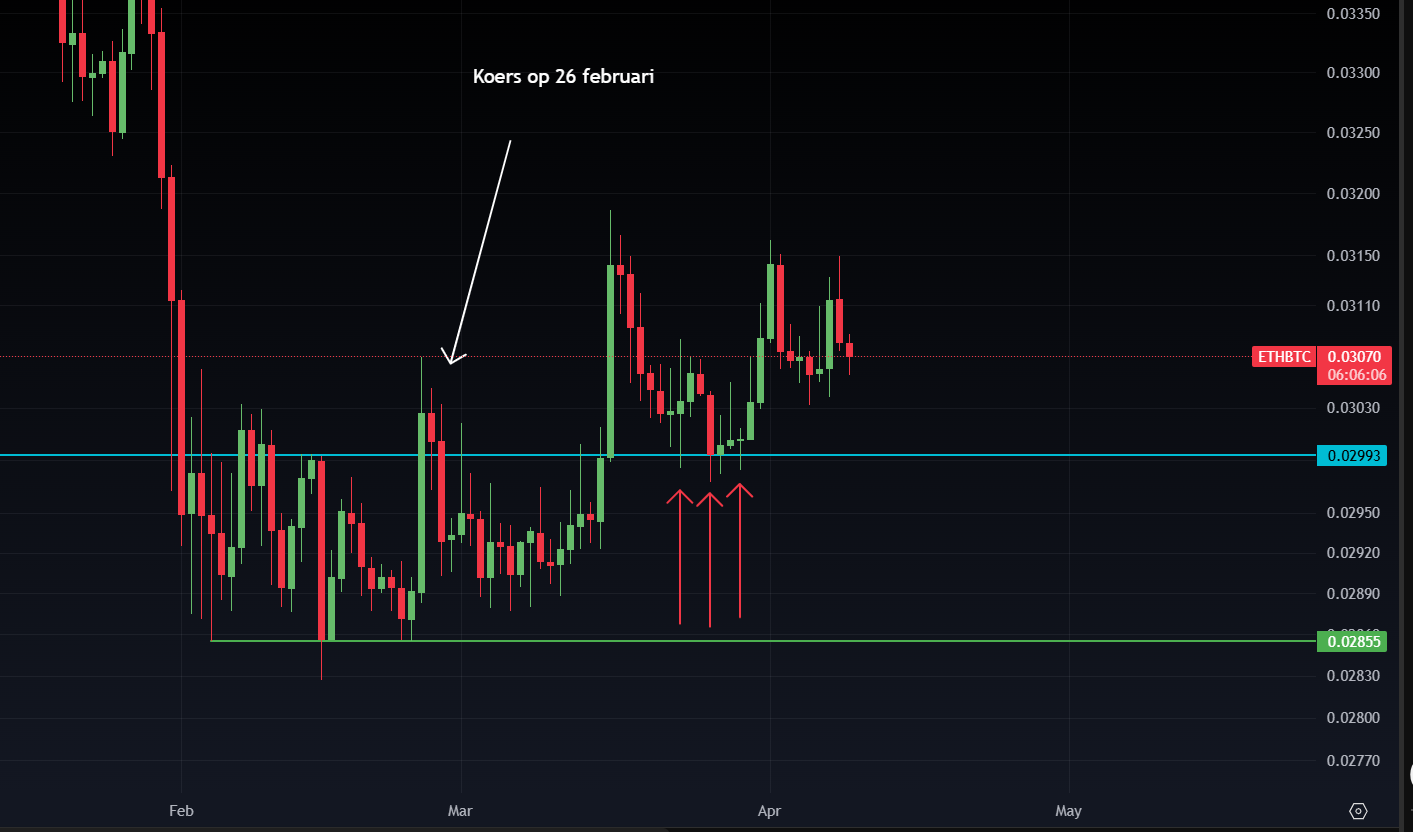
It took until mid-March before another strong daily close appeared above the line, and unlike previous interactions, the price now found support on the blue line, indicated by the red arrows. The shift from resistance to support is a first, strong argument in ether's favor.
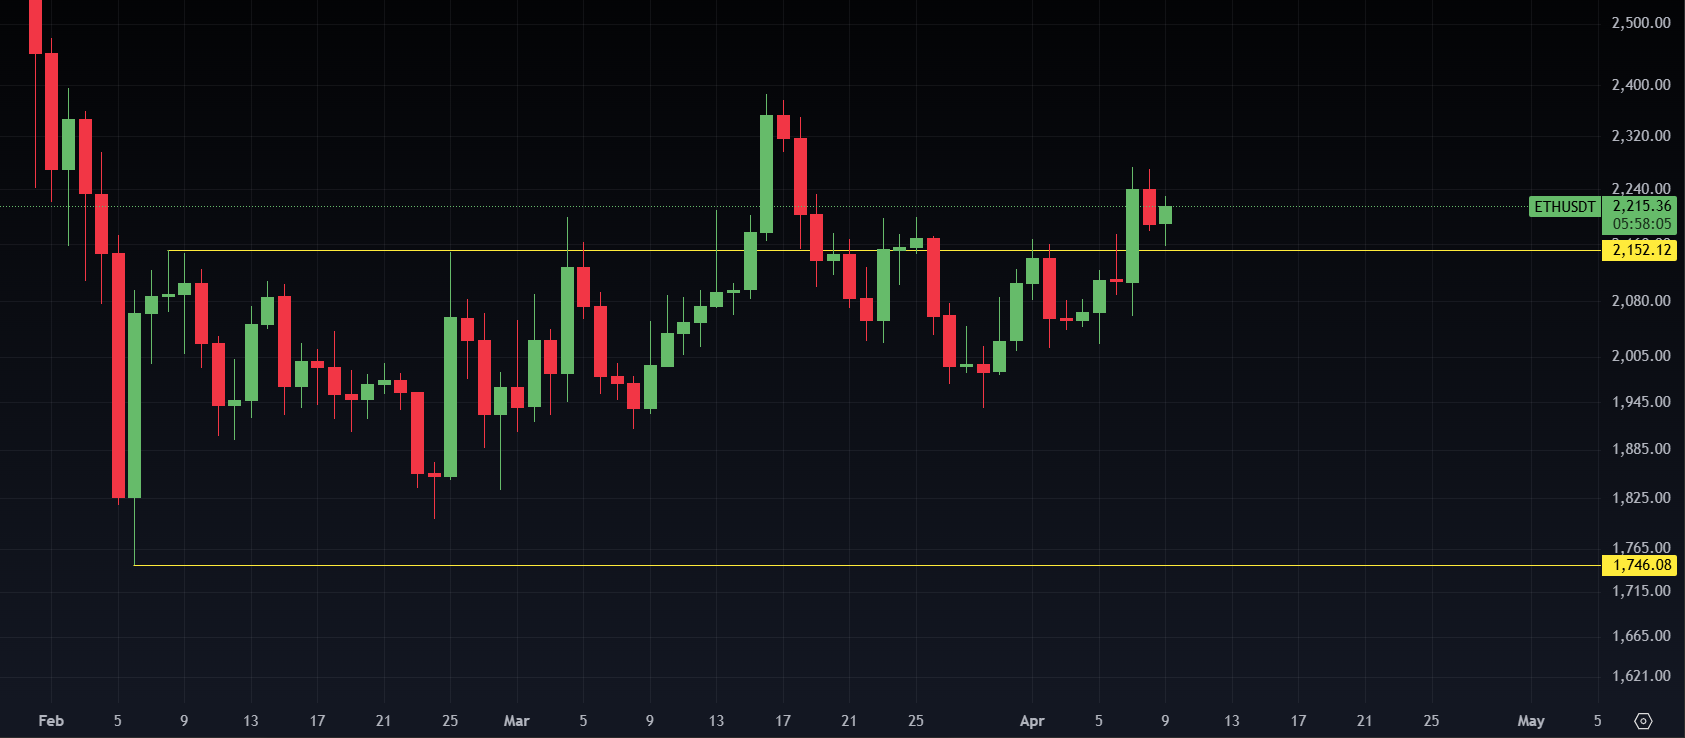
The second argument comes from the ETHUSDT chart. Like bitcoin, ether has been mostly moving sideways since early February. But where bitcoin is struggling to break out above its trading range of $72,000, ether appears to be slowly finding acceptance above its range.
A lot obviously depends on how the Middle East conflict unfolds. However, should the crypto market move higher in the coming weeks, it would mean that ether — a few weeks later than expected — may finally step out of bitcoin's shadow.
4️⃣ Rising risk appetite as volatility declines?
Thom
Calm appears to be cautiously returning to the world. Cautiously, because as I write this, reports are still coming in casting doubt on the durability of the ceasefire between the US and Iran. Let's hope it holds. That would not only be great geopolitical news but also positive for bitcoin and the broader financial markets.
For now, we're at least seeing some encouraging signals. With a bit more calm restored, volatility across various asset classes is declining. Take, for example, the volatility in the US Treasury market (MOVE).
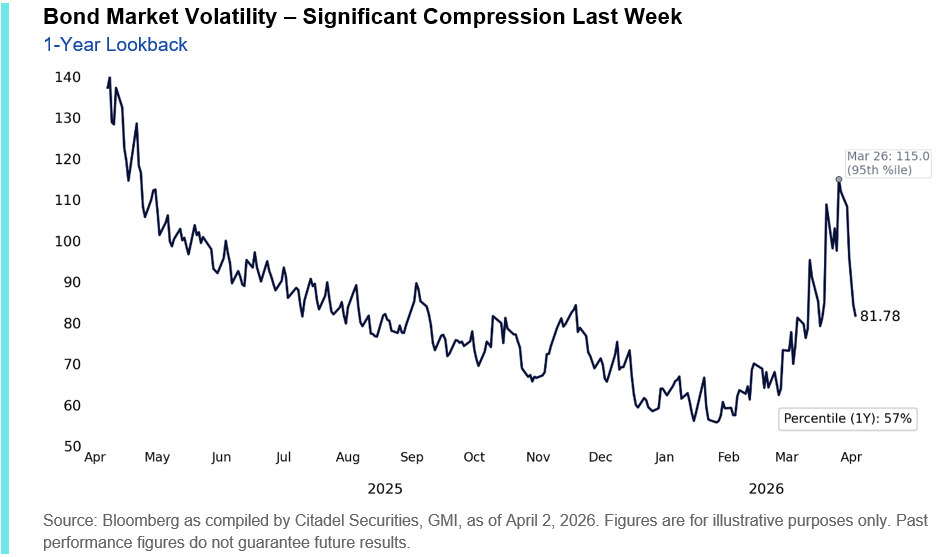
To a lesser extent, we see a similar pattern in equities (VIX) and energy markets (OVX). The decline in volatility is an important signal, because it's a prerequisite for investors to start taking on additional risk again.
Calm and stability give investors a bit more certainty and confidence to invest. Although at the time of writing, there still appears to be significant disagreement in the Middle East — particularly regarding the scope of the ceasefire.
In that respect, it remains to be seen to what extent the volatility indicators can normalize.
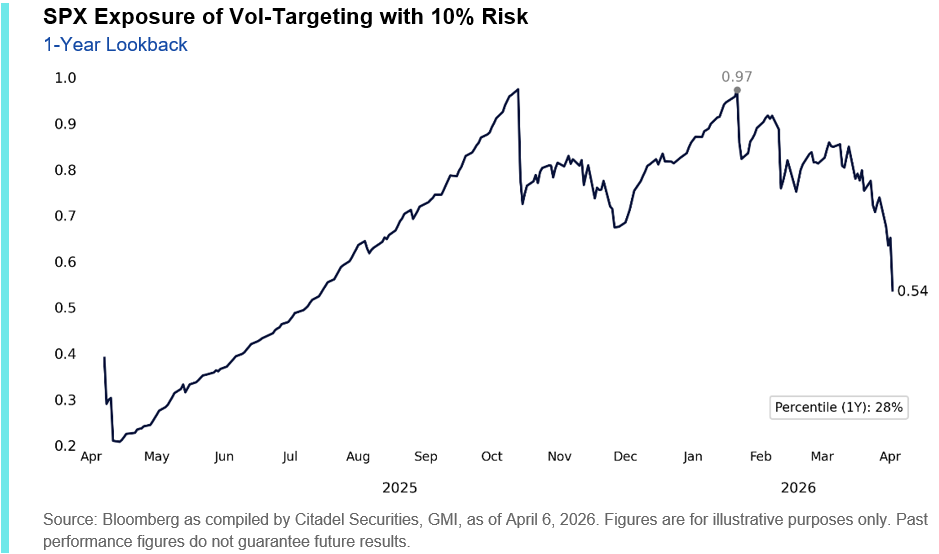
For now, part of the market — for example, funds that systematically invest based on expected volatility — still appears to have relatively low exposure to risk assets. That comes through clearly in the chart below. Combined with improving market conditions, this points to room for a fresh wave of capital inflows.
5️⃣ Economic data remains encouraging for bitcoin
Thom
Although the Iran war continues to cast a long shadow of uncertainty over the market, the macroeconomic picture for bitcoin remains fundamentally constructive. Granted, a significant part of that hinges on how the conflict plays out from here. And on that front, this week appears to have seen serious progress.
It remains to be seen whether the ceasefire will hold, though both sides appear to prioritize keeping it intact.
If calm truly returns, the broader macroeconomic backdrop continues to support the scenario that bitcoin's $60,000 price in early February already marked the bear market bottom.
The Economic Surprise Index for the United States currently sits well above zero. That means incoming economic data is generally coming in better than expected.
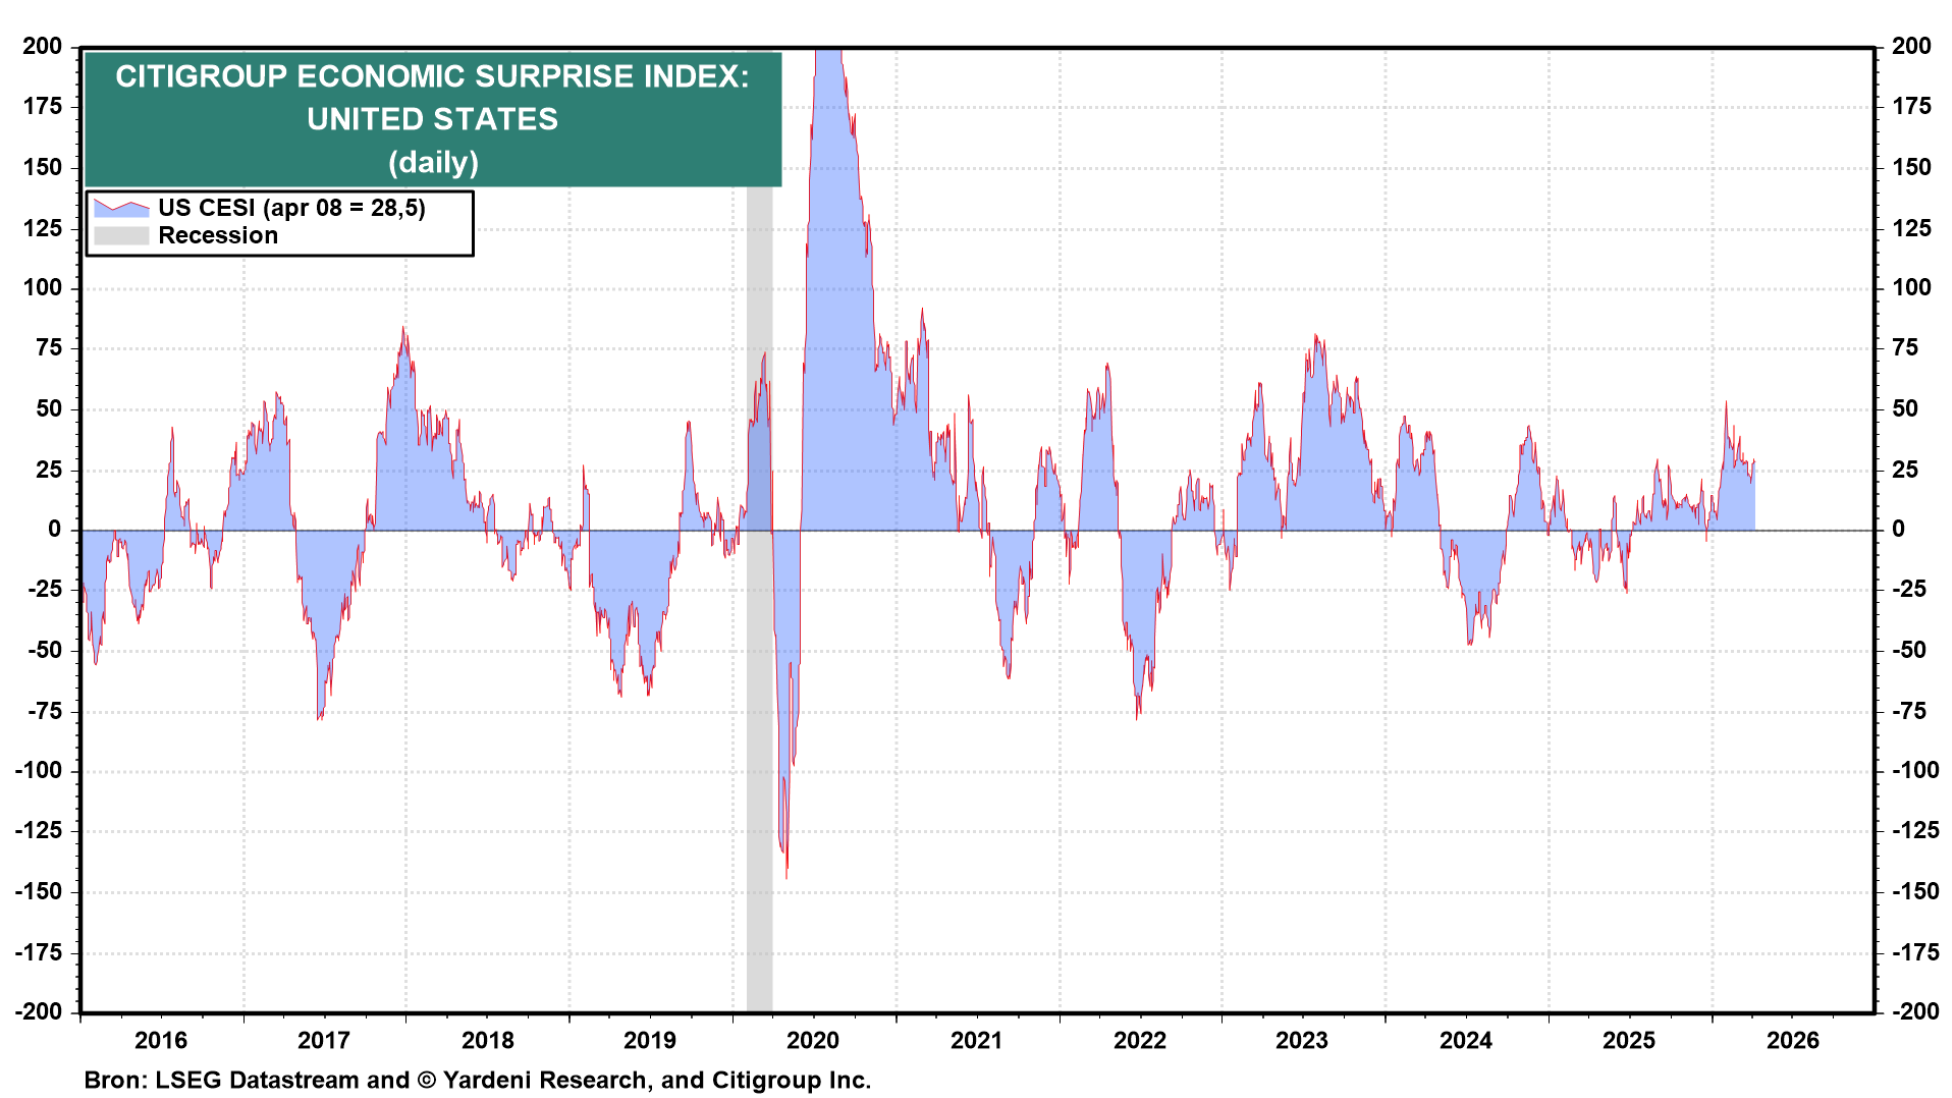
March job growth, for example, came in much stronger than expected. Analysts had forecast 59,000 new jobs, but the actual figure was 178,000. With those numbers, both the 3-month and 6-month averages of job growth jumped off the zero line.
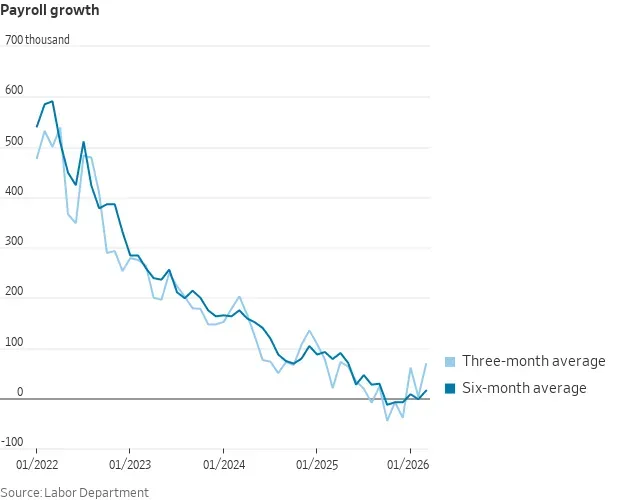
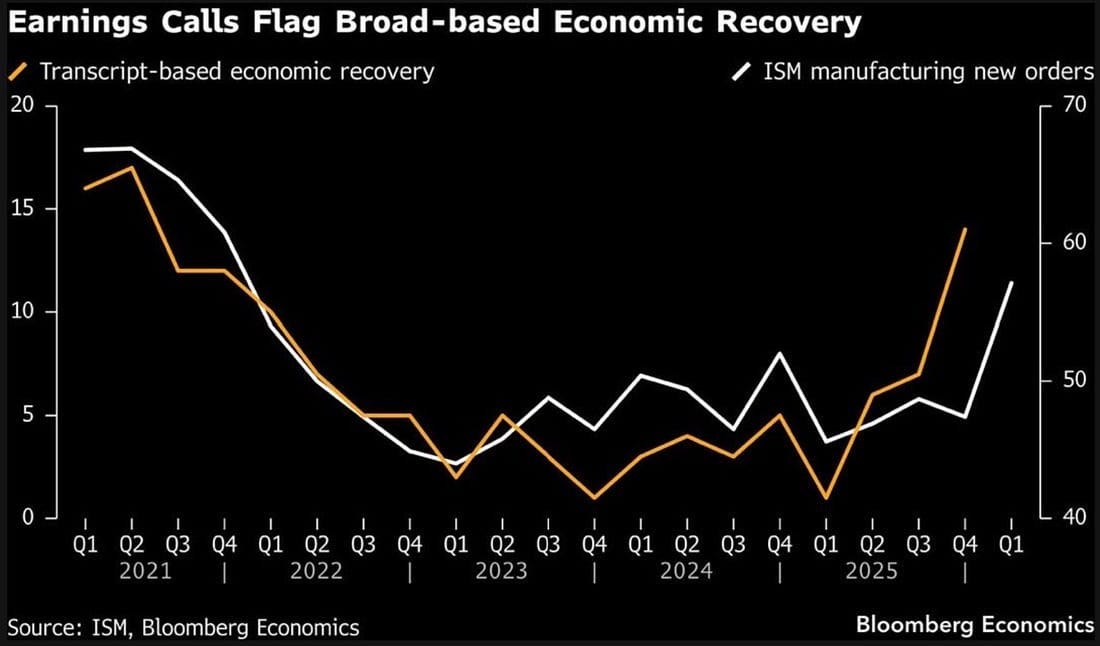
While one strong print doesn't warrant firm conclusions, these are encouraging signals for the US labor market. That positive picture is further reinforced by the sharp increase in new orders for US manufacturing.
That indicator is trending upward, while an increasing number of S&P 500 companies have been referencing economic recovery during their earnings calls.
It's important to note, however, that these figures predate the Iran war. Should the situation there escalate further, these encouraging numbers obviously carry less weight. But if calm returns for good, they form a solid foundation for the economy and financial markets.
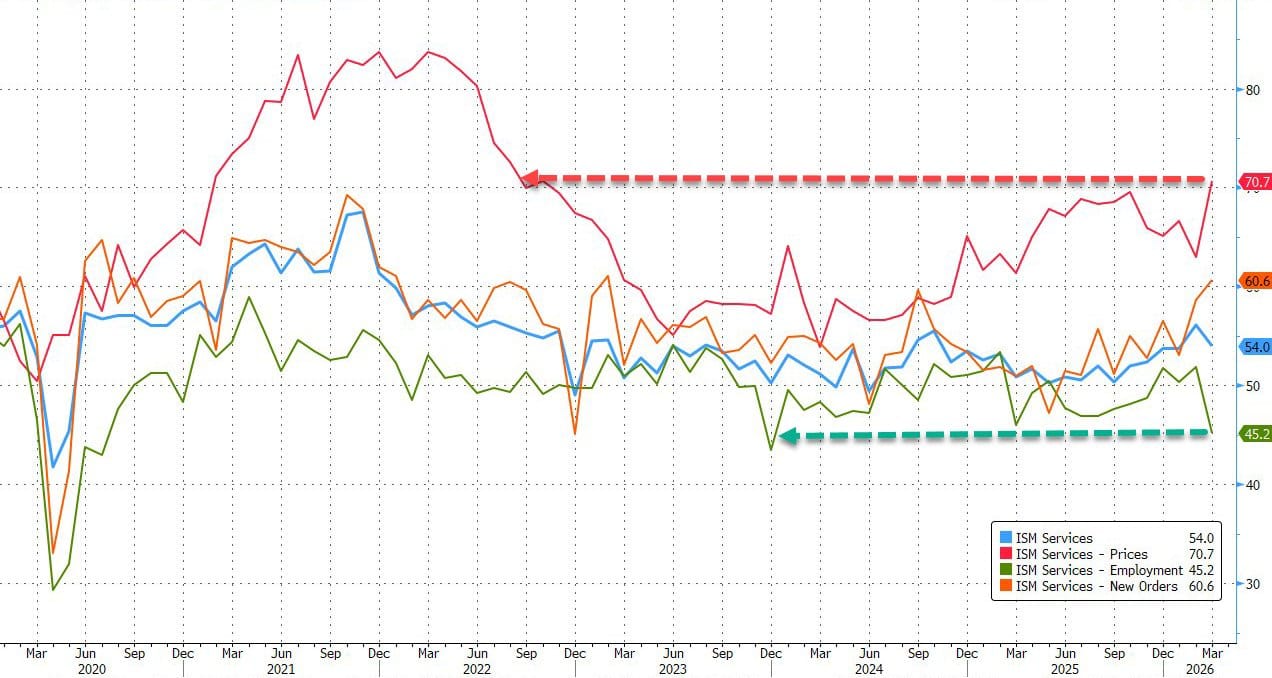
From the ISM Services survey — which covers more than 70% of US gross domestic product (GDP) — a more concerning reading came in this week.
The "prices paid" category clearly reflected the inflationary pressure from the war, surging to 70.7 points — its highest level since 2022. At the same time, the "employment" component dropped to its lowest level since 2023.
These figures make clear that the relatively rosy picture of the moment can shift quickly. In that sense, for the global economy, bitcoin, and financial markets as a whole, it's to be hoped that calm returns soon — so that the relatively strong economic foundation remains intact and can prove its worth.
In closing
All previous editions of Alpha Markets can be found in the archive. Questions, comments, and suggestions are always welcome in the community.
Thank you for reading!
To stay informed about the latest market developments and insights, follow our team members on X:
- Bart Mol (@Bart_Mol)
- Peter Slagter (@pesla)
- Bert Slagter (@bslagter)
- Mike Lelieveld (@mlelieveld)
We appreciate your continued support and look forward to bringing you more comprehensive analysis in our next edition.
Until then!