Bitcoin as a Safe Haven?
Bitcoin's price stays remarkably strong as the Iran war escalates. Is this the definitive proof that bitcoin is a safe haven — or is the narrative getting ahead of itself?
Bitcoin Surprises as Oasis of Calm While Iran War Jolts Markets — Bloomberg
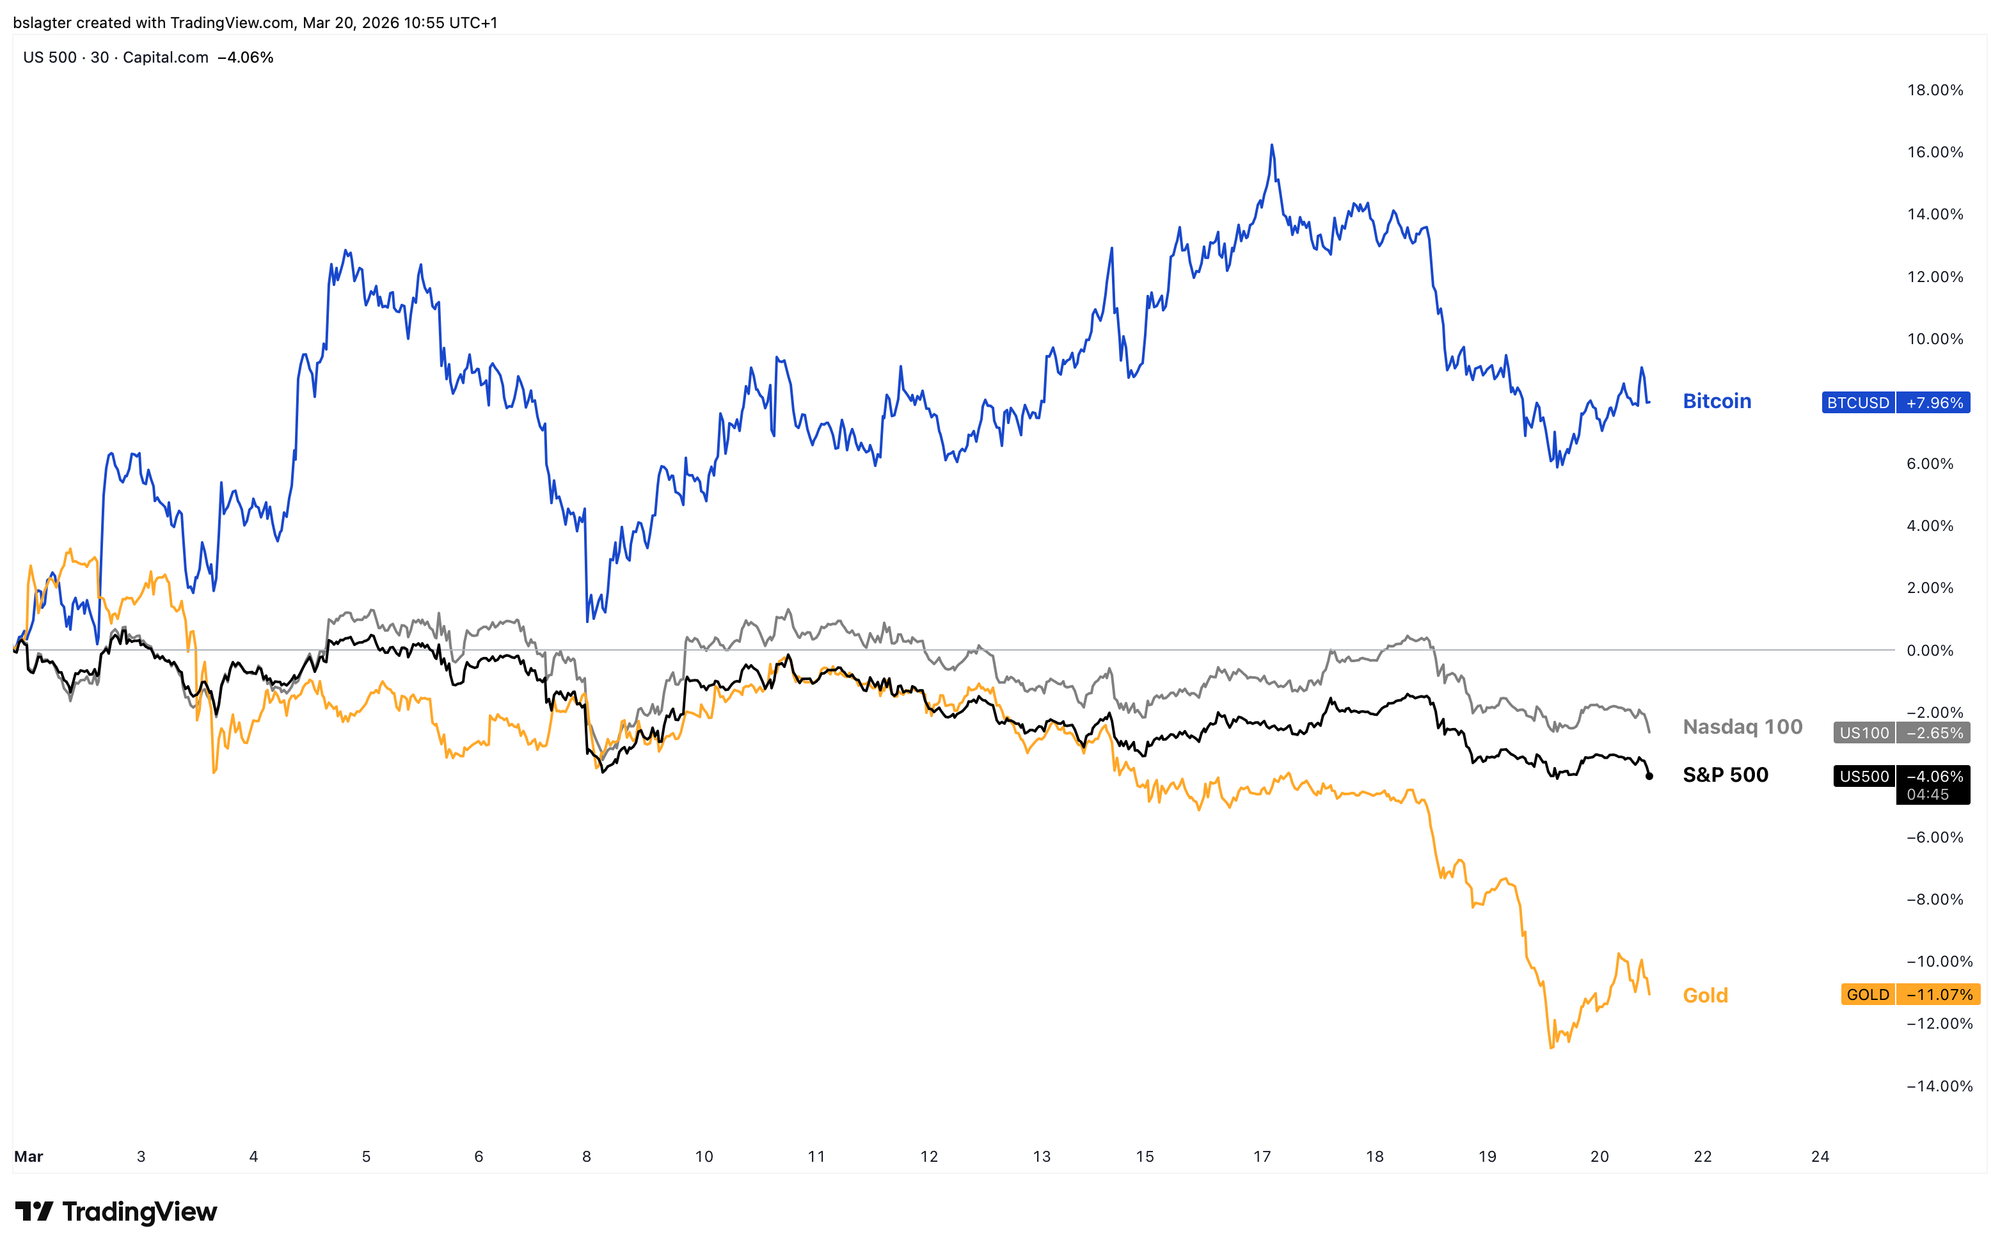
Bitcoin is surprising both enthusiasts and skeptics by outperforming stocks and gold during an escalating war in Iran. Since the first attack on February 28, the bitcoin price has risen roughly 8%, while the major US stock index S&P 500 dropped 4%, and gold fell by as much as 11%.
Some analysts see this as proof that bitcoin is a safe haven that comes into its own during geopolitical turmoil. Like gold, bitcoin has a certain degree of neutrality and independence.
China and America, Russia and Ukraine, Iran and Israel — all of them have some gold in their central bank vaults. They don't depend on each other or on any central party for that. Gold is gold. Atomic number 79, enforced by the laws of physics.
Bitcoin has the potential to fulfill the same role. Bitcoin was designed for a situation where different players can't fully trust each other. Nobody is in charge, nobody can unilaterally change the rules, nobody can print unlimited amounts of it.
What's more, it's easy to carry with you. Try putting a kilo of gold in your backpack and boarding a plane.
Gautam Chhugani, analyst at US investment bank Bernstein, put it this way in a note to his clients: "Maybe it takes a physical conflict to realize that bitcoin is the most portable (cross-border), digital and liquid asset, without counterparty risk."
Is bitcoin's relative strength indeed evidence of global acceptance of bitcoin as digital gold?
Yes and no.
Bitcoin as digital gold is often linked to bitcoin as a safe haven. For example, the Dutch financial newspaper Het Financieele Dagblad ran an article titled "Bitcoin remarkably stable since start of Iran war, but still far from a safe haven."
Let's take a closer look at the concept of 'safe haven.' It's used in two very different ways:
- There's an acute crisis and investors want to reduce the risk profile of their portfolio as quickly as possible. They sell everything that can be sold quickly. They flee to cash and short-term government bonds. Dollars, euros, Swiss francs, kronor.
- There's uncertainty about the survival of the current system, the current geopolitical order, or the current government currency. Investors seek assets that would survive such a change. Gold has traditionally played a role here, but really all 'scarce assets,' 'real assets,' and 'outside moneys' qualify.
These operate on two completely different timescales. The first meaning of safe haven is about hours and days. Think of the COVID crash in March 2020, when practically all investments plummeted in value simultaneously — including gold and bitcoin.
The second meaning spans decades, and should be evaluated on that timescale. Whether bitcoin structurally provides protection during times of geopolitical turmoil remains to be seen in the years ahead. Two weeks of relative strength is not definitive proof of that.
At the same time, it is another data point. In the first weeks of the war in Ukraine, bitcoin also performed well, and we heard stories about bitcoin being used to move money in and out of the war zone, on both sides of the front lines.
Another example is the crisis at US regional banks in 2023. When Silicon Valley Bank collapsed, bitcoin jumped and was discussed as an alternative.
It doesn't really matter what portion of the price increase can be attributed to households in the Middle East trying to safeguard some of their wealth. The thesis of bitcoin as digital gold has gained some additional weight.
Does the strong price prove bitcoin is digital gold? Yes, it's certainly a piece of evidence being added to the file. But no, it's not definitive proof that settles the case once and for all.
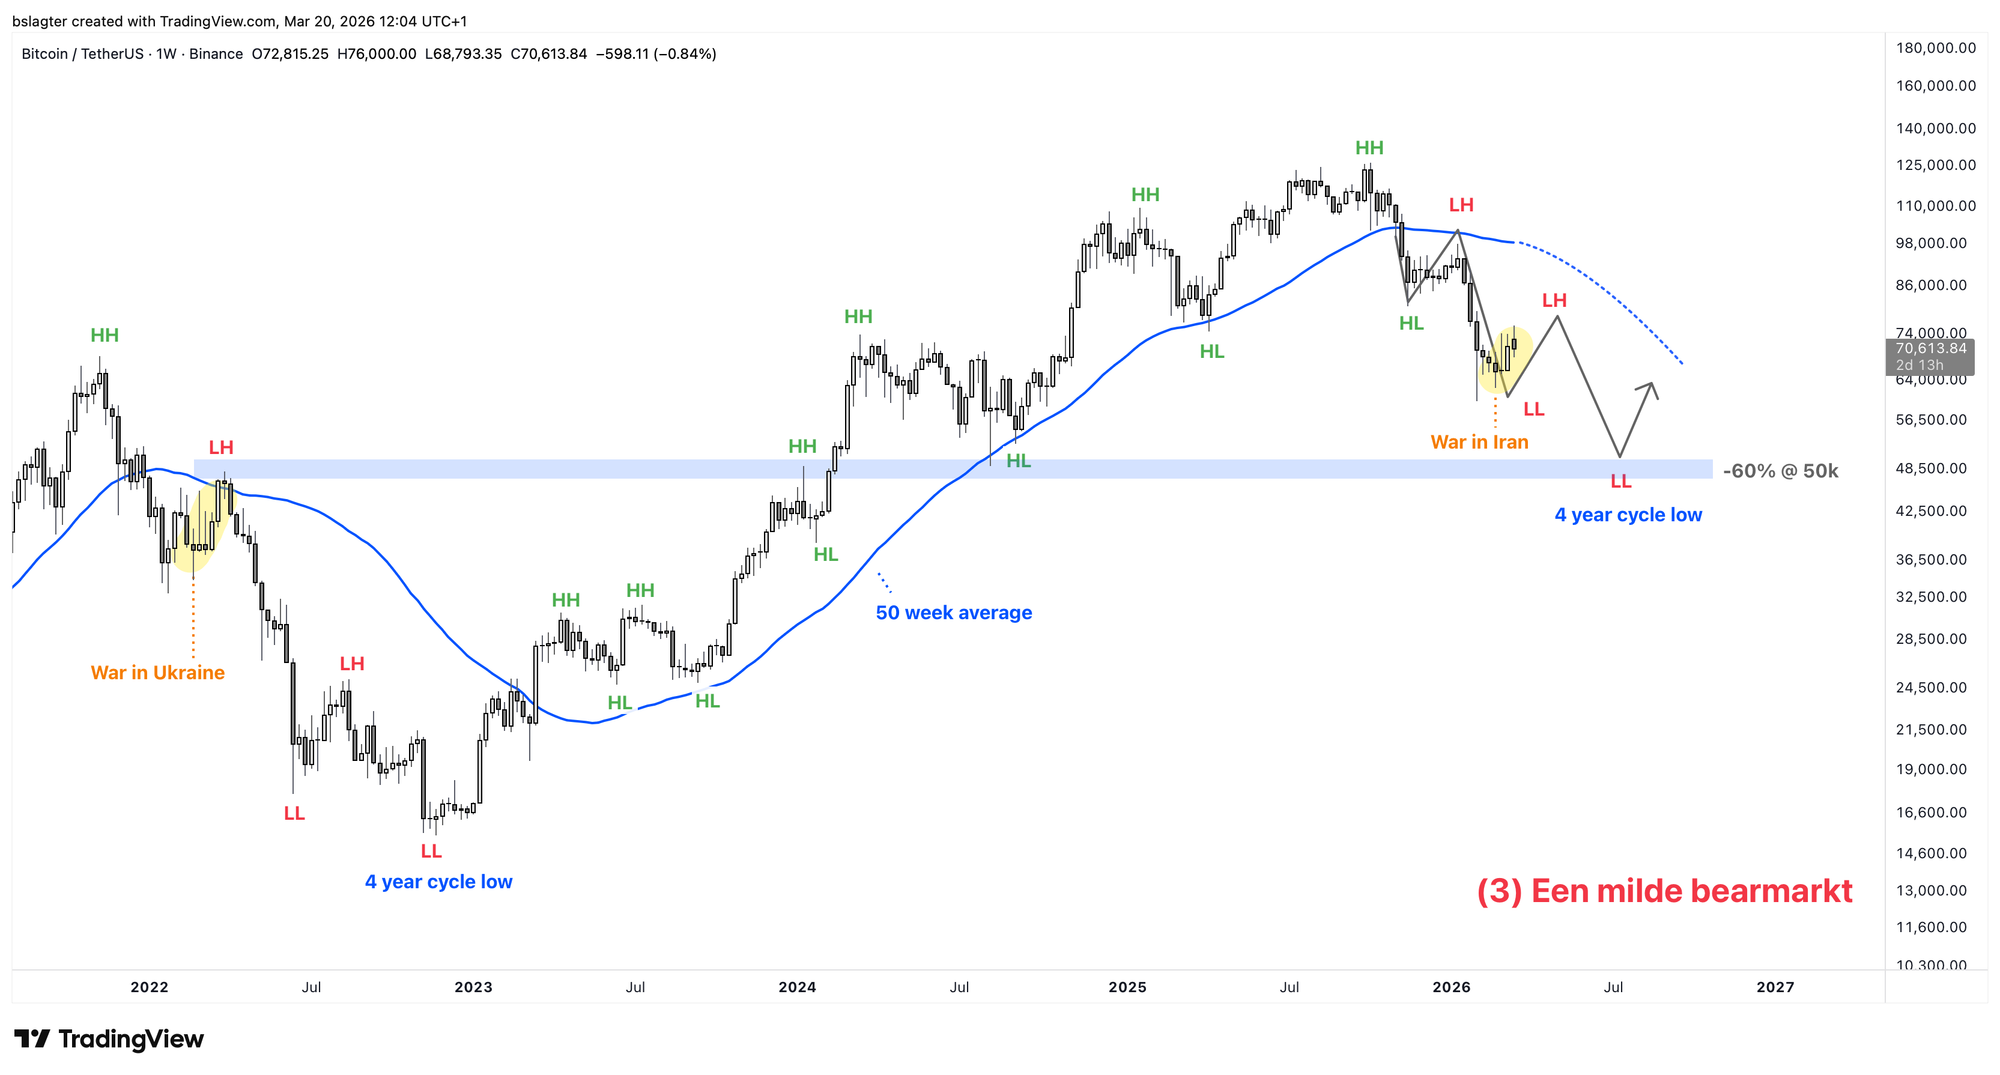
It also doesn't mean that the bear market is therefore over. A shock can accelerate or slow down the market cycle, but more often than not, it's nothing more than a temporary disruption.
Our base scenario remains that we're in a mild bear market, with the end of the second quarter as our first time target, and $48,000 to $60,000 as our price target.
The uncertainty about how the war will unfold is immense. A wide range of scenarios is plausible, from a robust and swift end to the war to further escalation into a prolonged global conflict. It's impossible to assign probabilities to these scenarios with any confidence.
That was also the takeaway from Jerome Powell, chairman of the Federal Reserve's rate-setting committee. He spoke to the press Wednesday evening about the meeting he had with his fellow committee members: "We just don't know."
Iran appears to hold the cards. One hundred dollars for a barrel of oil is the threshold — above that, it hurts. And Iran can easily make that happen by keeping Hormuz shut and occasionally firing a few missiles at infrastructure in surrounding countries.
Financial markets are hanging by a thread. Government bond yields are rising sharply. Stock prices are threatening to lose their uptrends. The Magnificent Seven are at their lowest point since August 2025. There isn't much time left to end this war with limited damage.
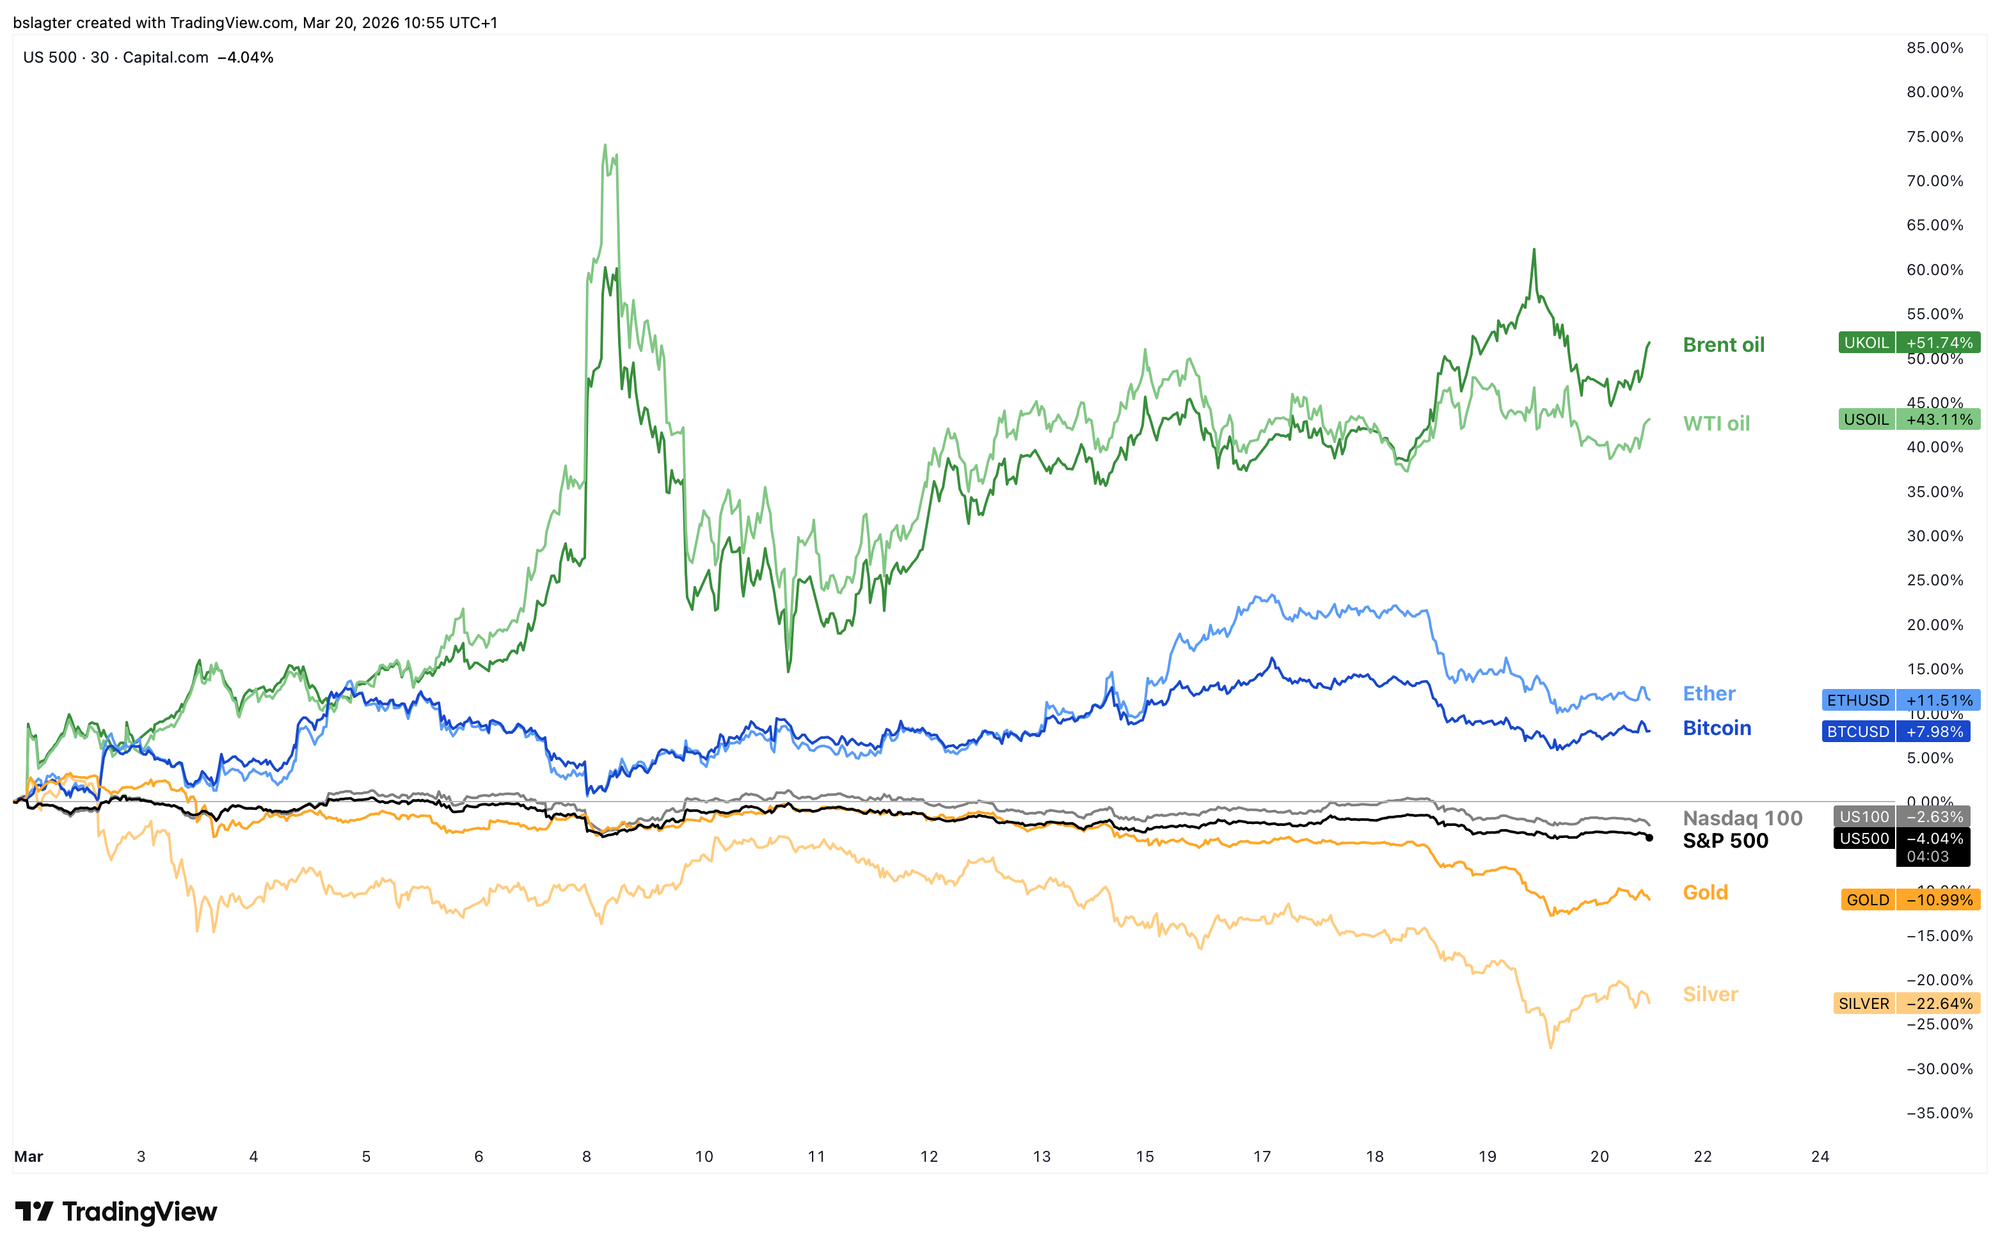
In the chart below, we've added some assets to the first chart of this Markets edition. Silver underperformed gold. Ether outperformed bitcoin. And oil is the clear winner.
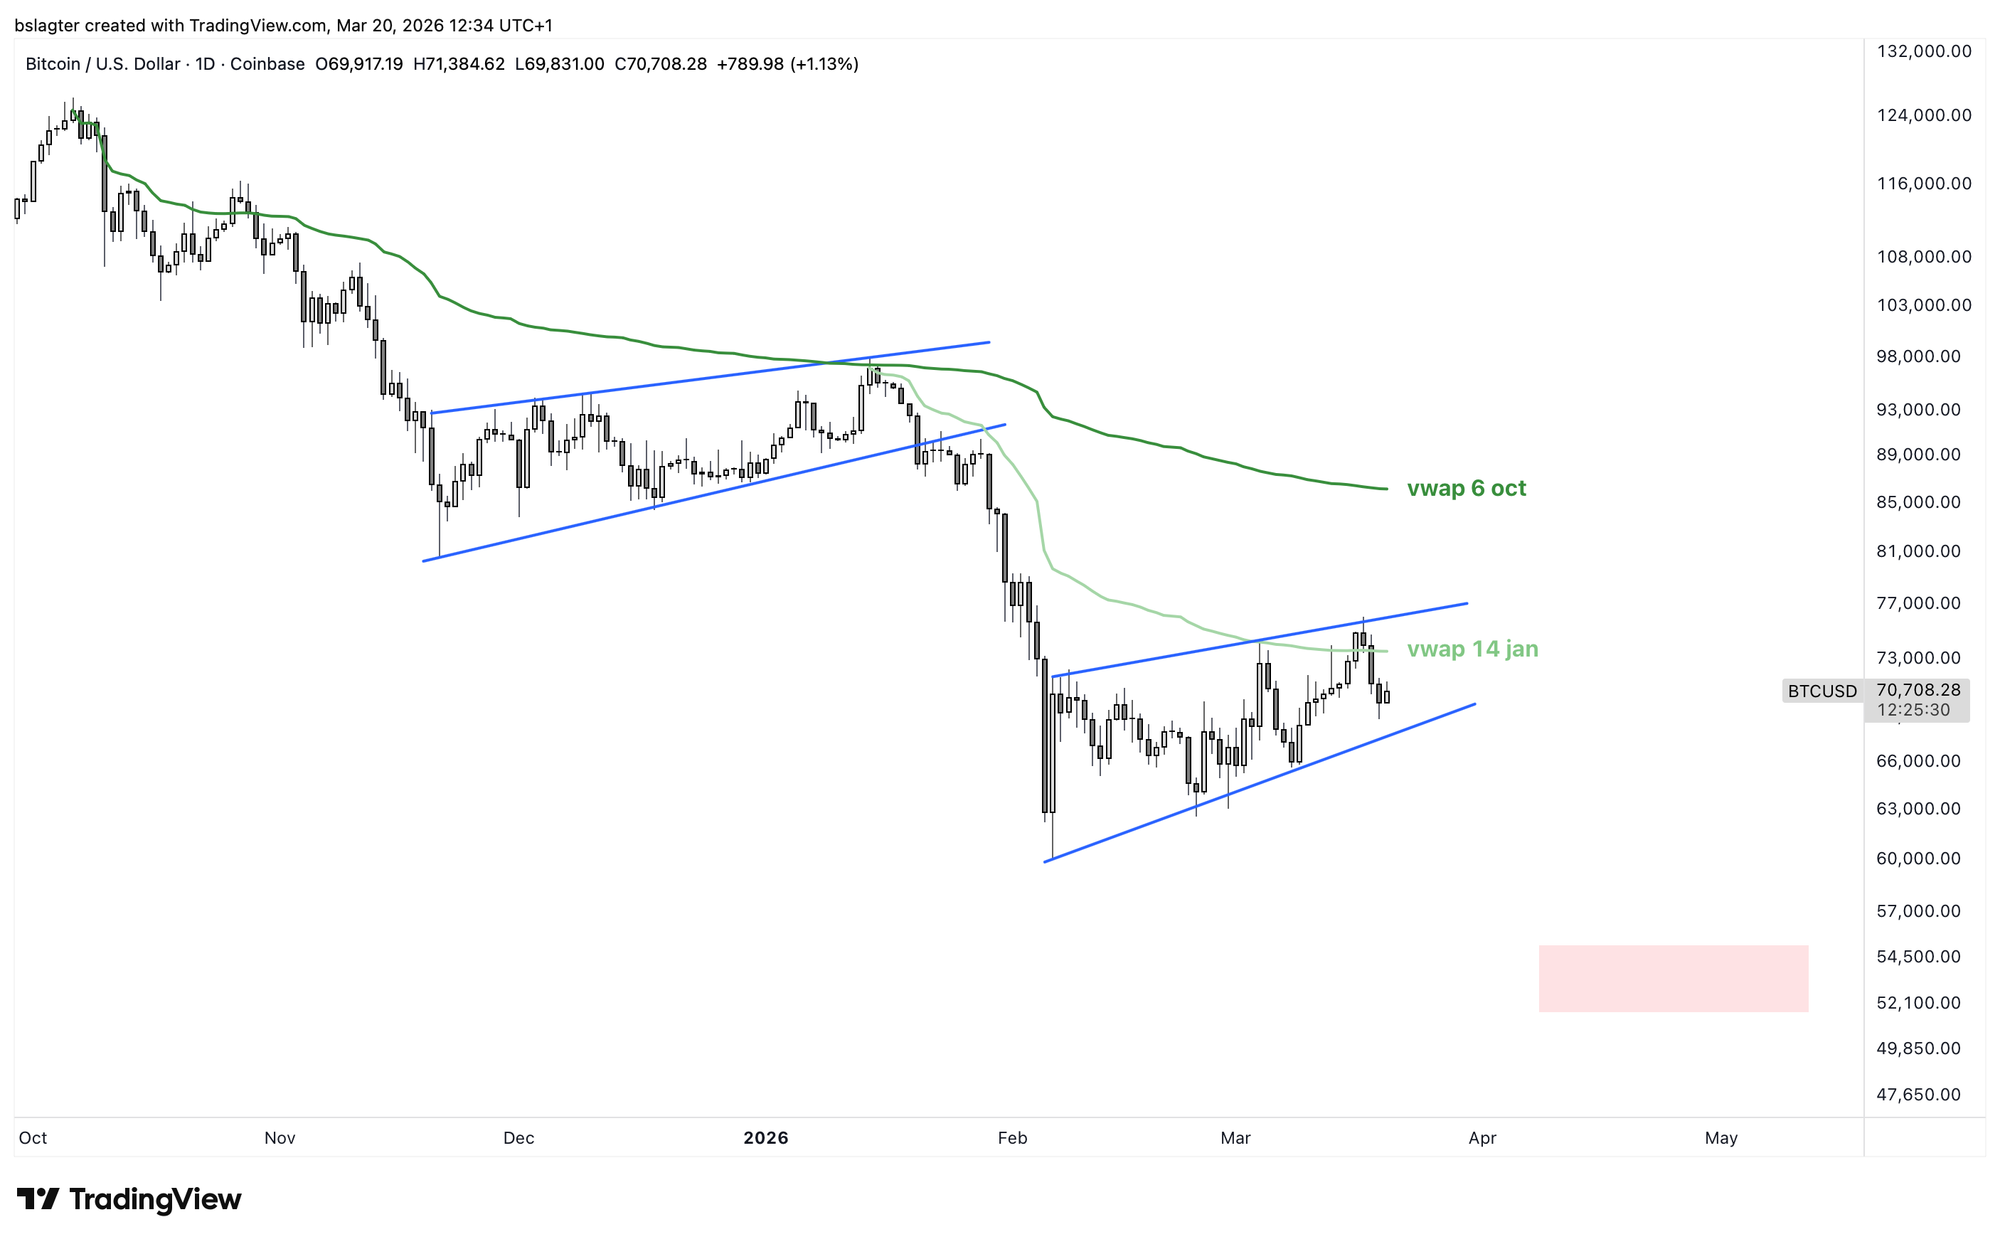
In the short term, many analysts are looking at a chart similar to the one below. The decline from the top on October 6 is interrupted by two periods of consolidation. The volume-weighted average price (VWAP) of the decline forms the upper boundary.
Aksel Kibar is an expert in pattern-based technical analysis. He notes on X a price target of $52,500 if this pattern breaks down:
Breakdown of the lower boundary will be the signal for a possible move towards 52.5K.
When practically everyone is watching the same chart, things can play out very differently. There are also notable differences between the two 'rising wedges.' For instance, speculators back then were positioned for a quick recovery, whereas now they're positioned for further decline.
One possibility is that we do break out of the pattern, but don't actually see (much) lower prices. This could create bullish divergence on the 3-day chart and the weekly chart, fueling confidence that we don't need to go much lower.
Shocks from the war in Iran are by far the strongest force at play right now. The predictive value of shorter-term analysis is therefore lower than in calmer times. If you're trading in these conditions, pay extra close attention to your risk management.
To enter, you need to join Bitvavo's broadcast channel on Instagram and fill out the form posted there. Of course, the Bitcoin Alpha team will also be in attendance at the matches.
Let's continue with the following topics:
- Bear market bottom: Bitcoin vs. gold
- Financial markets at a potential breaking point
- No help from the Federal Reserve
1️⃣ Bear market bottom: Bitcoin vs. gold
Bert
We usually look at the bitcoin price denominated in dollars. Just like gold and oil, the dollar is the universally accepted yardstick. Practically everyone watches the bitcoin-in-dollars chart, and everyone also knows that everyone else is watching the same chart.
Yet it's sometimes useful to use a different yardstick. To look at the ratio between two assets. For example, bitcoin and gold.
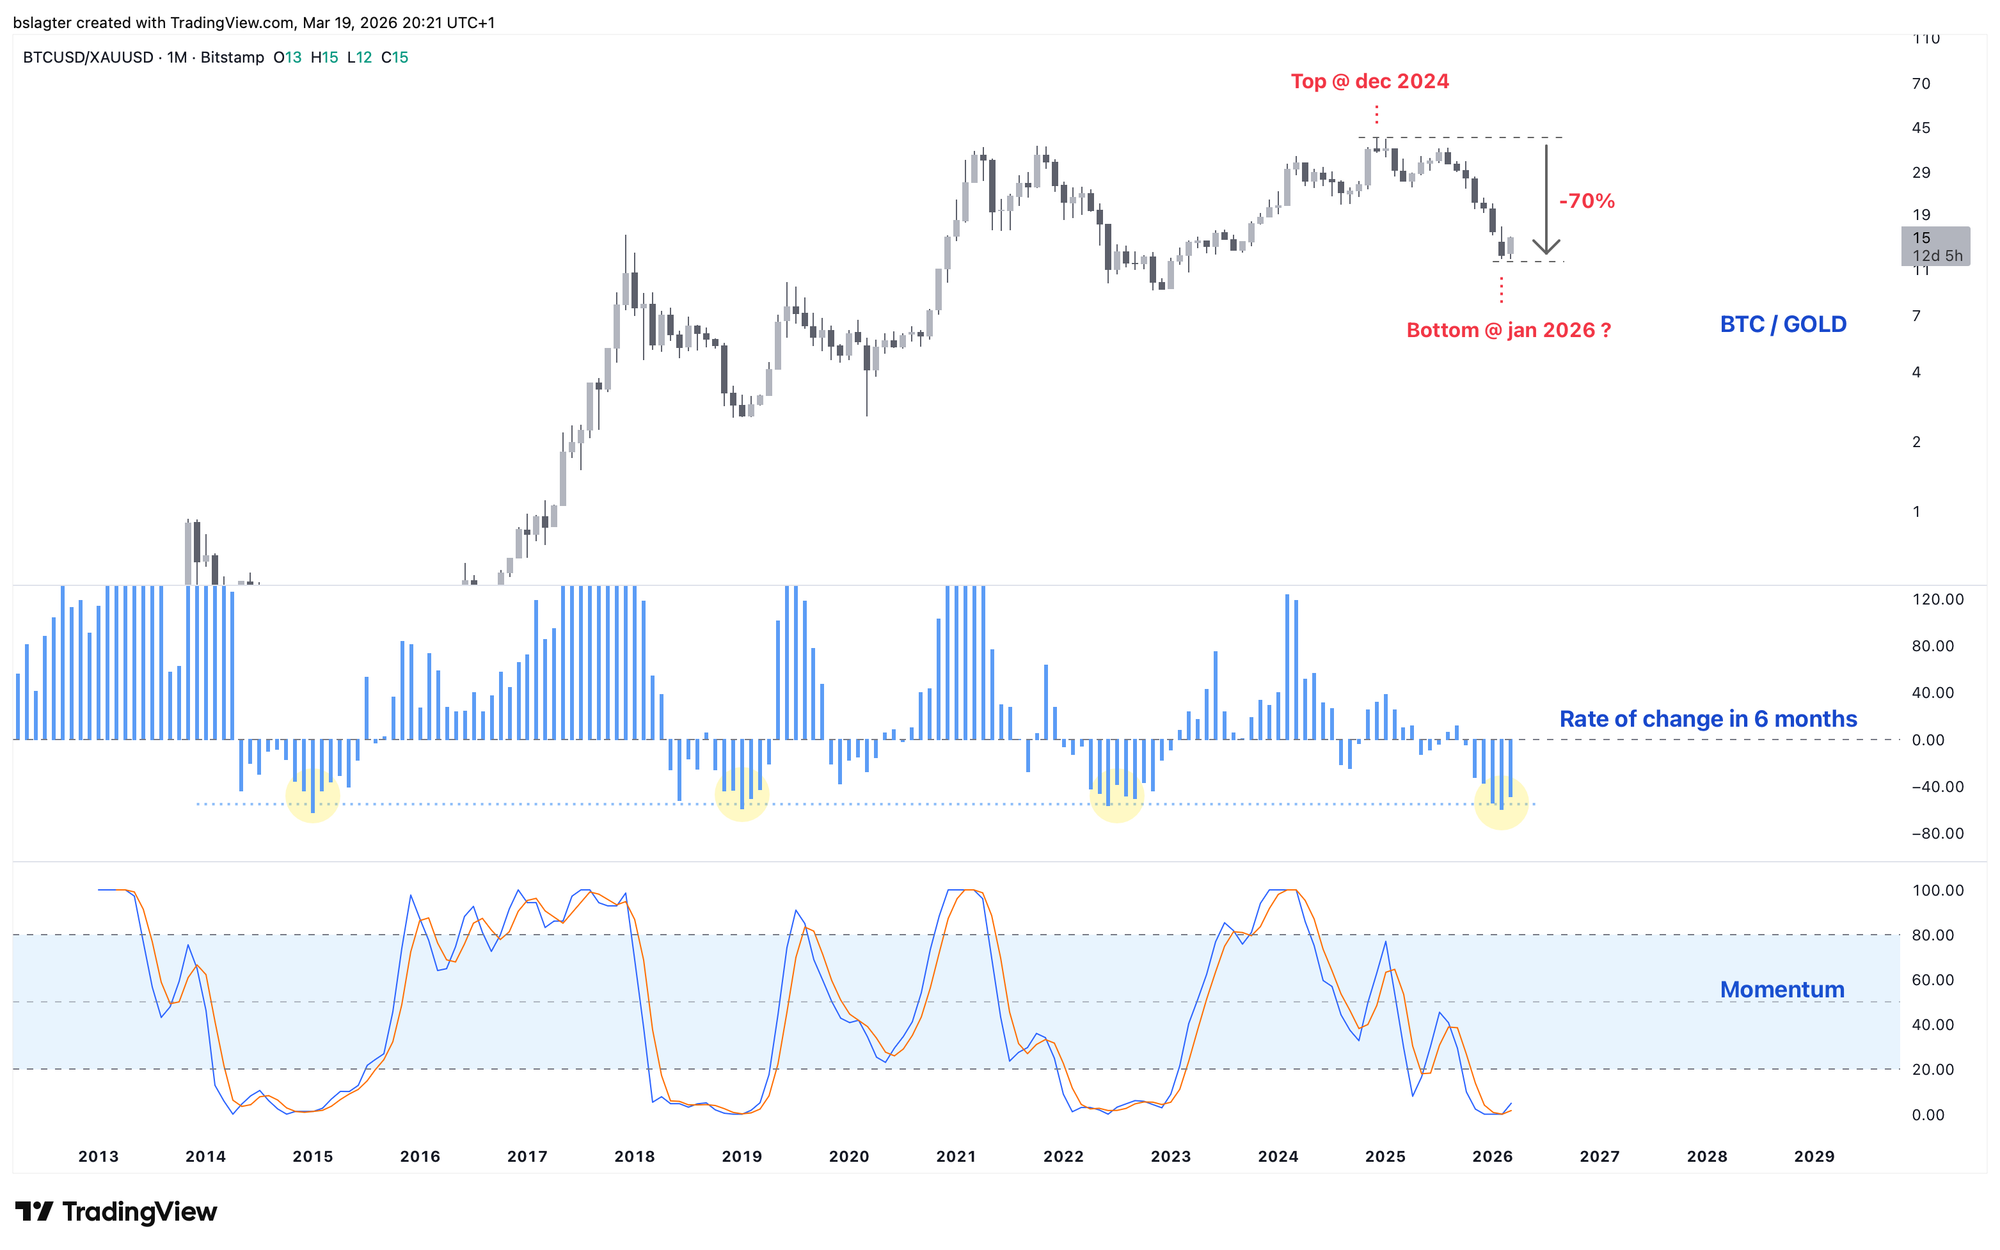
The chart below shows the bitcoin price denominated in gold. The y-axis shows the number of troy ounces of gold per bitcoin. In 2017, we crossed the 1 mark — at that point, 1 bitcoin cost the same as 1 ounce of gold. The peak was in December 2024 at 41 oz/btc and had dropped to 12 oz/btc last month. A decline of 70%.
In 2025, bitcoin in dollar terms came in well above the December 2024 peak. That was $108,000 and the October 2025 top was $126,000. But because gold posted such a strong rally in 2025, the bitcoin/gold ratio was still lower.
Some analysts use this as an argument that bitcoin has actually been in a bear market since December 2024, and that January 2026 was likely the bottom.
That could well be the case. It would mean bitcoin in dollar terms might still dip slightly below $60,000 later this year, but would print a higher low when measured in gold. An interesting one to keep an eye on!
2️⃣ Financial markets at a potential breaking point
Thom
Although the major stock indices (and bitcoin) still look fairly solid given the current backdrop, a serious correction could be drawing closer. At the time of writing, the S&P 500 and Nasdaq 100 are still trading reasonably close to their all-time highs, while the world appears to be on fire.
While the gold price has already broken down, looking at the S&P 500 chart alone you wouldn't think a major recession could be looming.
In April 2025, during the peak of the tariff war, the S&P 500 came close to its 200-week exponential moving average, for example. Right now, that's nowhere near the case.
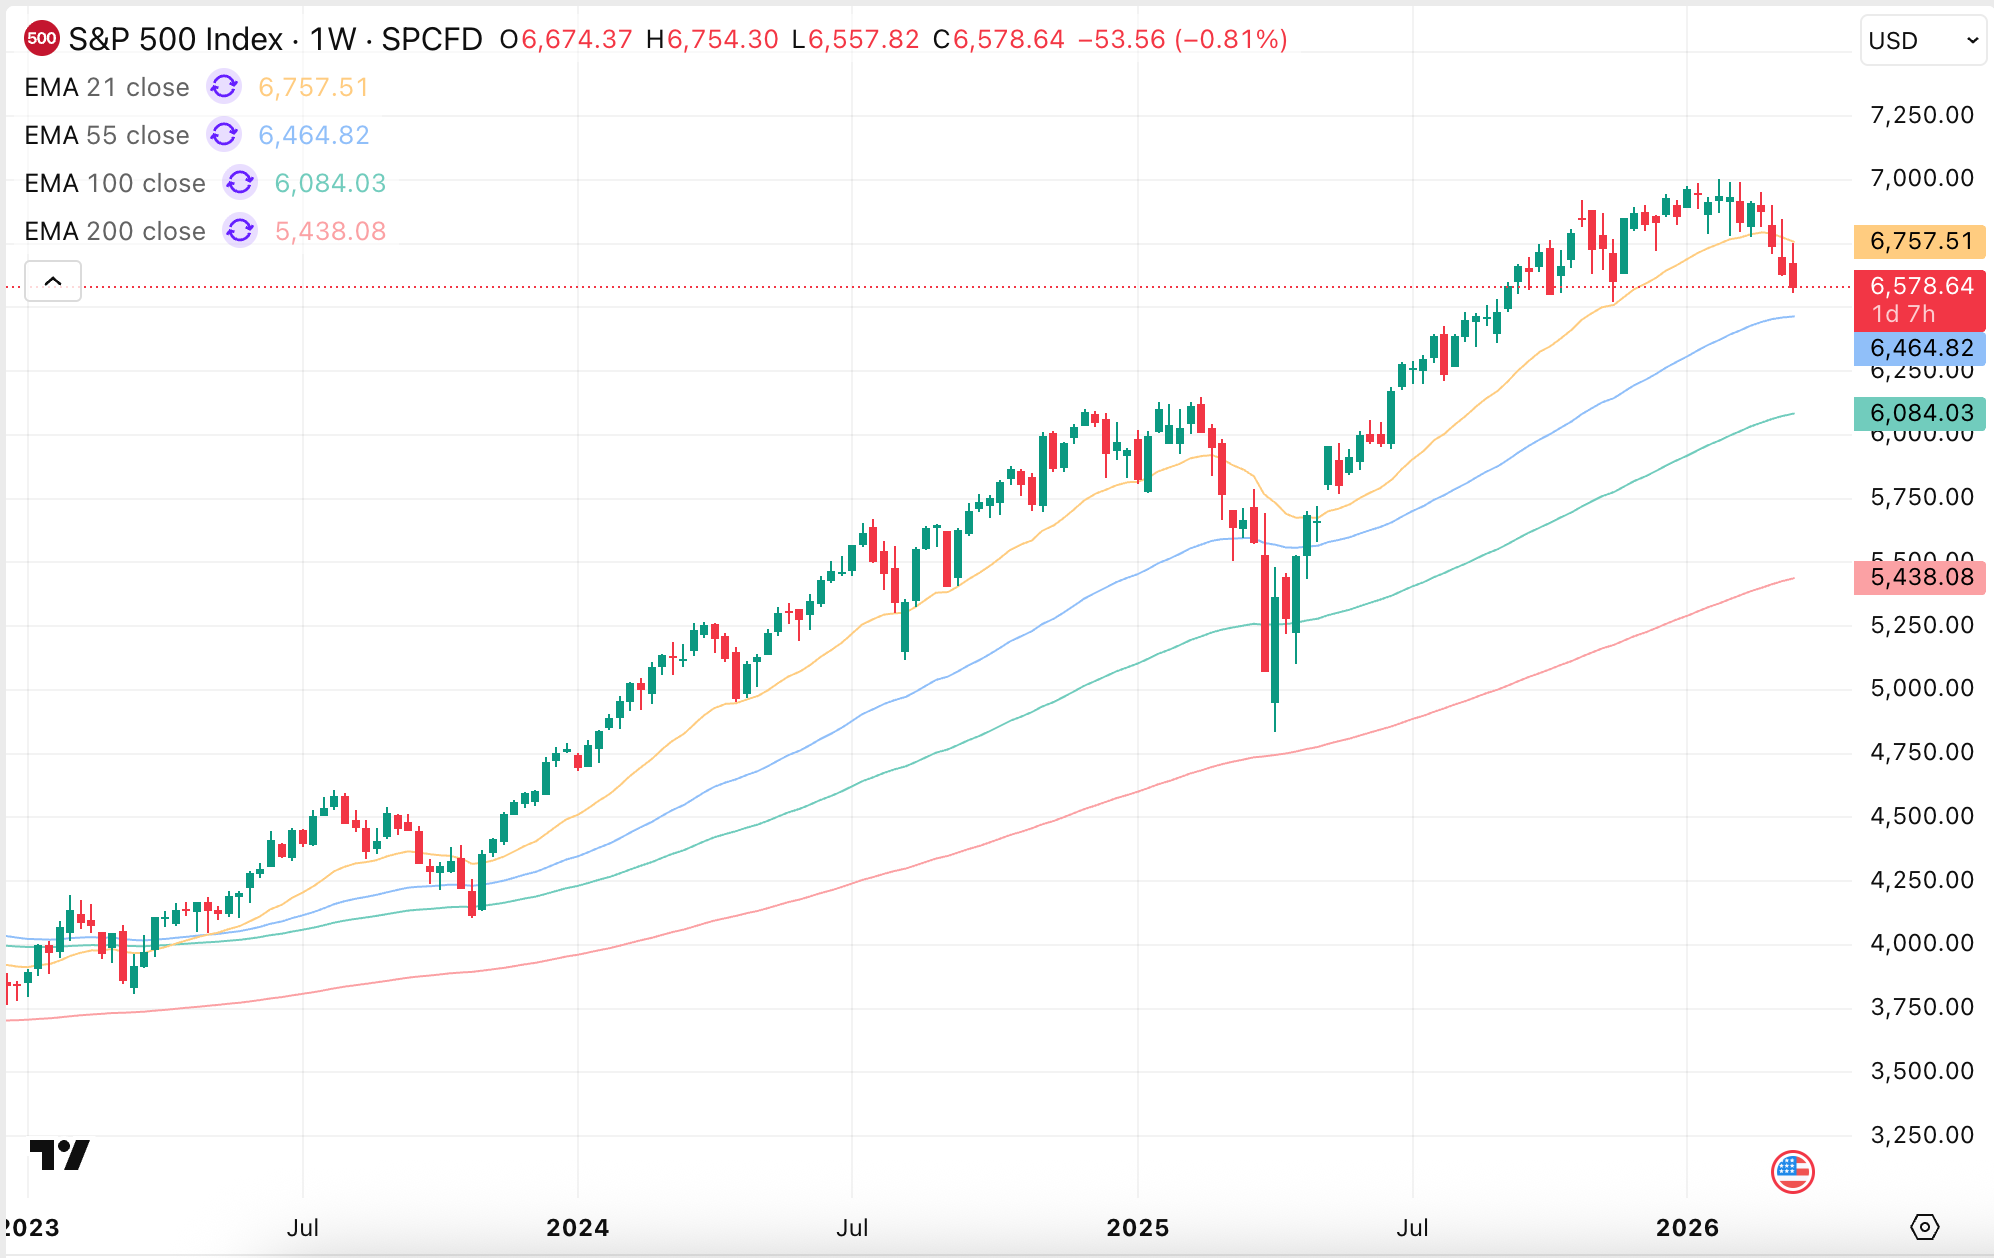
But the longer this situation persists, the greater the chance that a steep correction materializes. With the major stock indices, passive capital flows and sector rotations can still keep declines contained.
The fact that the gold price has already buckled under pressure suggests to me that under the hood, there are real liquidity problems. If this situation continues, I'd be surprised if we don't see a deeper crash in risk assets. In that scenario, bitcoin probably won't be spared either.
Knowing Donald Trump, however, that would also be the moment he ramps up pressure to its highest point. He now has every incentive to end the war as quickly as possible.
The problem is that Iran holds an asymmetric advantage. No matter how overwhelming US and Israeli military superiority may be, Tehran ultimately has the final say over what happens in the Strait of Hormuz.
For now, this doesn't paint a pretty picture for bitcoin. Everything could change quickly if a peace deal materializes, but at this point, that seems far off.
3️⃣ No help from the Federal Reserve
Thom
This week it also became clear that financial markets shouldn't count on help from the Federal Reserve any time soon. Investors already knew a rate cut was unlikely. The focus was therefore mainly on the Fed's overall message.
That message was clear: we're staying put for now, we see the oil risk, but we're in no rush to make a decision.
The dot plot doesn't tell us much more either. The median still shows one 25-basis-point cut for 2026 and another one in 2027. In that regard, expectations are unchanged from December.
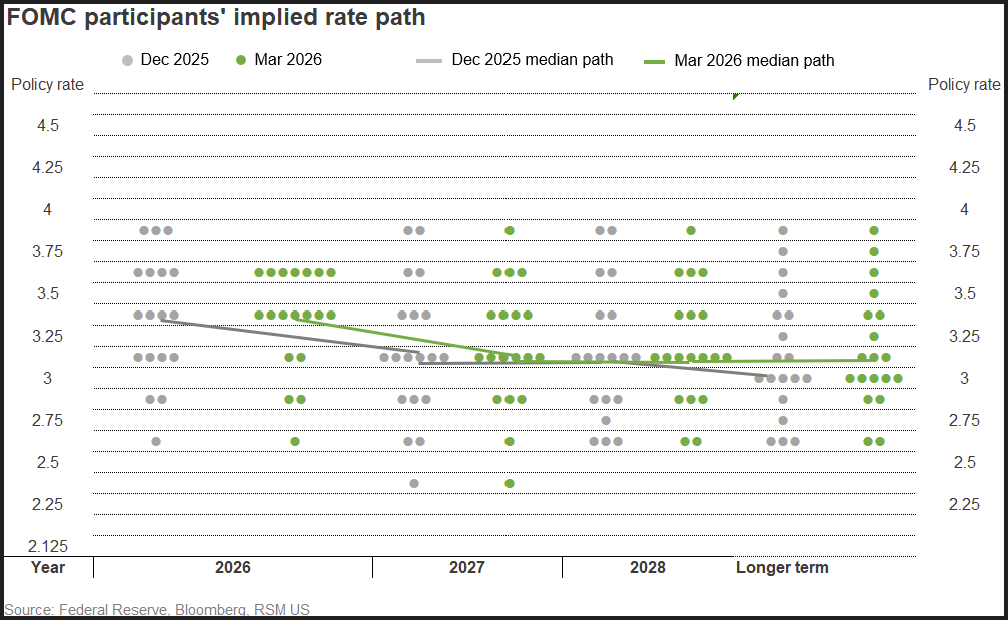
In my view, the dots mainly show that there's a great deal of uncertainty within the Fed's rate-setting committee itself. For the longer term, rate expectations range from roughly 2.5 to 4 percent. So even within the central bank, there are major disagreements about future inflation and economic growth.
It doesn't help that Donald Trump is losing his grip on the Iran conflict. While he deliberately spared Iran's oil infrastructure during the attack on Kharg Island, Israel decided to do the opposite at the South Pars gas fields.
For now, a de-escalation of the conflict — and with it a swift reopening of the Strait of Hormuz, which is what financial markets really care about — seems to be slipping further and further out of reach.
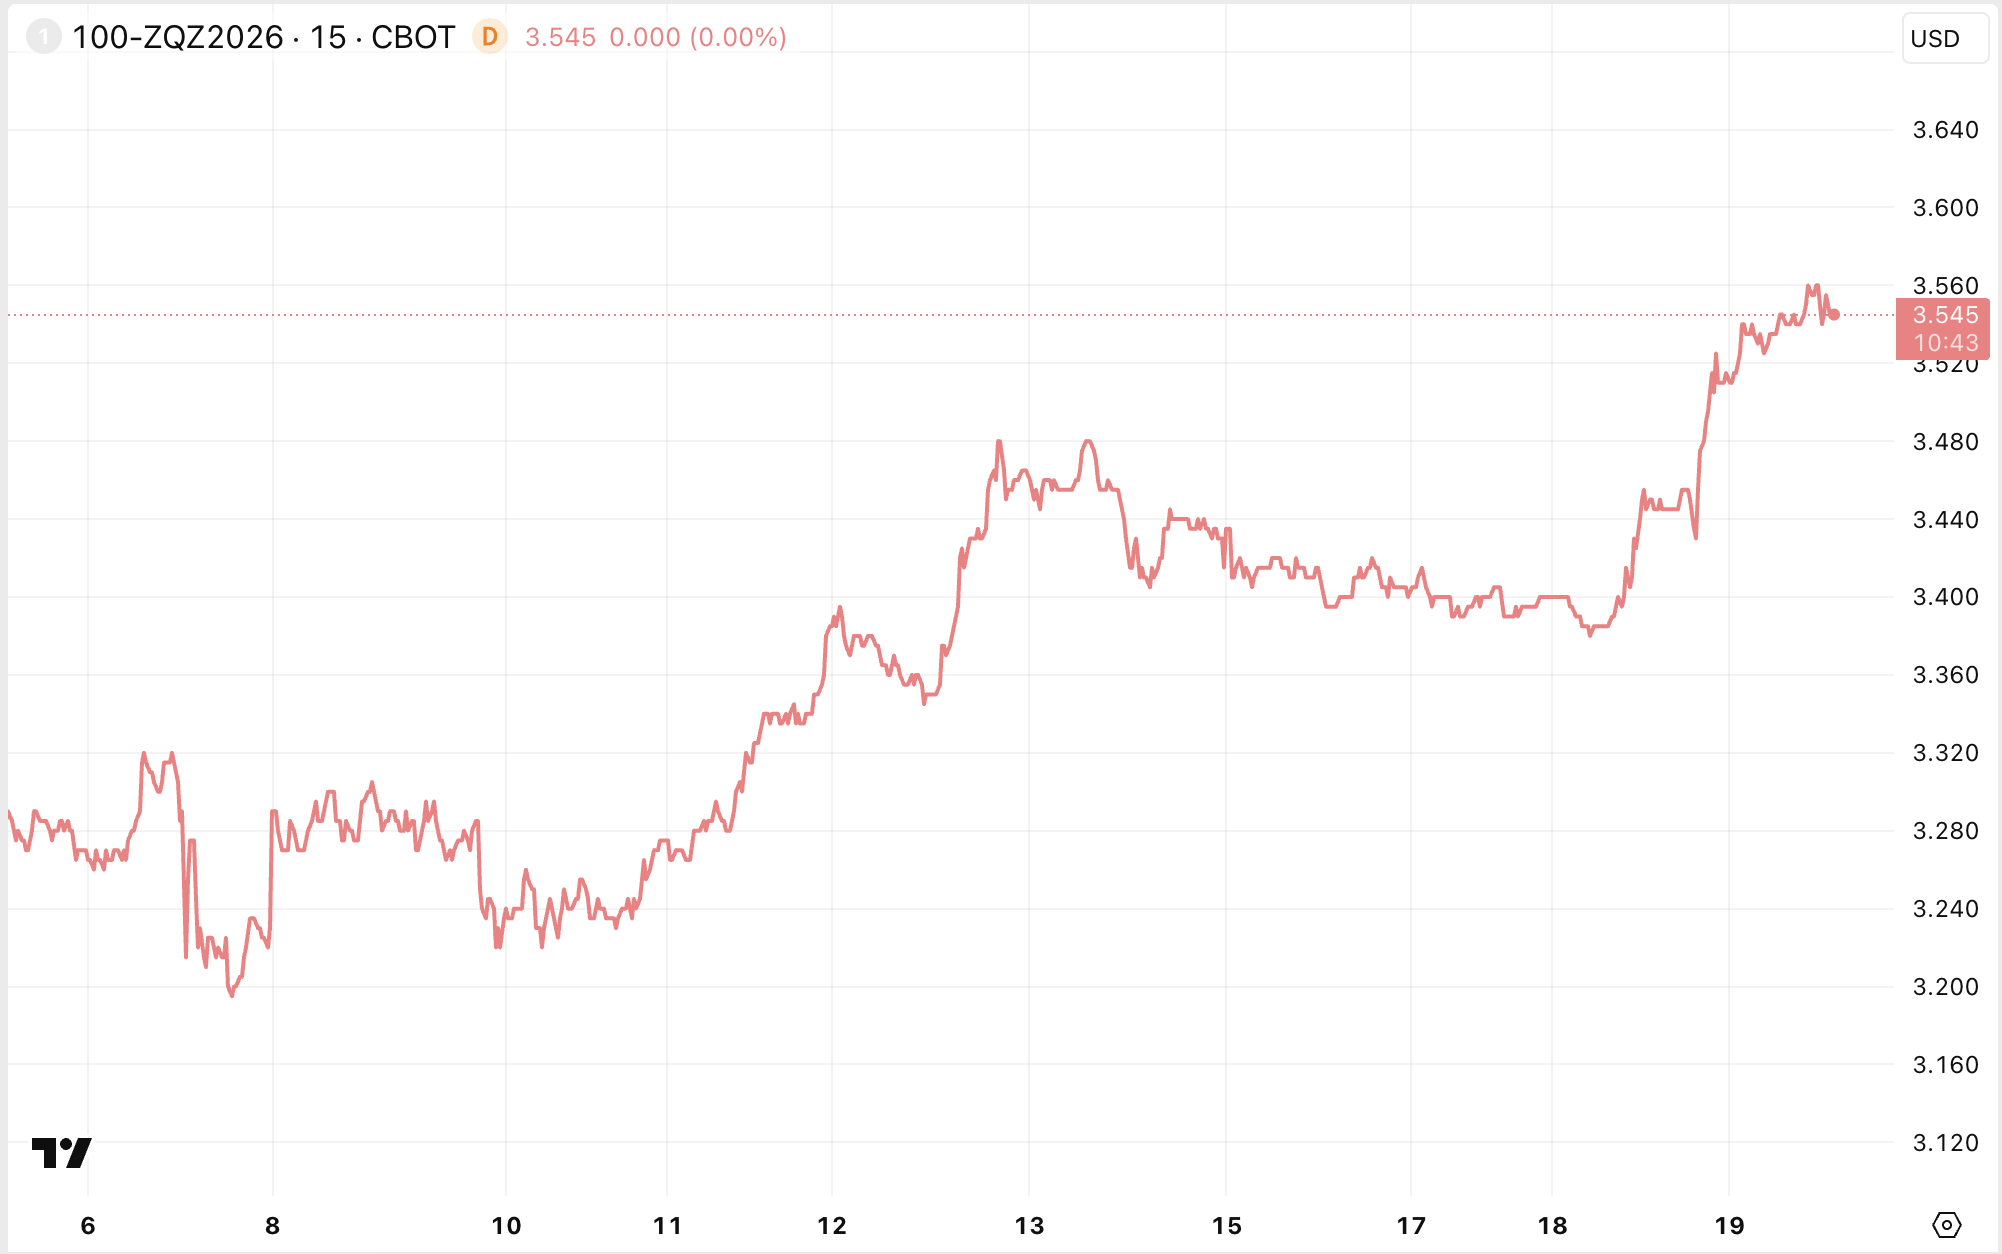
For now, the market therefore sees increasingly less room for rate cuts. The chart above shows the expected terminal rate for 2026, which falls within the current range of 3.50 to 3.75 percent.
The market is now pricing in fewer than one rate cut for 2026. Positioning is starting to become quite extreme. In the most favorable scenario, the Iran conflict ends sooner than the market currently expects, giving the Fed some room for rate cuts after all.
If we remain in the current situation for longer, there will probably be more rate cuts as well, but not for a positive reason. The current situation effectively amounts to a tightening of financial conditions.
Put simply: the prevailing uncertainty acts as a brake on credit creation and risk appetite. That takes a toll on the economy, meaning you'll eventually reach a point where the Fed regains room for additional rate cuts.
In the short term, however, that's not the most favorable scenario for bitcoin and other risk assets. As we saw this week, bitcoin performed well in recent weeks despite the Iran war, not because of the conflict. In that regard, it's unfortunate that this period coincides with bitcoin's rally.
In closing
All previous editions of Alpha Markets can be found in the archive. Questions, comments, and suggestions are always welcome in the community.
Thank you for reading!
To stay informed about the latest market developments and insights, follow our team members on X:
- Bart Mol (@Bart_Mol)
- Peter Slagter (@pesla)
- Bert Slagter (@bslagter)
- Mike Lelieveld (@mlelieveld)
We appreciate your continued support and look forward to bringing you more comprehensive analysis in our next edition.
Until then!