Bear Market Scenarios
Bitcoin saw its first daily close below $100k since May, fueling fears the bear market has begun. With confidence at rock bottom, we explore four scenarios: a recovery, a sideways grind, a mild dip, or a devastating crash to $25k. Is the bull run over?

Last night, we saw the first daily close below $100,000 since May 4th. It's yet another blow for optimists to absorb and adds fuel to the narrative that the bear market has begun.
There's no conclusive evidence for this yet, although the signs are starting to pile up. However, since a local bottom in a bull market can look remarkably similar to the start of a bear market, it pays not to jump to conclusions. Otherwise, you risk making the classic mistake of predicting ten of the last two bear markets.
Today, we'll discuss several bear market scenarios. Assuming the uptrend on the weekly chart has ended, what might the near future look like?
To begin with, it's worth noting that there is no universally accepted, precise definition of 'bull market' and 'bear market'. It often comes down to a period where prices are rising (or falling) and investors expect them to continue doing so.
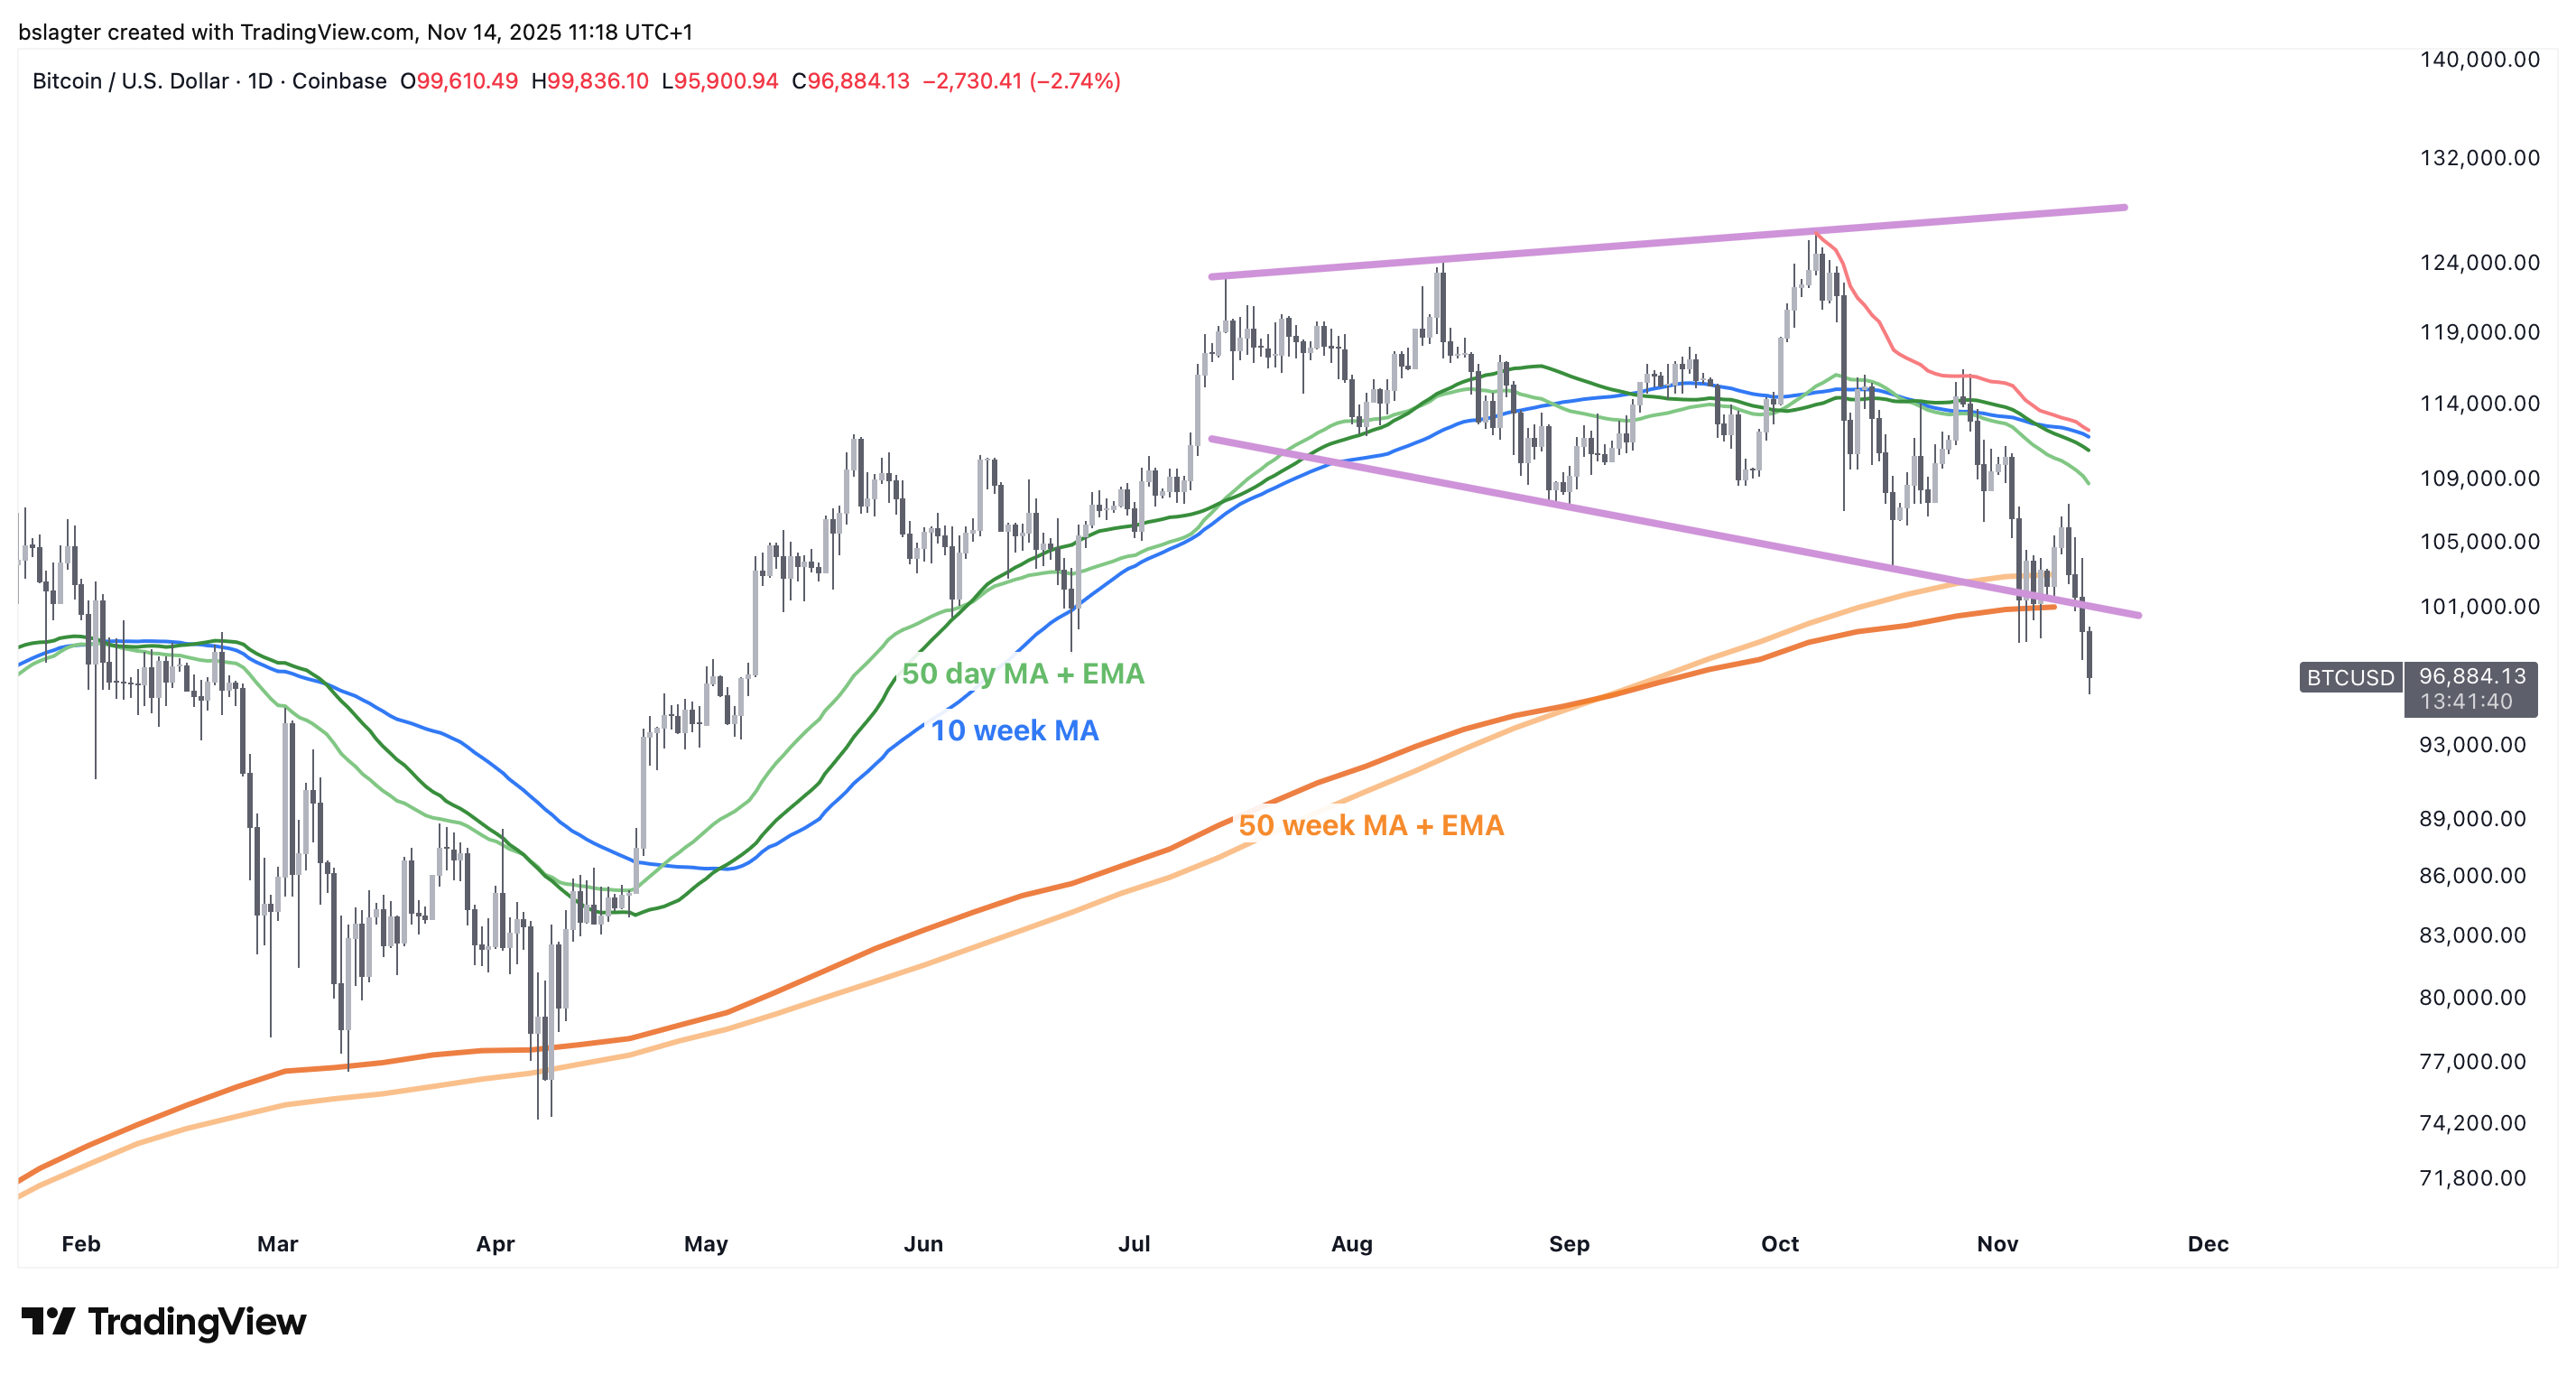
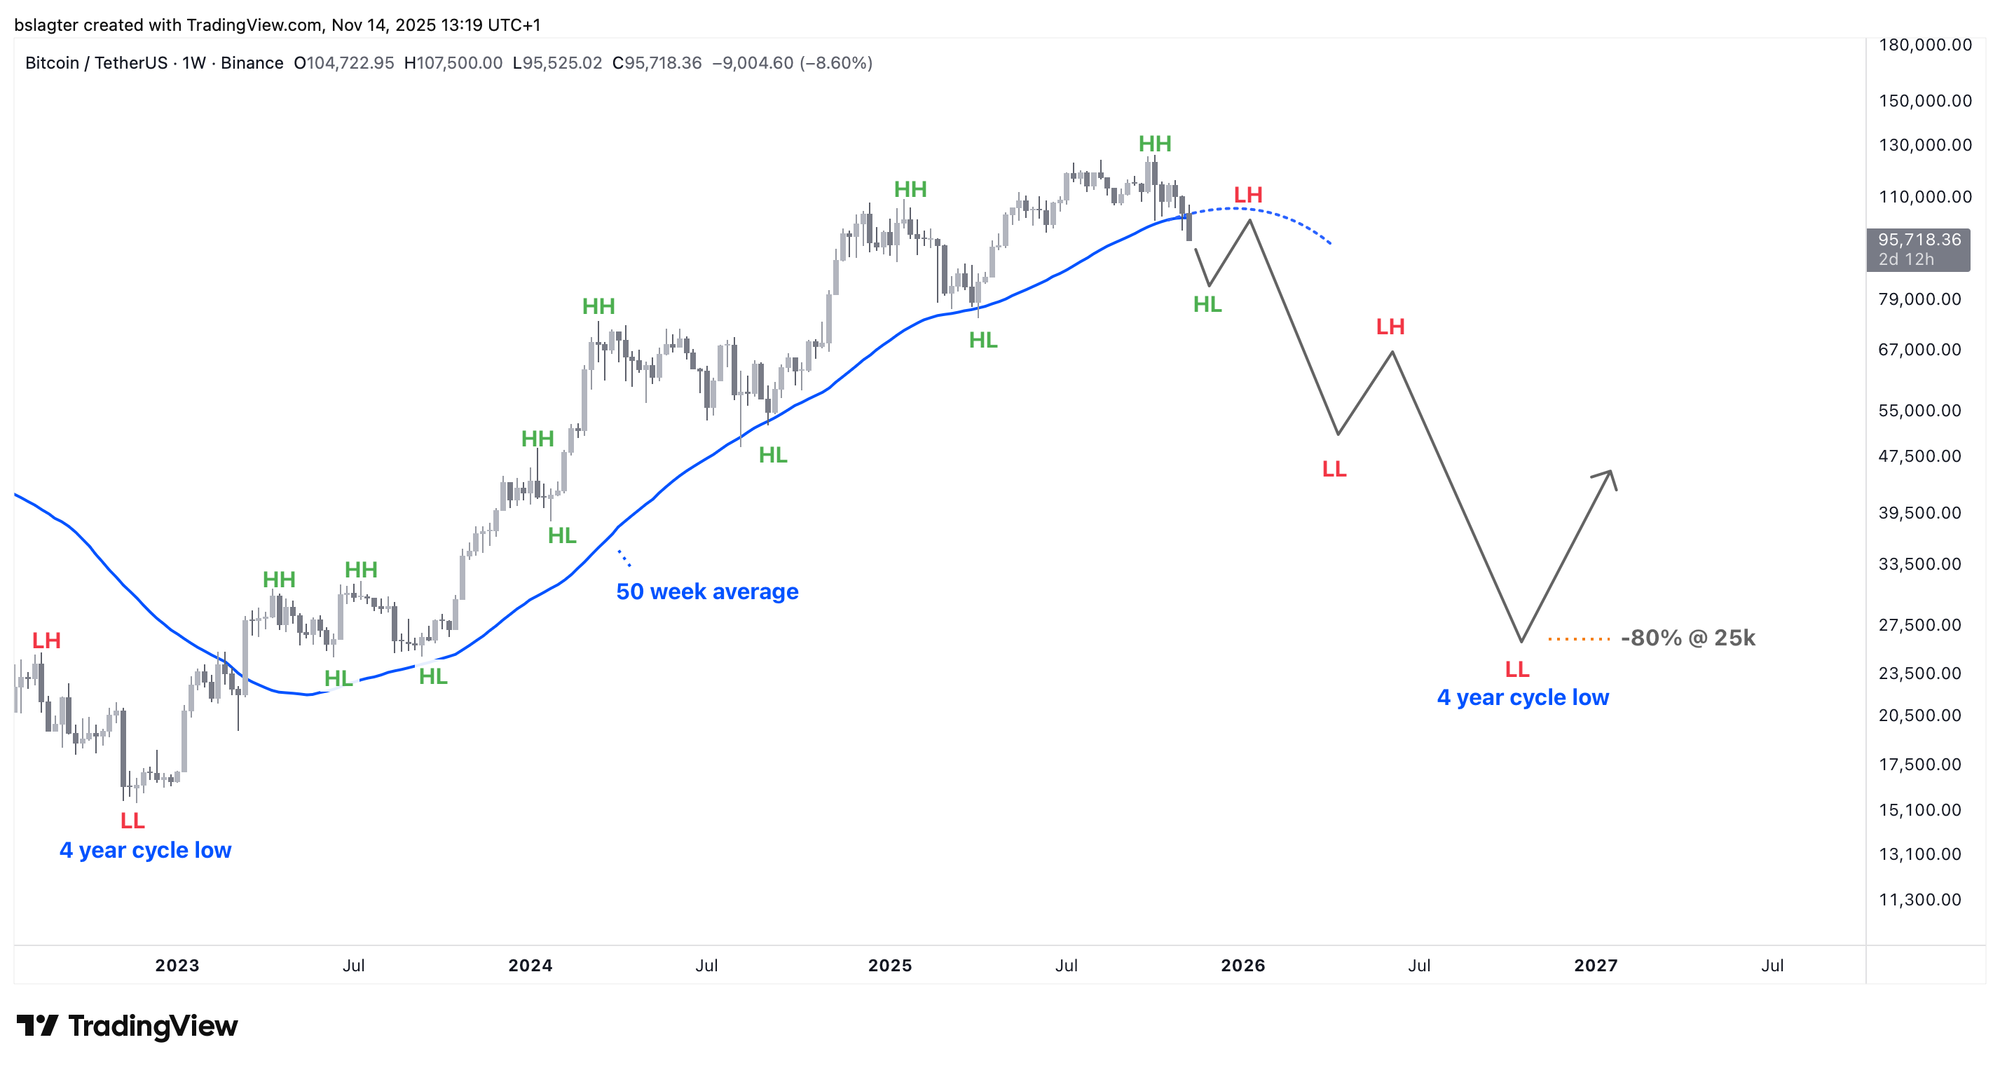
In practice, Bitcoin's bull market coincides with the uptrend on the weekly chart, characterized by a series of higher highs (HH) and higher lows (HL), with the price remaining above and finding support at the dominant moving average.
Many analysts identify the dominant moving average as having a length of about one year. We see periods of 10 and 12 months, 50 and 52 weeks, and 365 and 400 days being used, measured of course with a close on the monthly, weekly, or daily chart.
We are now below the dominant average, and we anticipate that the upcoming weekly and monthly closes will also be below it. This would be a strong indication that the 2023-2025 bull market is over.
Today, we'll look at four different scenarios for the period that follows:
- Resumption of the bull market
- A period of sideways movement
- A mild bear market
- A deep bear market
Resumption of the bull market
In financial markets, there are no certainties, only probabilities. The best indicator is occasionally wrong, and even the most reliable dominant average sometimes gives a false signal.
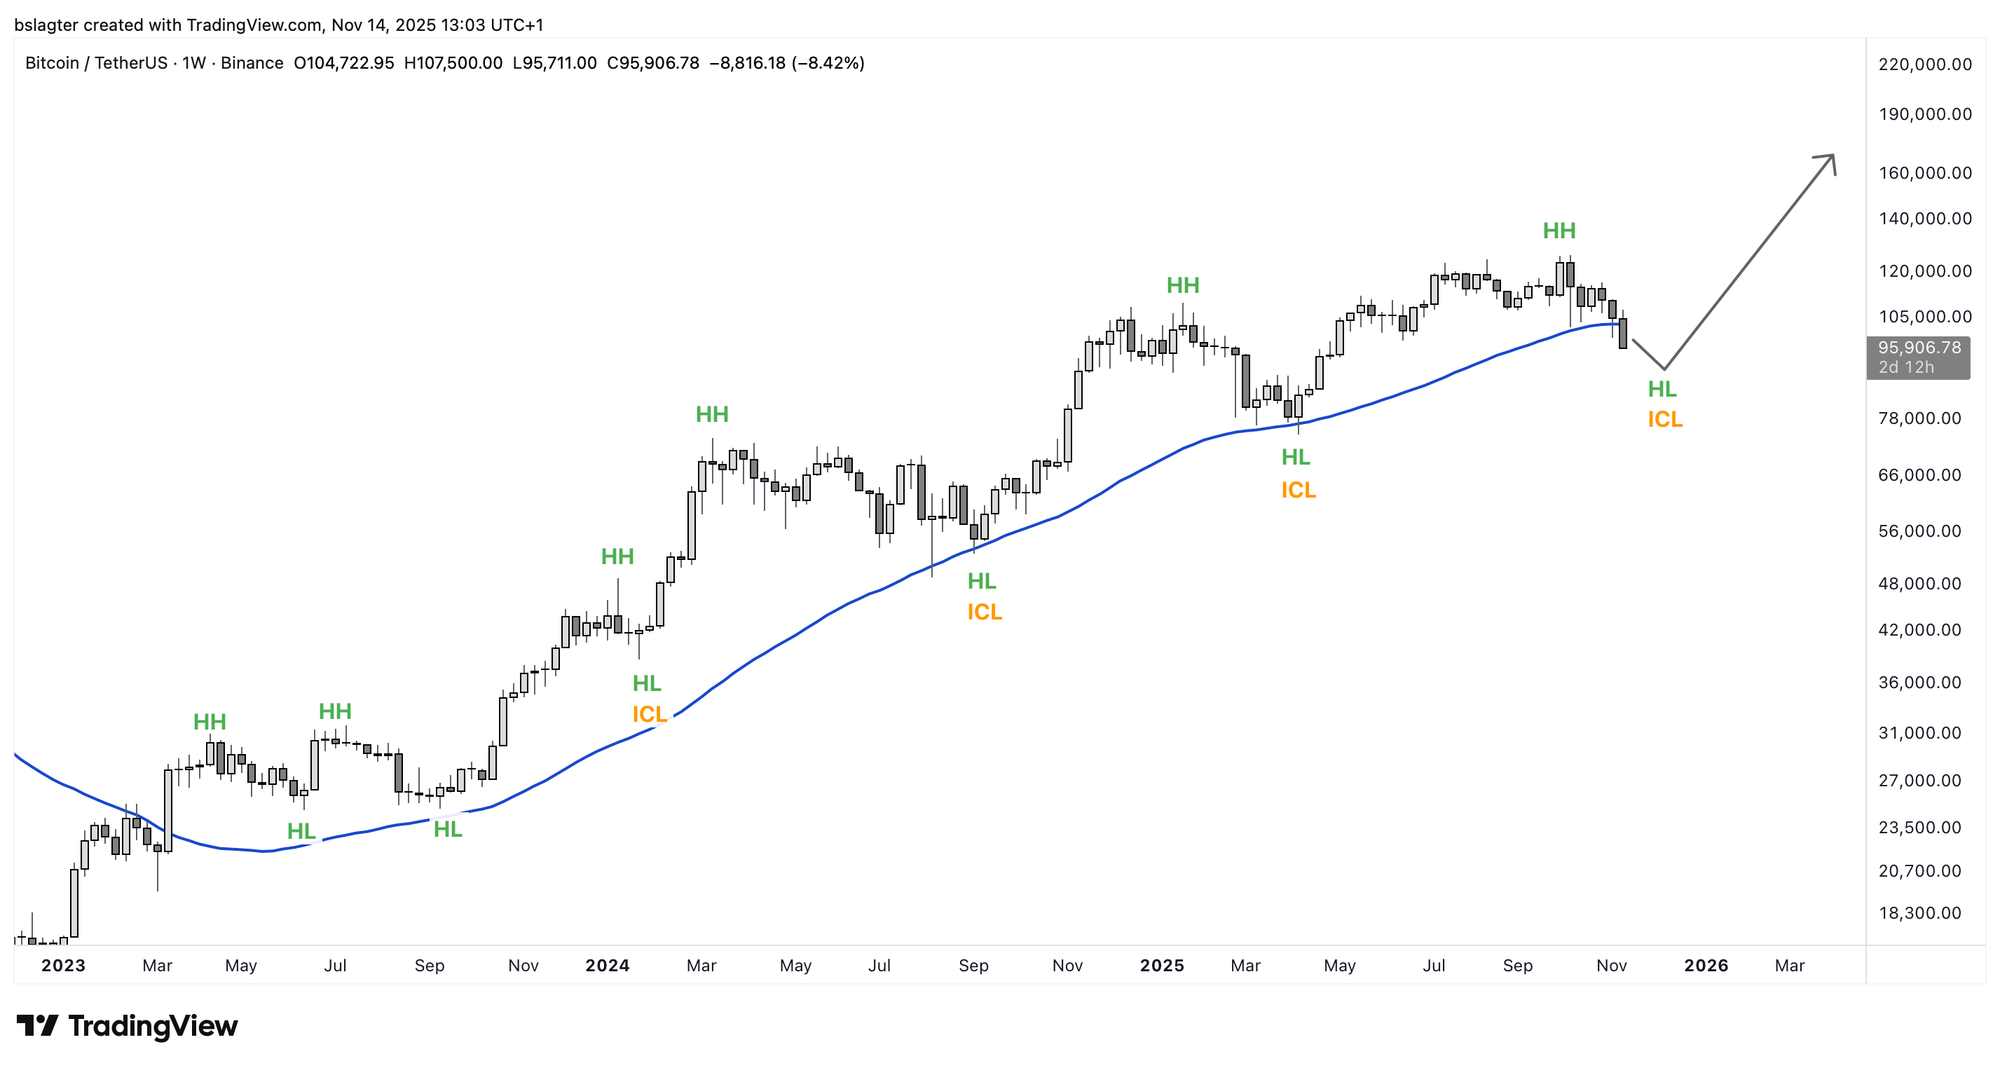
It's possible that the price could linger between $80k and $100k for a few weeks, after which a new period of ascent begins that can only be classified as a new weekly cycle within this yearly cycle—and thus, a continuation of the existing bull market.
It stands to reason that an external catalyst would trigger this rise, as we shouldn't expect much from within the crypto world itself. Confidence has hit rock bottom, and many have lost hope.
A period of sideways movement
We sometimes talk about "corrections through price" and "corrections through time." In both cases, existing investors take profits after a prior period of gains. They sell a portion of their position, increasing supply on the market.
In a correction-through-price, there is insufficient demand at high prices to absorb the supply, and the price falls to attract buyers and rebalance supply and demand.
In a correction-through-time, the selling volume isn't necessarily lower, but there are so many buyers in the market that the price doesn't get a chance to drop significantly. On the chart, this appears as a period of sideways price movement.
In terms of trends, this is a period without a clear direction—neither rising nor falling. The price fluctuates around the dominant moving average.
We have never seen this in Bitcoin's market cycle. An uptrend (bull market) has always been immediately followed by a downtrend (bear market), and then immediately by the next uptrend (bull market).
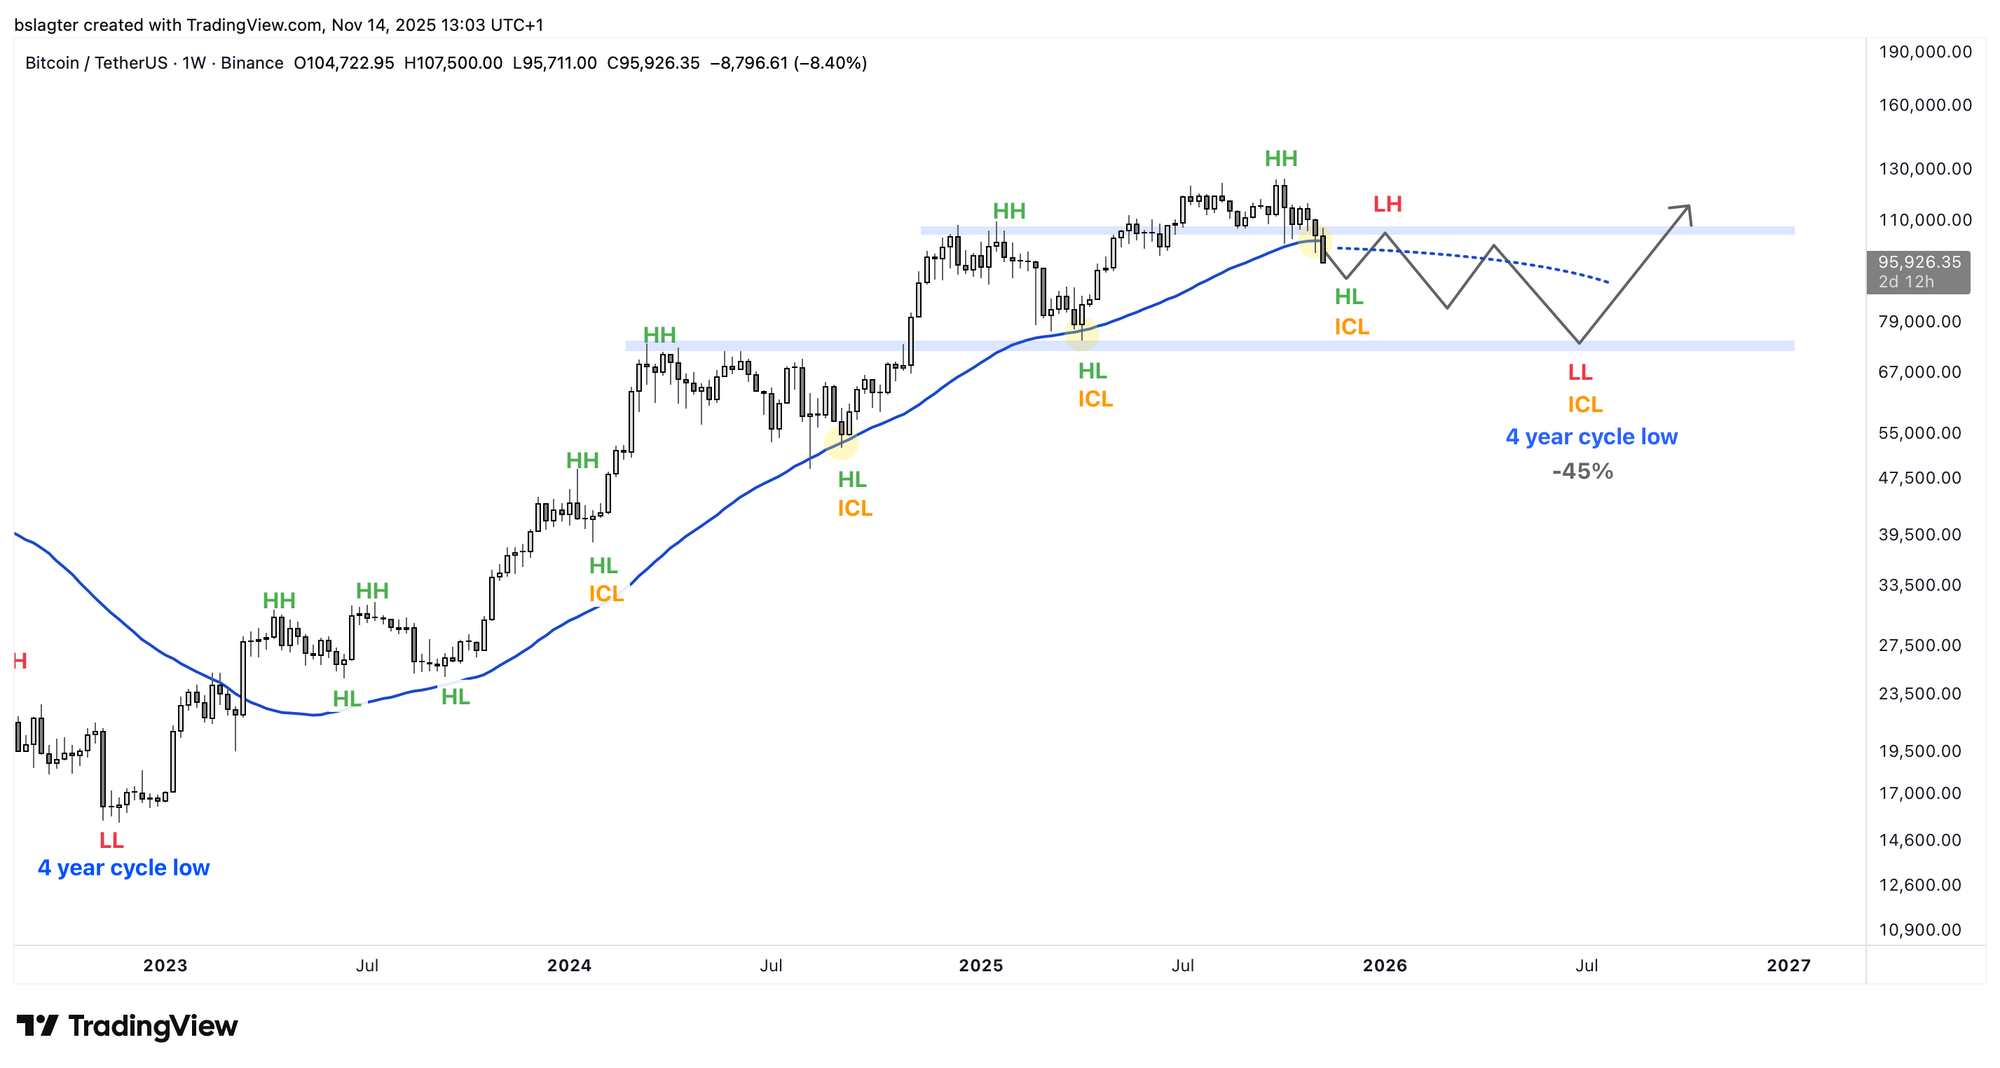
But it's possible this bull market could resolve itself through a correction-through-time on the scale of the market cycle. For example, a year and a half to two years in a price range between $80,000 and $120,000.
In the chart below, we've drawn an example of what that might look like. In this example, we've drawn the last bottom dipping just below the one from April of this year, but even that isn't necessary.
This would be sufficient for a reset on the yearly cycle. The last bottom would then also be the yearly cycle low and the beginning of a new yearly cycle. In other words, a new bull market lasting a few years could start after this.
Of all the scenarios, this is the most bullish. It more or less aligns with what Hunter Horsley, CEO of Bitwise, shared here: “I think there's a pretty good chance that we've been in a bear market for almost 6 months now and are almost through it.”
A mild bear market
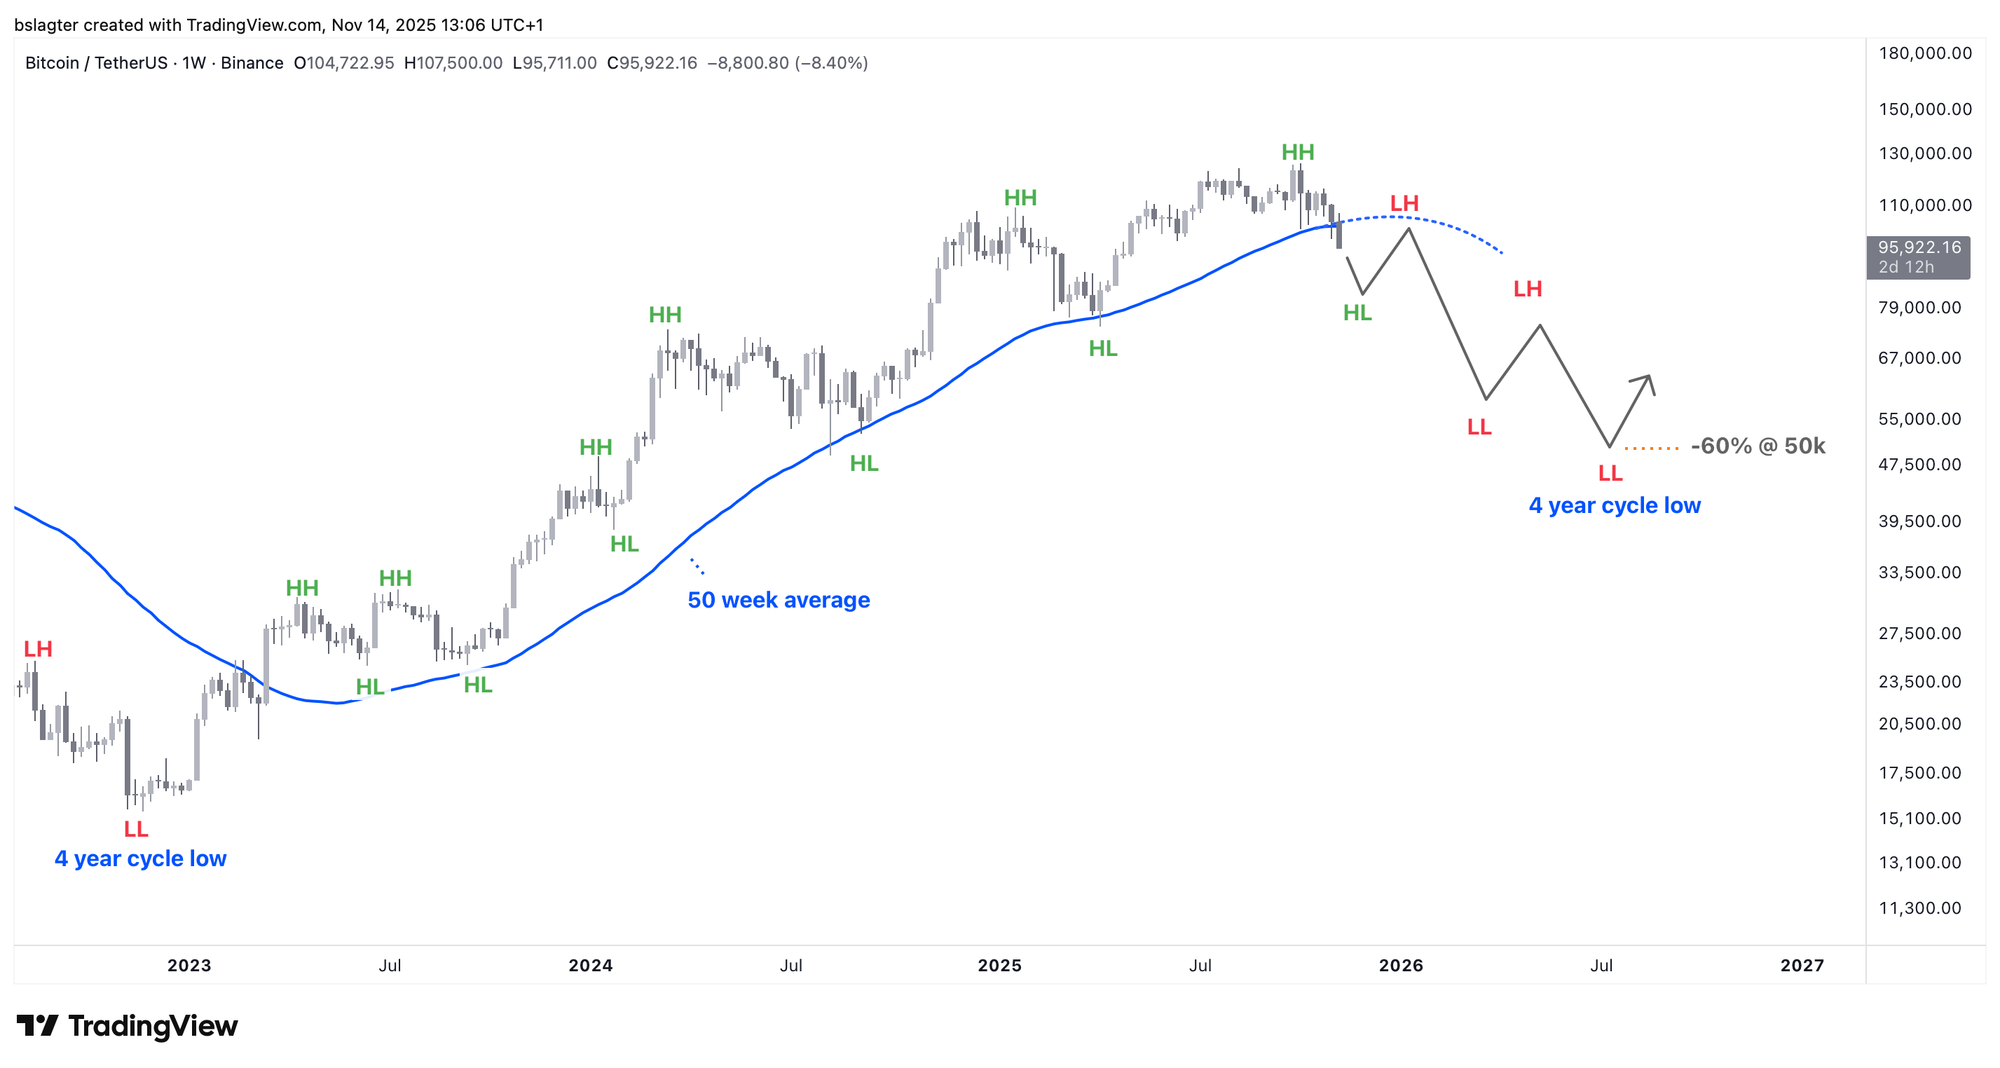
Most proponents of the halving cycle theory will expect this scenario. A typical bear market, with a clear downtrend on the weekly chart, but much less severe than in 2017 or 2021.
Not 85% or 77%, but closer to 60%. While these numbers may seem close, they represent a world of difference:
- At -85%, the price needs to increase 6.6 times to reach the top again.
- At -77%, the price needs to increase 4.3 times to reach the top again.
- At -60%, the price needs to increase 2.5 times to reach the top again.
There are valid arguments for a smaller decline than in previous bear markets. For instance, we saw much less hype and mania in this bull market, and there is relatively less unrealized profit.
Also, the macroeconomic conditions are very different now than in 2022. Back then, central banks worldwide had just begun an aggressive series of interest rate hikes to slow the economy and combat inflation. Now, governments and central banks are stimulating the economy.
If we extend that metronomic four-year cycle for another round, it would look something like this.
A deep bear market
As an investor, you should always seek to falsify your investment hypothesis: "What if I’m wrong?" That's why we're also discussing the worst-case scenario of a deep bear market with an 80% decline. From $126,000, that would result in a bottom of $25,000.
In this scenario, a domino effect of disastrous events pushes the price down step by step. Perhaps the flash crash on October 10th was the first in a long series.
In the first few months, the price decline is explained away with benign reasons. Old-school bitcoiners are cashing out because there's finally enough liquidity to take millions in profits. Some investors are moving to gold and AI stocks. Some are selling because the halving dictates it. "Just wait a little, this will pass, and then we're going to the moon."
But that doesn't happen. There is hardly any interest in an underperforming asset that is constantly hit with bad news.
Companies holding Bitcoin in their treasuries will be targeted. Let's see what happens when we apply pressure. Some will fall. Others will sell their bitcoin. Step by step, belief and trust erode. Waves of panic roll through the market. If you were around in 2018 or 2022, you know what we're talking about.
Models like Stock-to-Flow and the Power Law break. People start blaming each other and slinging mud. And the price continues to fall.
Bitcoin will be laughed at again. Now more than ever, it will be "bitcoin is dead," because if you can't succeed with a stamp of approval from the US government and BlackRock handling the marketing, how can you?
And we end up at -80% again.
We're not saying this will happen, but it is conceivable. Therefore, we must include this scenario in our considerations.
Probabilities
We have always said that we are in a bull market until proven otherwise. That point is now getting quite close, as the evidence is piling up. Crossing the dominant moving average is a significant one, but we are also considering:
- Bearish divergence on the weekly RSI suggests waning bull market momentum.
- Bearish divergence with the MVRV suggests an increasing tendency among investors to take profits.
- MicroStrategy (MSTR) has closed below its dominant moving average, and its price is below the start of the "Trump Trade."
- Loss of correlation with the stock market and risk appetite indicators. Investors are willing to take risks, just not with Bitcoin.
- For six months, positive news has had no impact on the price, while bad news continues to push it down.
This doesn't mean that everything now points to a bear market. There are still arguments in favor of the bull market's continuation. But unlike around the weekly cycle lows of September 2024 and April 2025, there are now signals we cannot ignore.
Since the Alpha Markets update on October 17th, we have assigned a 35% probability to the end of the bull market:
As a recovery fails to materialize and we have dropped below the bottom of the price range, we are increasing the probability of a bear market from 20% to 35%. The base case remains that we are in a bull market, albeit with more uncertainty than, say, a month or three ago.
With a weekly close below the 50-week moving average, we will increase that to 70%. This means there would still be a 30% chance for a resumption of the bull market.
We would then distribute the probabilities as follows:
- Resumption of the bull market: 30%
- A period of sideways movement: 40%
- A mild bear market: 20%
- A deep bear market: 10%
We would prefer to see the sideways period. That would be particularly favorable over the next few years, as it implies that besides a lot of supply, there is also a lot of demand—demand from investors who are not swayed by the gloom on X and panic among altcoin investors.
A sign of this would be seeing a lot of realized profit at lower prices, and little realized loss. Conscious and rational rotation out of Bitcoin, but no panic selling. And thus, the presence of buyers absorbing the supply.
We are very curious to see how the coming weeks unfold. Economic data after the longest shutdown ever. An increase in liquidity in the bond market. A Fed interest rate decision without the data to back it up. We will keep you updated!
We will continue with the following topics for our Alpha Plus members:
- Uncertainty Over US Central Bank's Interest Rate Policy Makes Bitcoin Stumble
- Why the US Central Bank is Stopping Quantitative Tightening
1️⃣ Uncertainty Over US Central Bank's Interest Rate Policy Makes Bitcoin Stumble
Thom
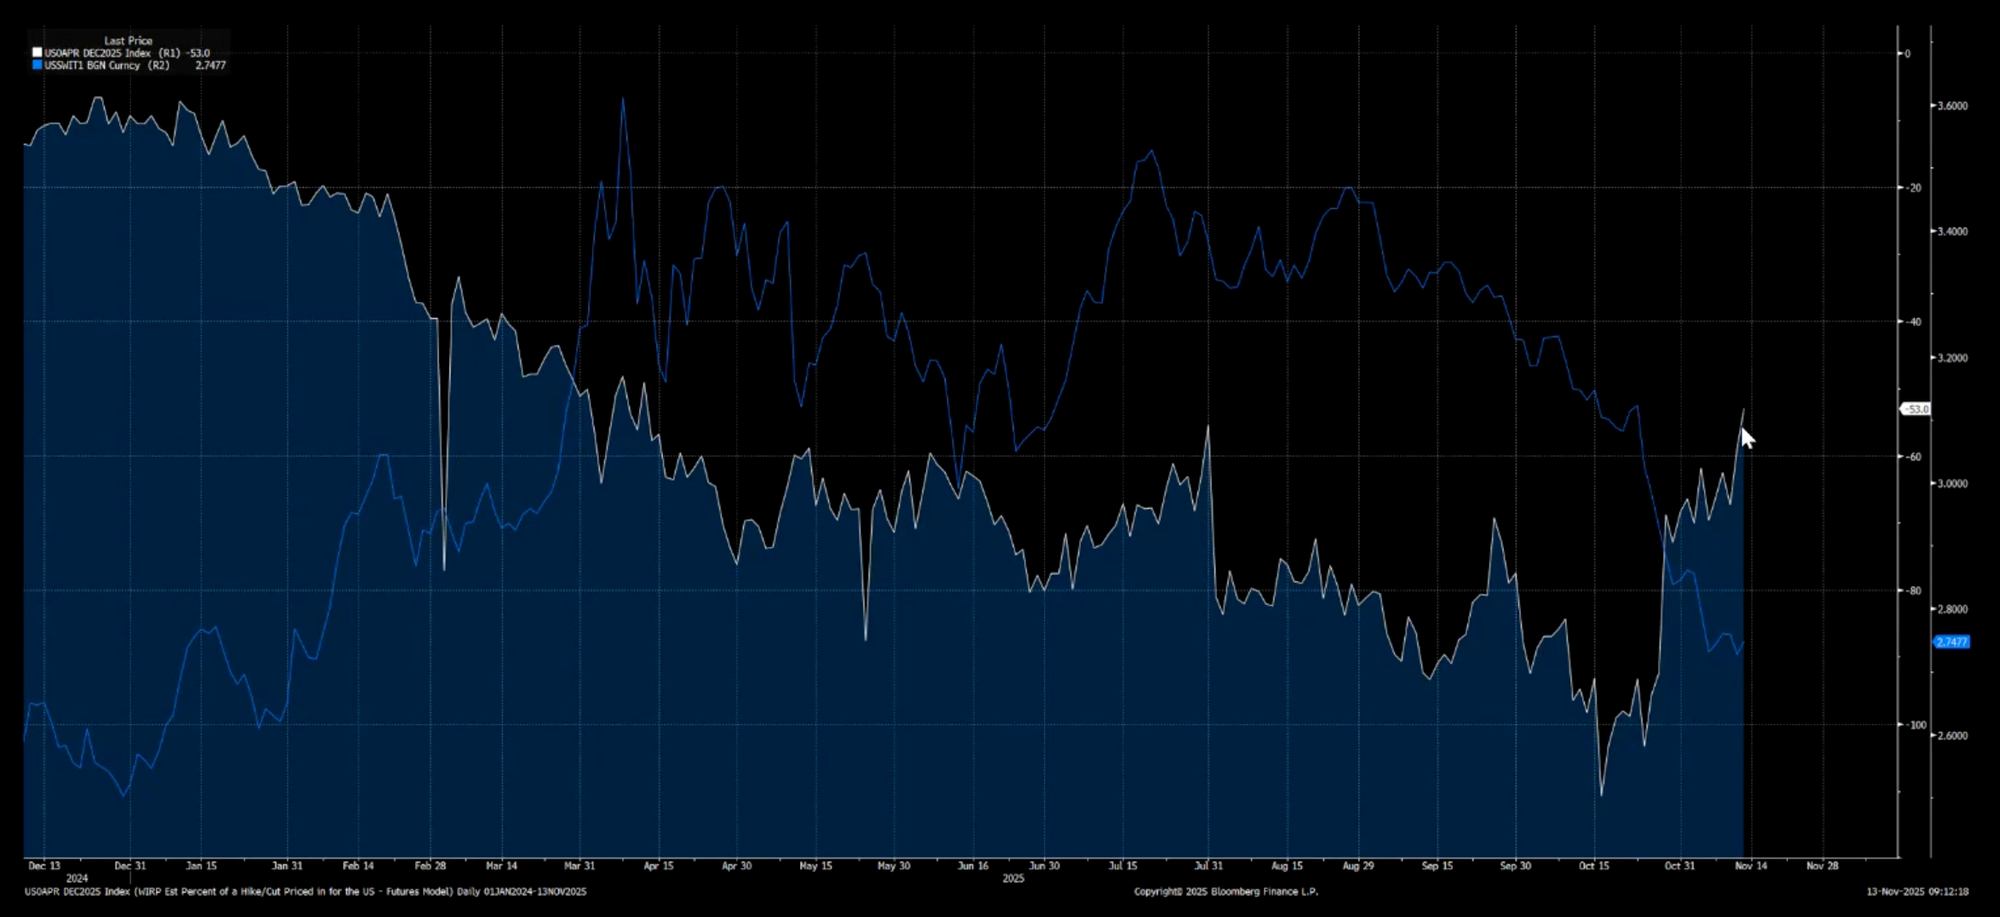
Bitcoin has been struggling since the last interest rate meeting of the US central bank. Quite unexpectedly, Chairman Jerome Powell shared that a rate cut in December was not at all certain.
As a result, the probability of a rate cut in December has now dropped from nearly 100% to about 50%. At the same time, we saw inflation expectations fall, and that's the crux of the matter.
This dynamic leads to a higher real interest rate. That is the interest rate on government bonds minus inflation, which essentially gives you the actual return on capital. When the real interest rate increases—in this case, due to falling inflation expectations and a steady nominal rate—it puts pressure on the financial market.
We were coming from a period where expectations about the US central bank's interest rate policy were very optimistic for the coming months. Now that picture has become clouded, increasing volatility and introducing uncertainty.
This development essentially acts as a brake on the growth of global liquidity. However, I expect this to be a temporary development. With the current trend of inflation (downward) and the cooling labor market, I see no reason for the US central bank to follow through in December on the hawkish stance from its last meeting.
Should the central bank under Powell decide to hit the brakes after all, that is likely to change if Trump gets to appoint a new chairman in 2026. He will do everything he can to ensure the market is bullish during the midterm elections next November.
From that perspective, I still think the scenario with a longer bull market has the highest probability. If I had to put percentages on it, I would say 60/40 in favor of a longer bull market.
If that happens, Bitcoin will also shed the idea of the four-year cycle, which is currently causing additional selling pressure. In my opinion, this is the main reason for Bitcoin's underperformance compared to other financial assets at the moment, which of course are not "burdened" by that narrative.
2️⃣ Why the US Central Bank is Stopping Quantitative Tightening
Thom
During the last interest rate meeting, the US central bank announced it would stop Quantitative Tightening (QT) as of December 1st. This is the process where the central bank does not replace maturing government bonds and mortgage-backed securities. As a result, the private market must absorb these securities, which pulls capital away from risk assets and investments in the real economy. Since 2022, this has been a key weapon in the fight against inflation.
Now that QT is ending in December, you might expect this to act as a stimulus for the markets. But according to Stephen Miran, Donald Trump's nominee for Fed governor, that view is too simplistic.
Miran argues that the new balance sheet policy, effective December 1st, will remain marginally restrictive. No easing, no hidden stimulus, but a policy change that will keep financial conditions tight rather than loosening them.
He argues this is the case because, from December 1st, the US central bank will replace all maturing bonds and securities, but not with the same type of assets. The money the central bank receives from maturing mortgage-backed securities will be used to buy short-term government bonds.
This will stabilize the banking system, where we recently saw short-term rates rise, while simultaneously slowing the economy slightly.
This measure could slow the economy slightly because the market will have to absorb the entire supply of long-term bonds. This could cause these rates to rise, or at the very least, ensure that stopping QT in this manner does not lead to lower rates.
In other words: the US central bank's new balance sheet policy seems aimed at keeping the banking system stable, but not at providing a stimulus to the entire financial system.
That could come eventually, but it's certainly not happening this way. Fed Governor Miran says this policy change is "not dovish," and that seems to be correct.
The question, however, is whether a more expansionary balance sheet policy from the US central bank is even necessary for Bitcoin. At the moment, that doesn't seem to be the case, as the US economy still looks solid on most fronts. According to the Atlanta Fed's GDPNow model, inflation-adjusted economic growth is still around 4.0 percent.
It is often a positive for risk assets when central bank intervention is not necessary. When it is, there is usually a serious problem in the economy. And if there are doubts about the health of the economy, it dampens credit creation, resulting in less liquidity flowing into the system that could go towards Bitcoin.
For investors, it would be great if the US central bank unnecessarily stepped on the gas, but that's not happening at the moment. At least not when it comes to the balance sheet policy as of December 1st.
Thank you for reading!
To stay informed about the latest market developments and insights, you can follow our team members on X:
- Bart Mol (@Bart_Mol)
- Peter Slagter (@pesla)
- Bert Slagter (@bslagter)
- Mike Lelieveld (@mlelieveld)
We appreciate your continued support and look forward to bringing you more comprehensive analysis in our next edition.
Until then!