Are We There Yet?
Bitcoin has been hovering around $67,000 for two months straight. Cycles, on-chain data, and geopolitics all point the same way — but have we already seen the bottom, or is more pain ahead?

Remember that scene from Shrek 2 where Donkey, voiced by Eddie Murphy, drives everyone crazy during the endless road trip to The Kingdom of Far Far Away?
Are we there yet? For many, that's a fitting summary of the bear market: waiting for the bottom. To get back in, to increase your position, or simply because things get a lot more fun in crypto once we're past it.
This week we look at progress through the bear market valley along the following lines:
- The monthly chart and the yearly cycle
- The weekly chart and the weekly cycle
- On-chain data
- Geopolitics & the stock market
We also have the following pieces ready for you:
- End of the Iran war won't save bitcoin
- U.S. Treasury volatility is bad news for bitcoin
- Warning signals from other markets
1️⃣ The monthly chart and the yearly cycle
Bert
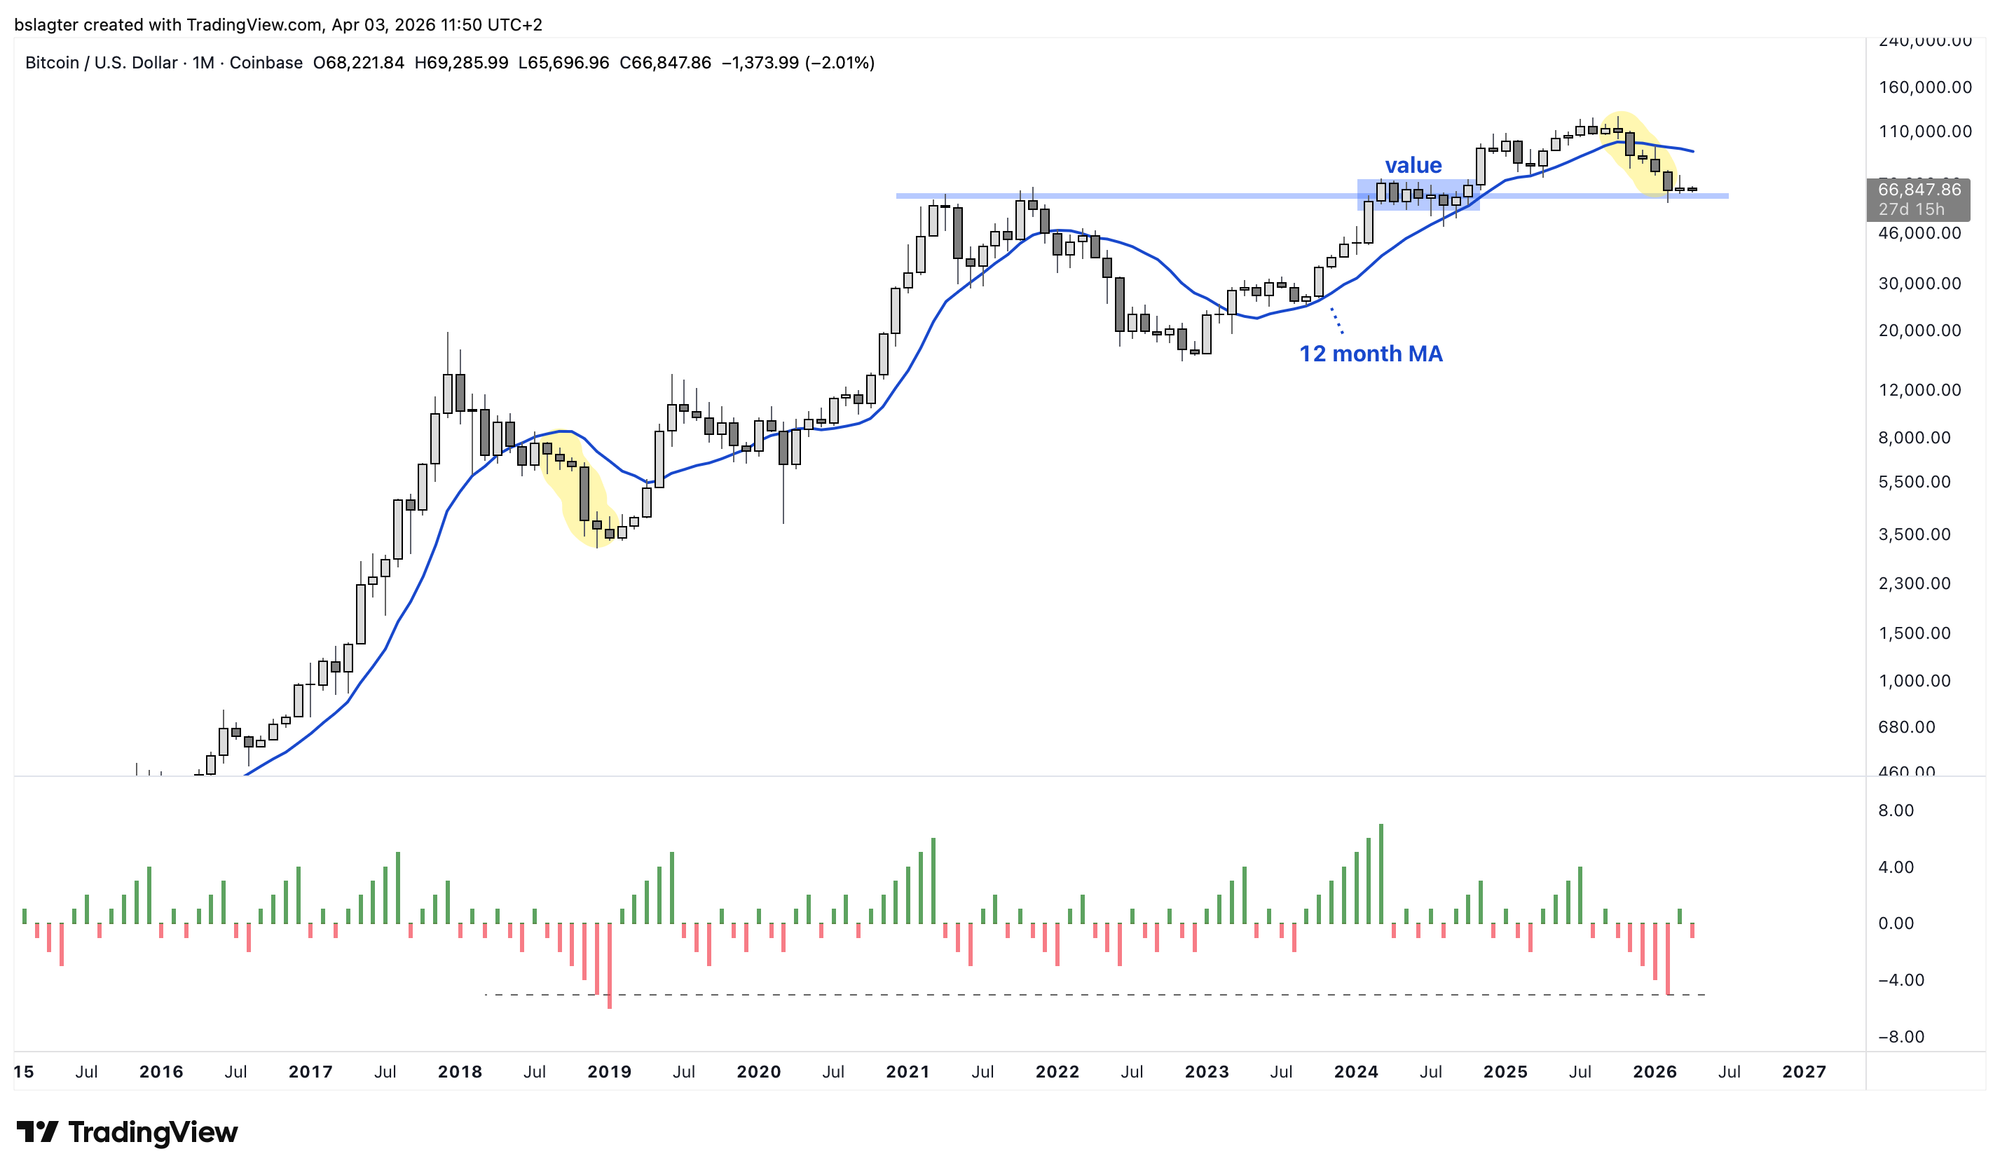
After five months of decline, March closed with a small gain. Once again above the 2021 highs zone, and in the 2024 "value" area.
If bitcoin manages to hold its monthly close above $61,300, you can view this as a very large "resistance → breakout → retest as support" pattern. A strong foundation for the next bull market. Within the month, price can certainly dip quite a bit lower. The August 2024 wick also reached as low as $49,000.
Five consecutive red months is not unique. In 2018, we saw six straight months of decline, ending in the zone where the bottom was formed. In 2022, two or three months of decline alternated with some recovery. Both are normal manifestations of the declining phase of a bear market.
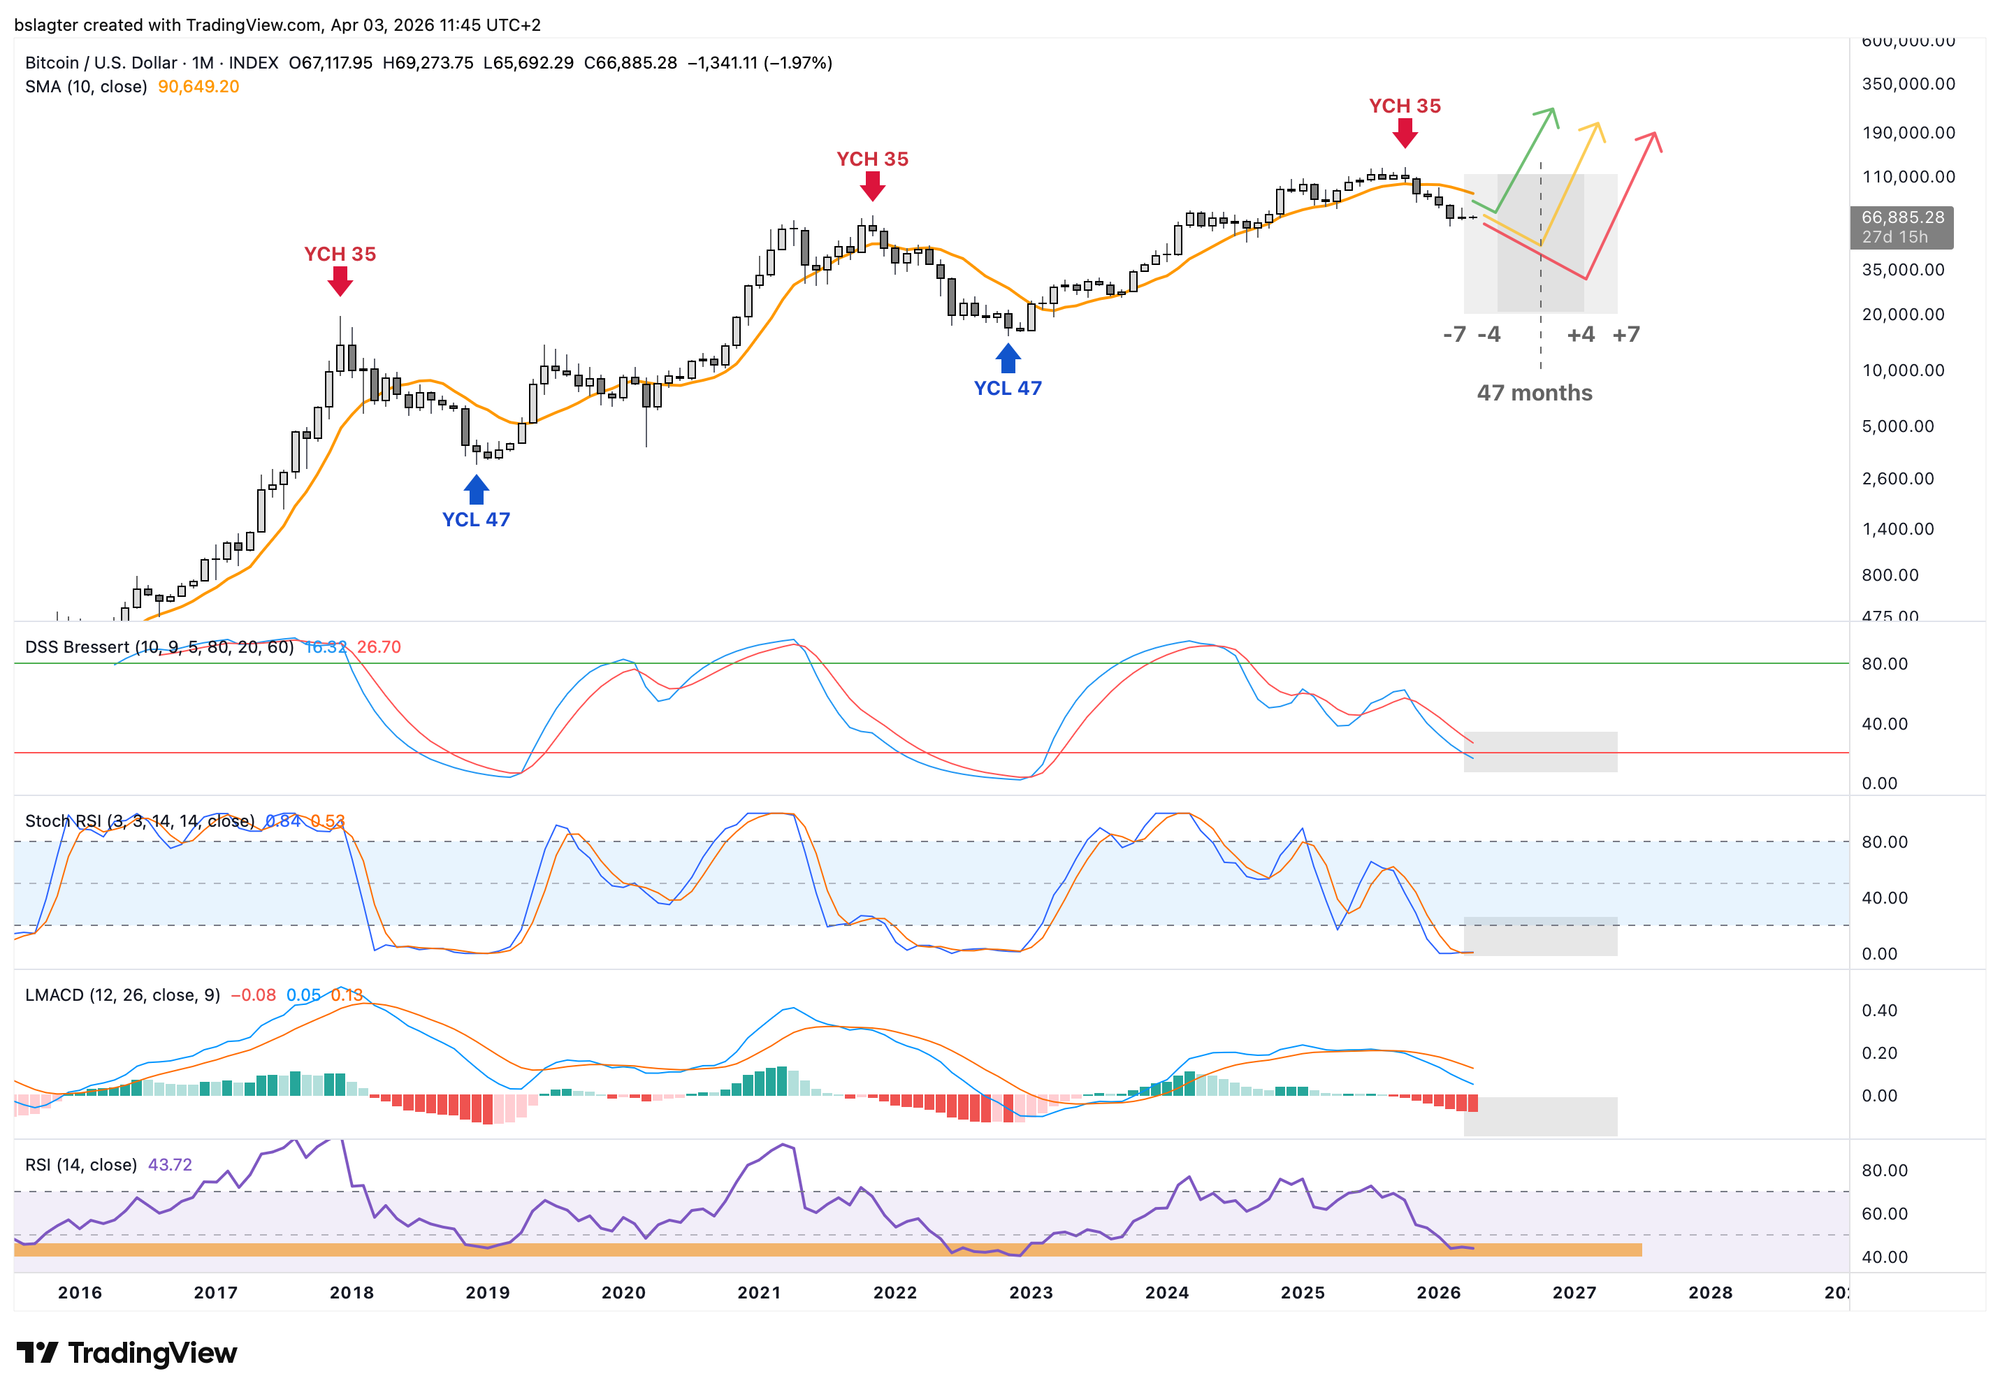
Bitcoin's yearly cycle lasted 47 months the past two times, with the top in month 35. This bull market also peaked in month 35. That's coincidence. In October 2025, other assets sensitive to risk appetite and liquidity also topped out, such as the ETFs IGV (software), IPO (recent IPOs), ARKK (innovative technology), ESPO (video gaming), and SKYY (cloud computing).
In other markets, yearly cycles are often stable in length for decades. However, that doesn't mean every cycle is exactly the same length. Coming in 10 percent earlier or later than the average is very common, and 15 percent happens from time to time as well.
The chart below illustrates that range. February is month 39, which is very early for a bottom. A bottom somewhere between June 2026 and February 2027 is more likely.
The indicators at the bottom show the pendulum swing between bull and bear markets. The depth is sufficient, but the time spent at the bottom could be a bit longer. Based on this, you'd say another month or two should be enough to start building new positive momentum.
We usually look at bitcoin's price in dollars. Because the dollar itself is also under pressure, it's interesting to also look at bitcoin's price expressed in gold.
Measured in gold, December 2024 was the top, and bitcoin has been in a bear market for 15 months. It's possible that February was the bottom. In that case, we'd want to see this ratio continue rising in April.
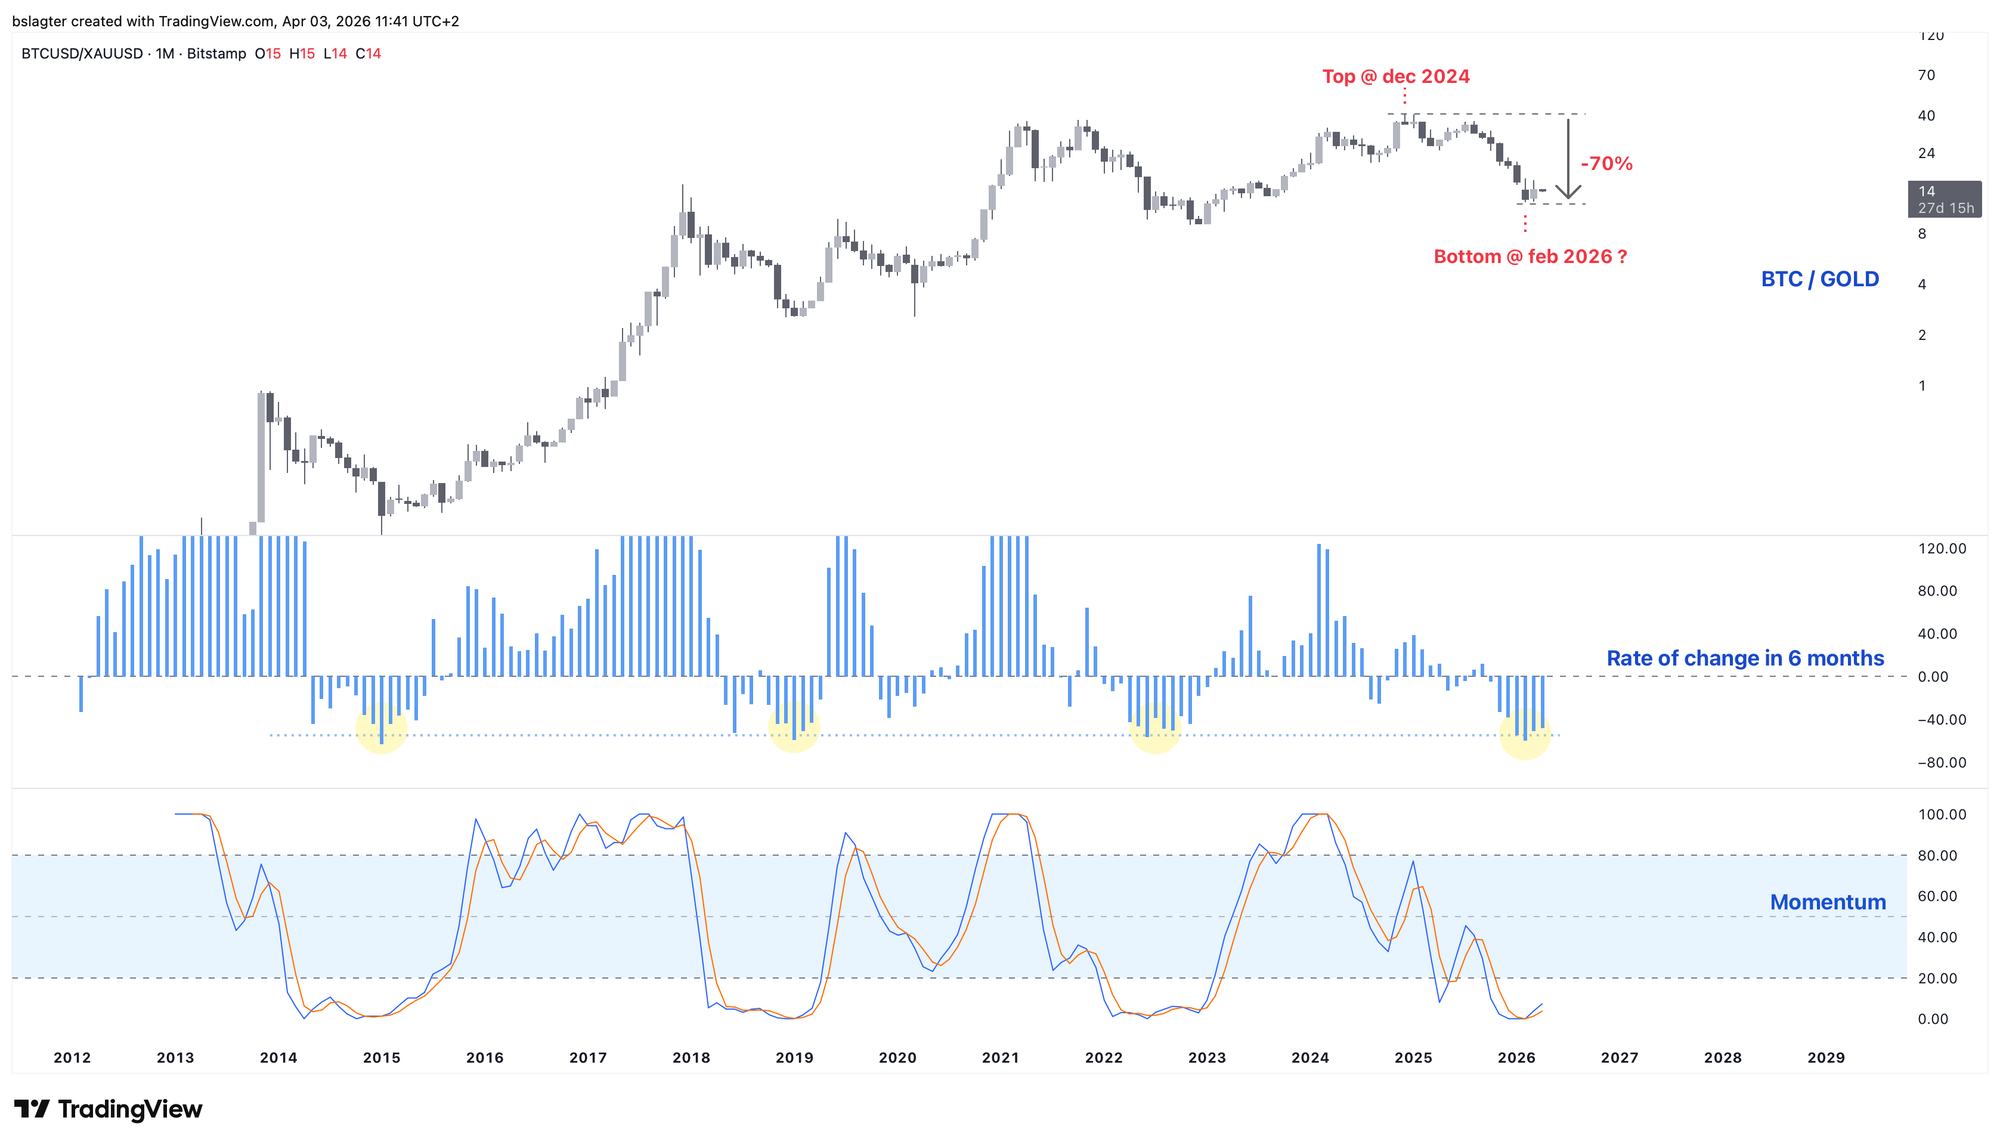
The monthly chart is well on its way toward the bear market bottom. Measured in gold, we may have already put it behind us. In dollar terms, we likely still have a bit further to go. No more than a few months, and much lower prices aren't necessary either.
This supports our base case that we'll see a bottom between $48,000 and $60,000 around the end of the second quarter.
2️⃣ The weekly chart and the weekly cycle
Bert
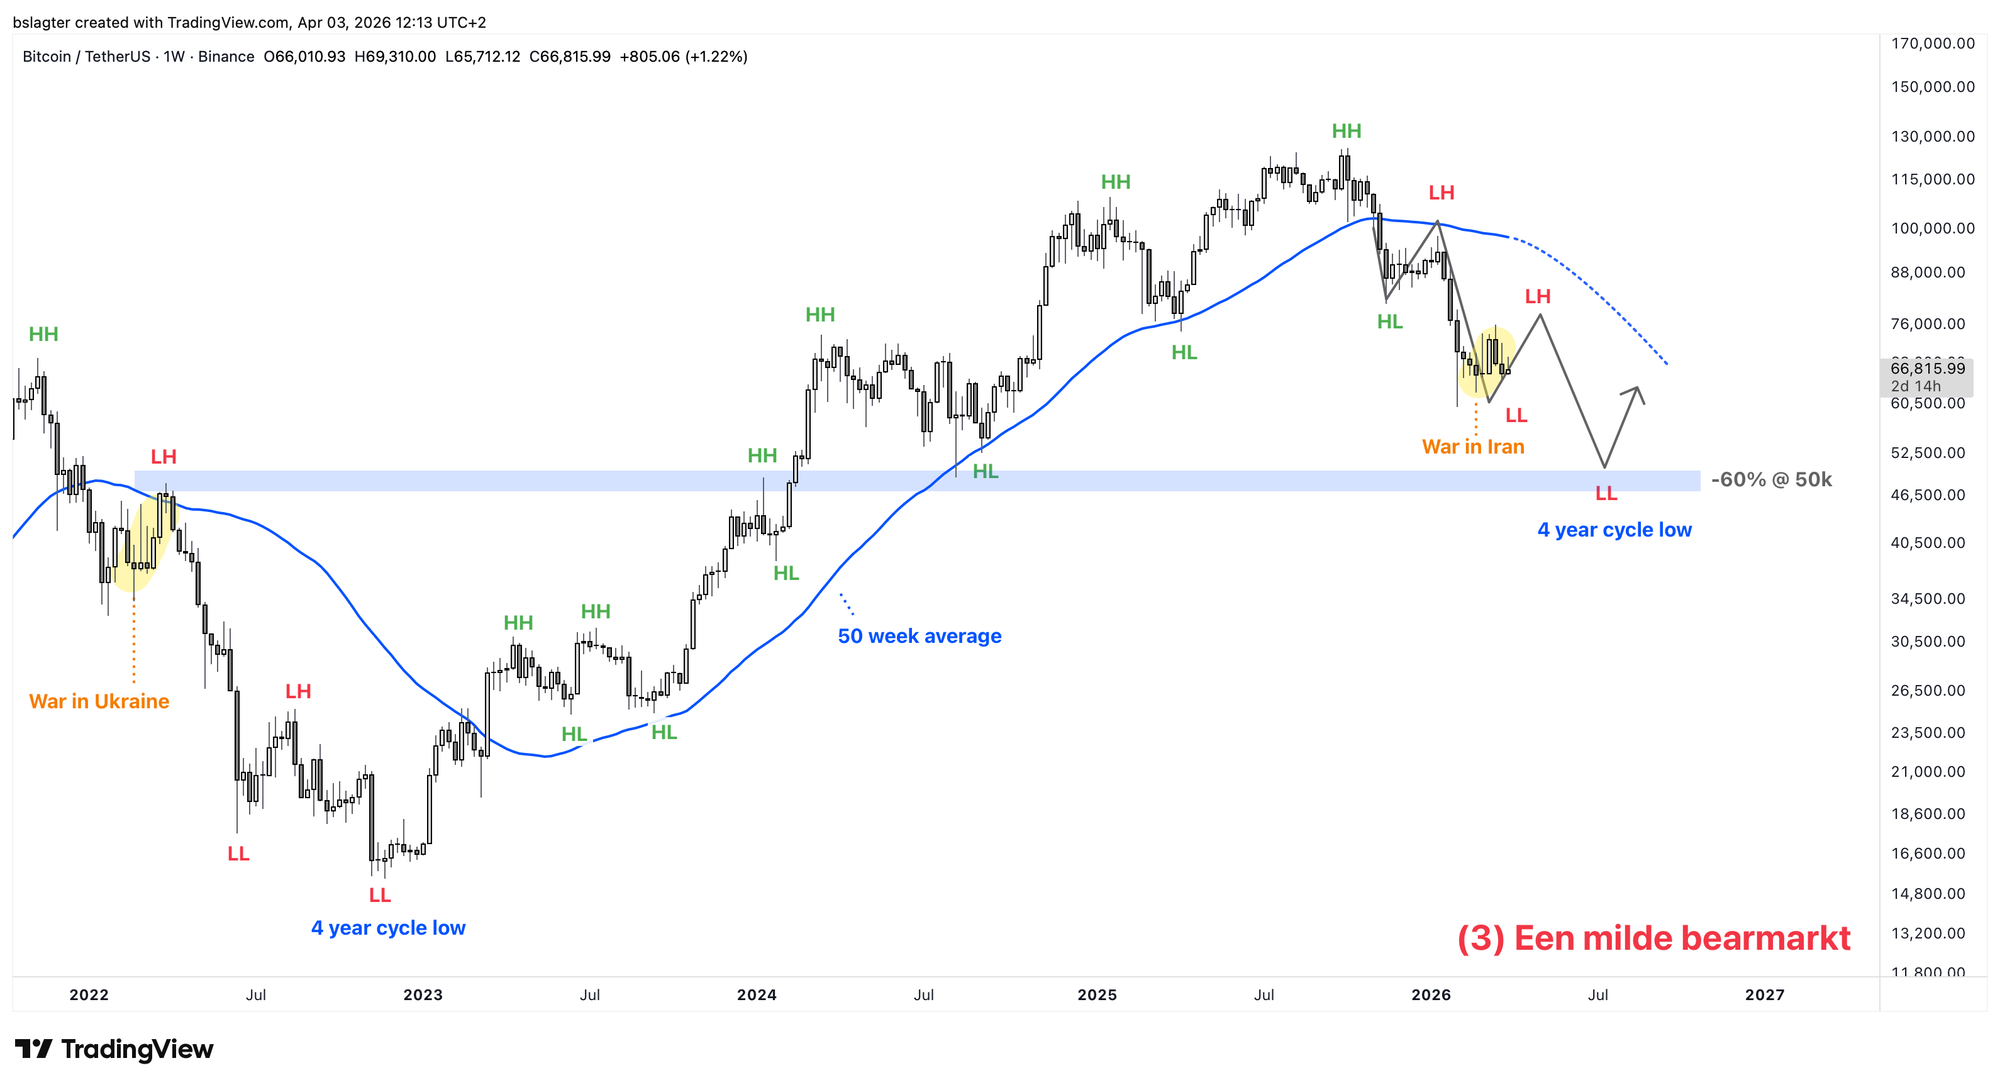
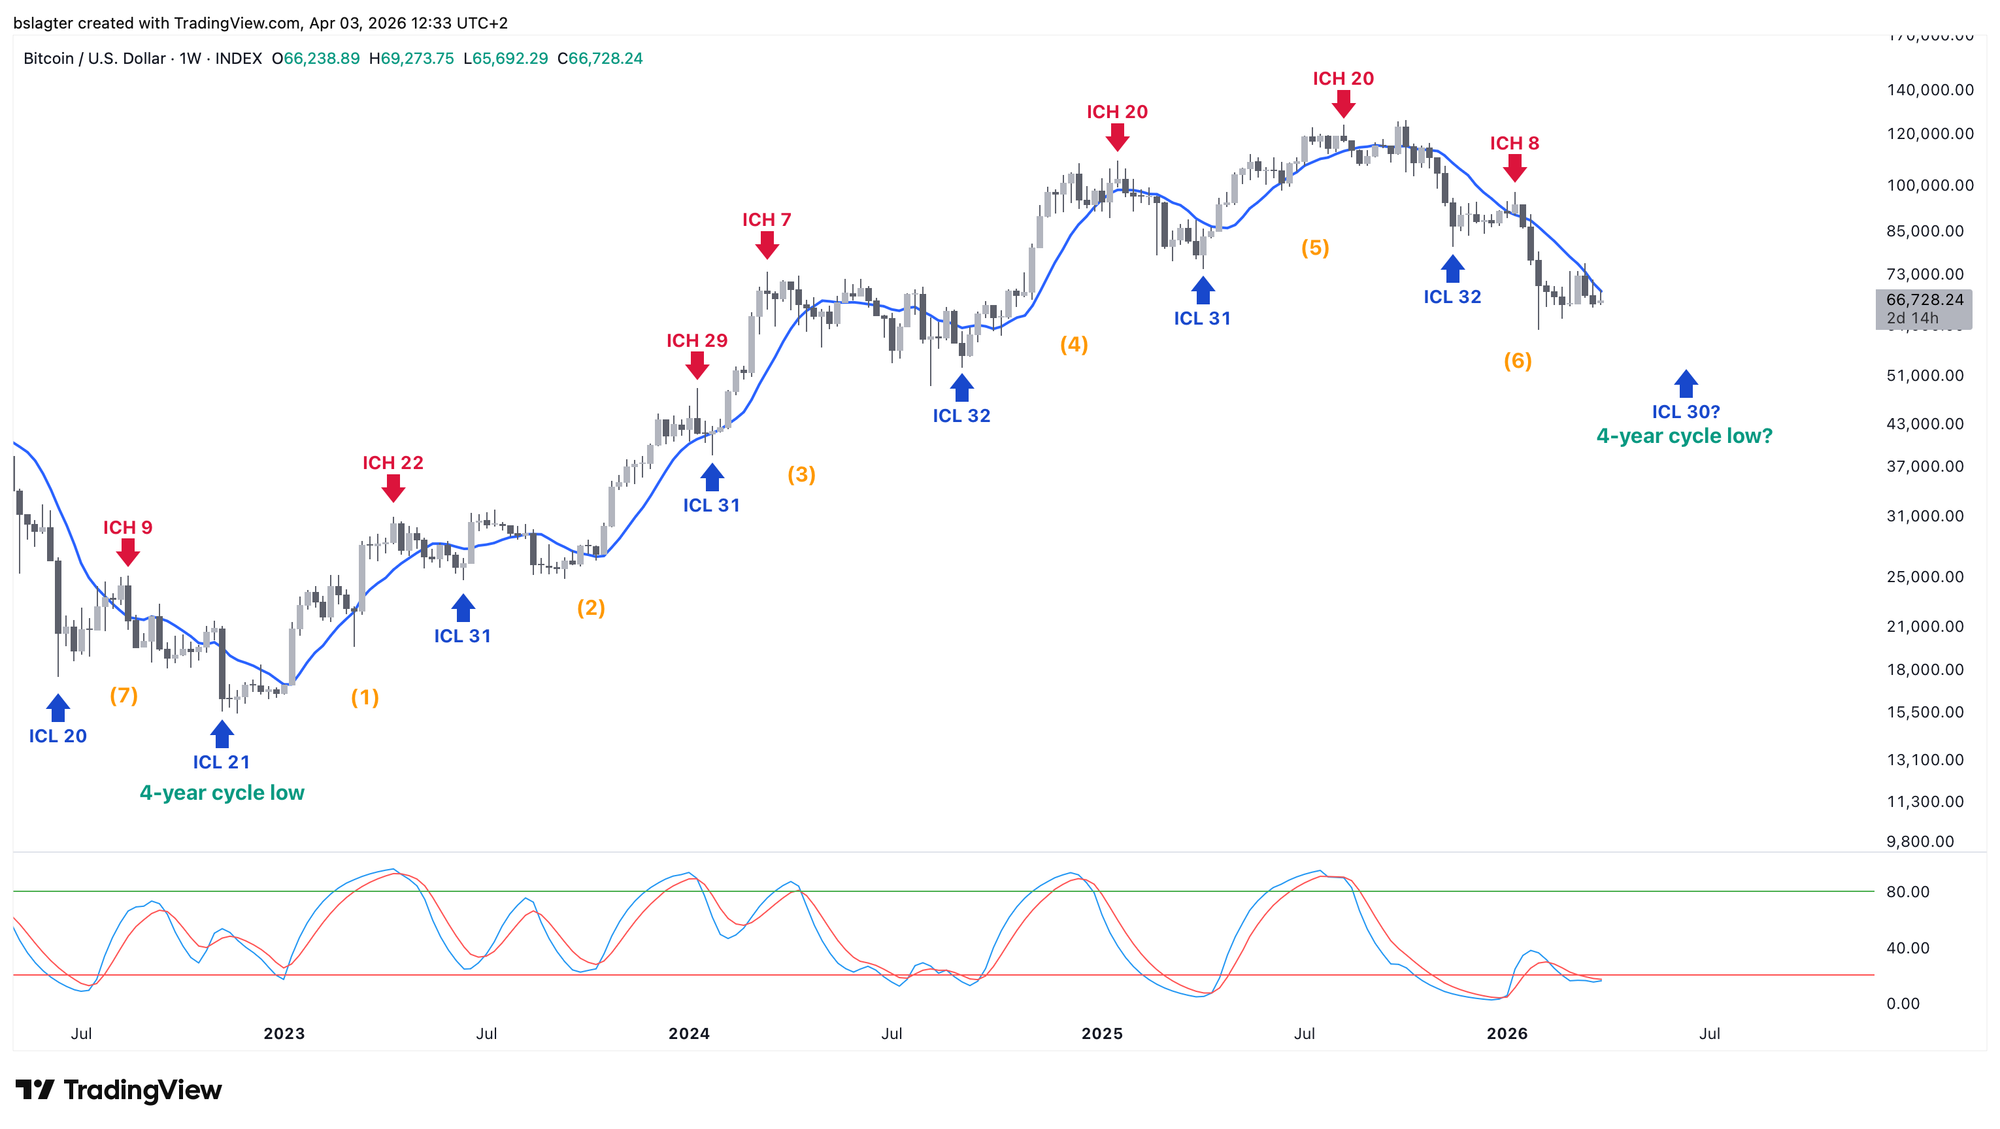
The base case we concluded with above is visualized in the weekly chart below. It's the scenario we laid out on November 14 under the title 'a mild bear market.'
The deepest point that still fits this scenario is the zone around $48,000, which has played an important role in recent years. It was the top after the Ukraine war in 2022, the top after the ETF launch in January 2024, and the bottom during the Yen crisis in August 2024.
The 50-week moving average has been a reliable dividing line between bull and bear markets in recent years. That line currently sits at $97,000, which is still quite high, but will drop significantly in the coming months. If price stays around $67,000, the 50-week average will fall to $85,000 within three months. For investors looking to follow the market cycle, that would be an attractive entry point.
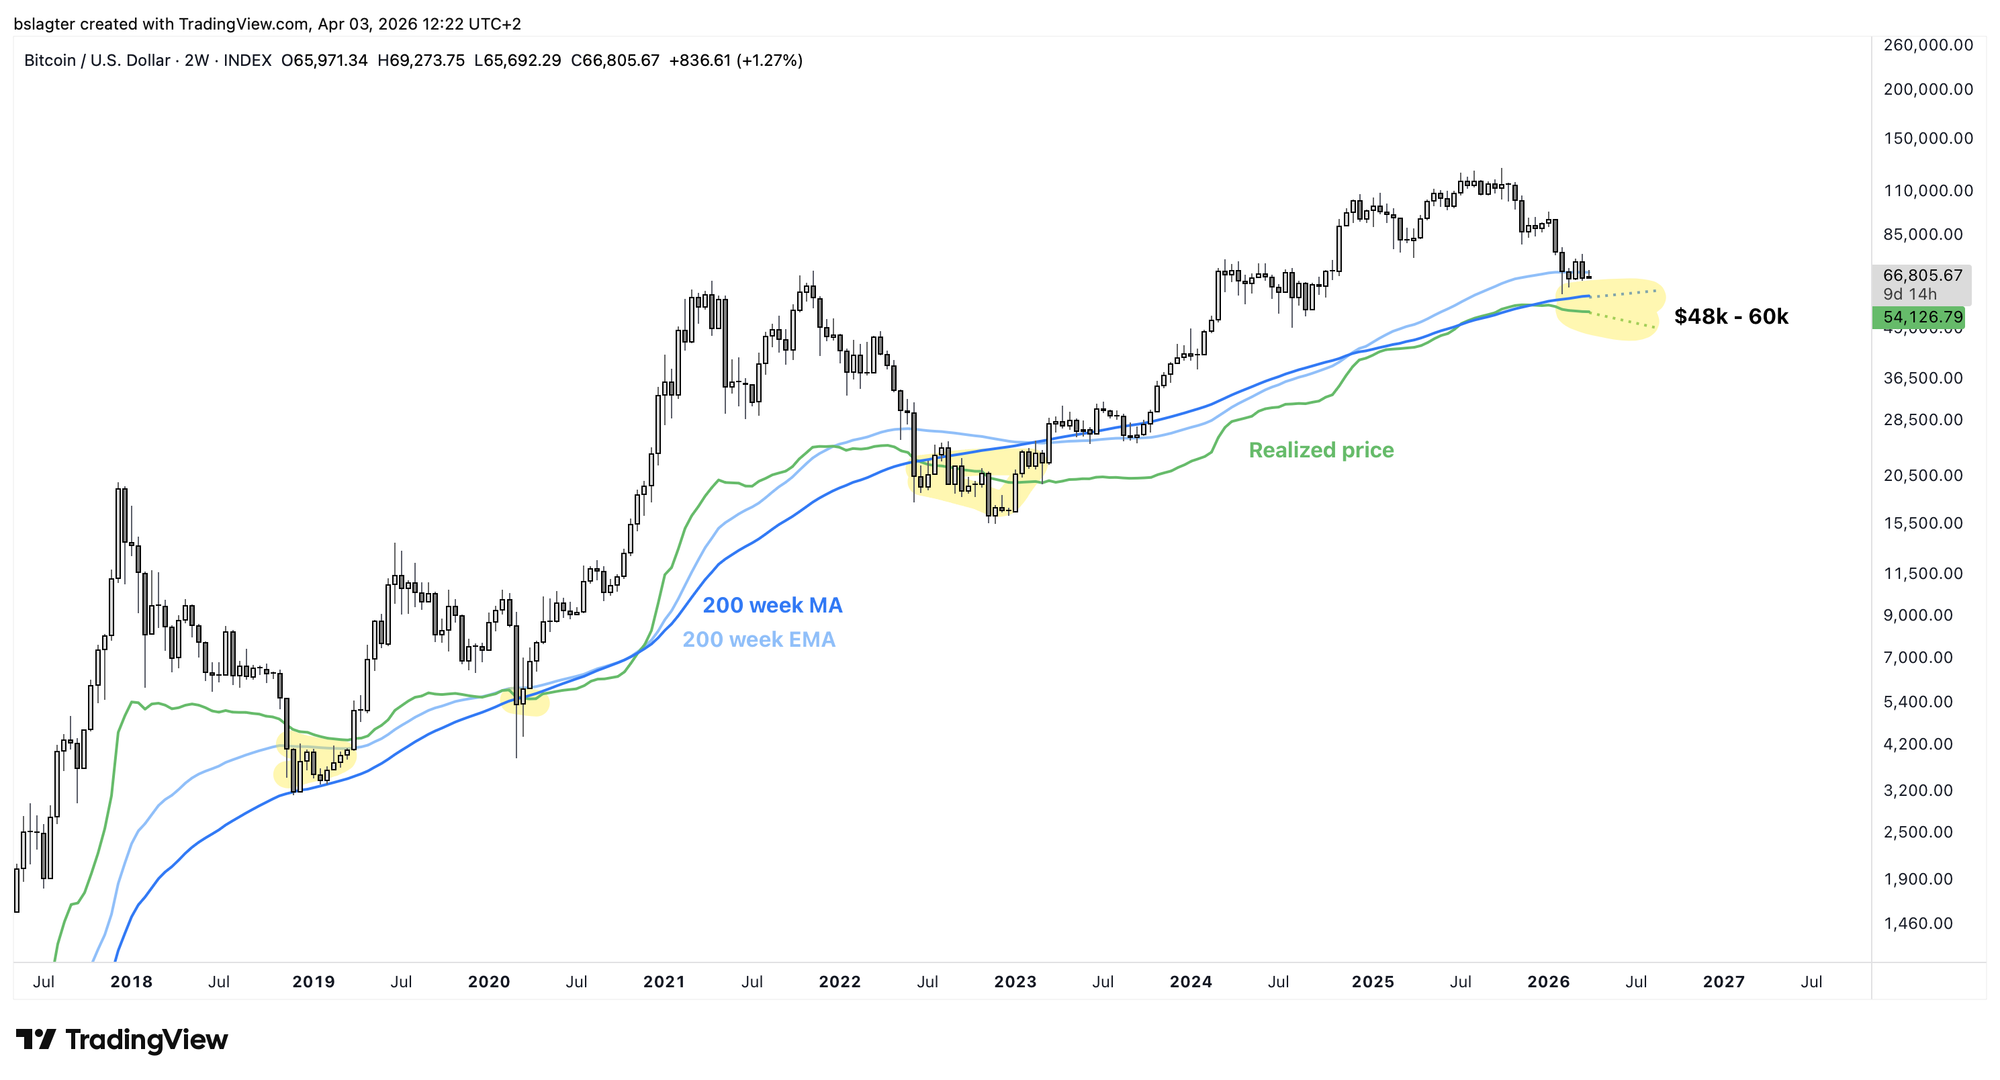
We often mention the $48,000 to $60,000 zone as interesting for a bottom. The chart below shows why. That's where the 200-week moving average and the realized price run. These have consistently formed the bottom in previous cycles.
The logic behind it is that around that price level, investors have barely any profit left to take (supply drops) and it starts feeling cheap enough to buy again (demand rises).
We're in week 19 of the weekly cycle, which has averaged about 30 weeks recently. The top was likely already in at week 8, and we're now heading toward a weekly cycle low (ICL).
It occasionally happens that the ICL is not the lowest point of the cycle — we see a decline that fits the timing, but price doesn't quite break below a prior low. But that's exceptional. We therefore expect lower prices by the end of the second quarter.
It's entirely possible that the ICL will also turn out to be the YCL — the bear market bottom, in other words. That would be the perfect outcome. But it's wise to account for the alternative: another (short) weekly cycle in the second half of this year. That would fit with a possible deepening and prolongation of the war in the Middle East.
On the weekly chart, we often see divergences forming around turning points. Bearish divergence at the top and bullish divergence at the bottom. Price prints a lower low while other data makes a higher low.
On the chart above, this could develop with the momentum indicator at the bottom, the DSS Bressert. The MACD and RSI are also good candidates.
Below you see the Fear & Greed Index. It has accurately captured the last three turning points with clear divergence. A daily or weekly close around $60,000 in June would be sufficient.
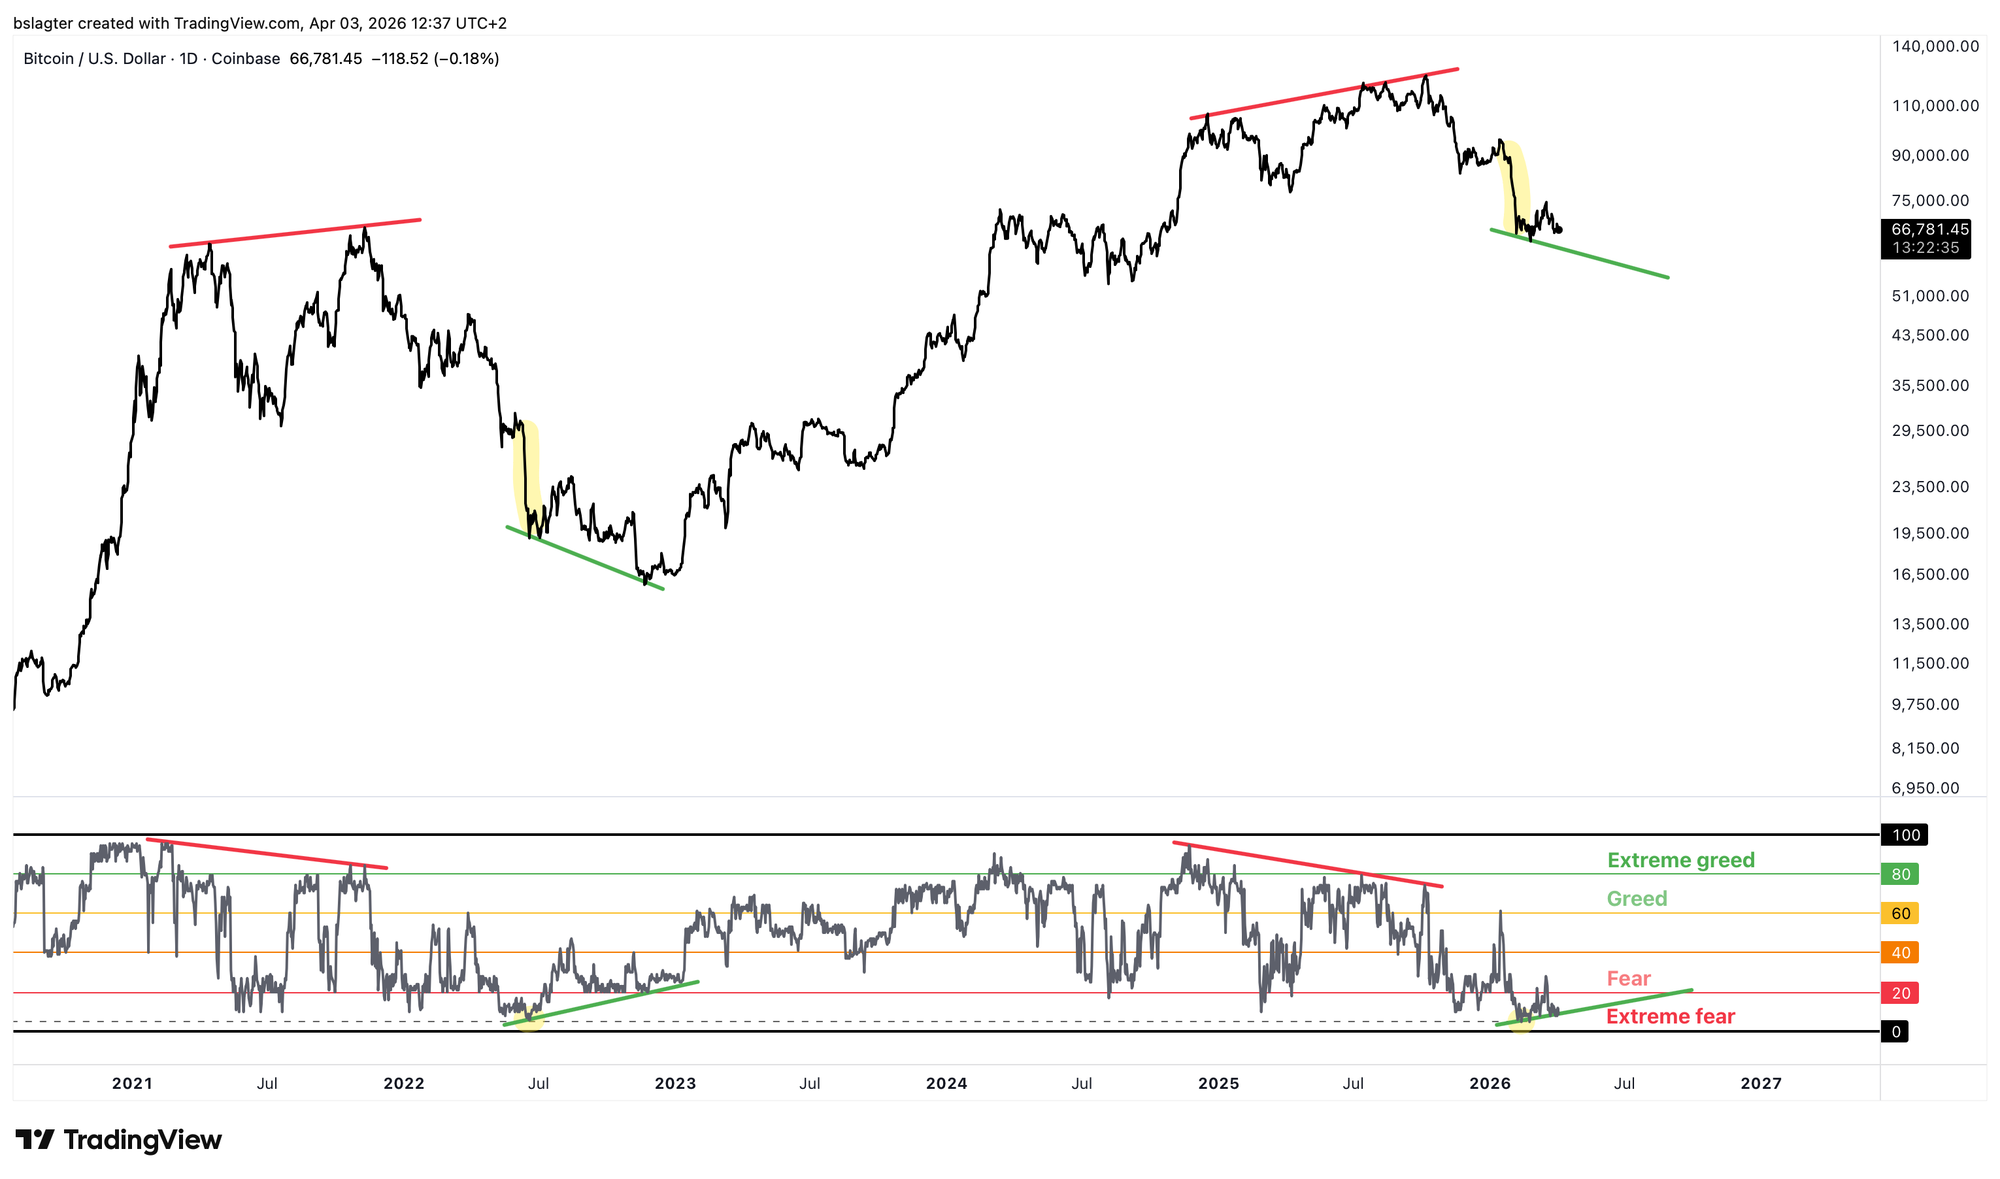
Like the monthly chart, the weekly chart still has some room for this bear market to develop further. An interesting period is the end of the second quarter. An ICL with bullish divergence across multiple indicators would be a powerful signal.
3️⃣ On-chain data
Bert
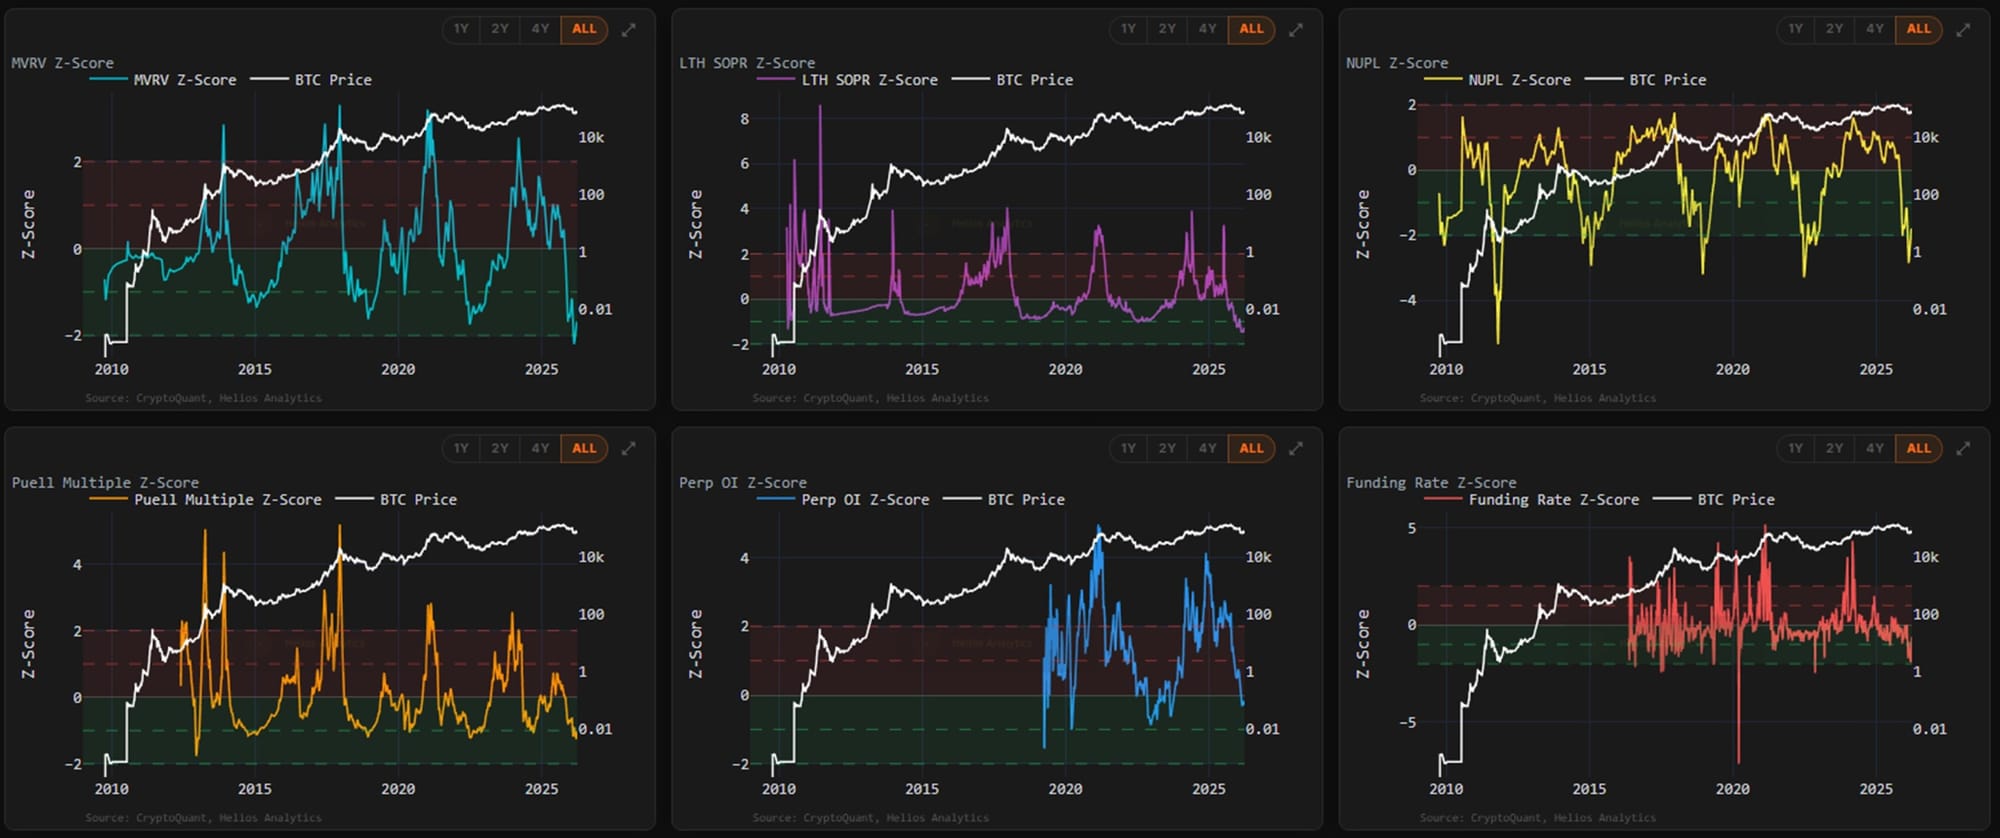
When hunting for tops and bottoms, you could distinguish two types of on-chain indicators. Prices such as the realized price or the true market mean, and positioning metrics such as MVRV, NUPL, and SOPR. In the latter category, we find high readings near tops and low readings near bottoms.
Jamie Coutts, analyst at Real Vision, shared the dashboard below with six such indicators. Here's what he had to say:
Bitcoin value zones are probabilistic, not precise. The same Z-score readings that look like a floor today were sometimes weeks, sometimes months from the actual low in prior cycles. The point is BTC should be close to its trough.
Close to a bottom, with a margin of several months. A more cautious interpretation is that on-chain data shows no need for further market deterioration to form a bottom pattern — but it's not ruled out either.
4️⃣ Geopolitics & the stock market
Bert
Dario Caldara and Matteo Iacoviello, two economists at the U.S. Federal Reserve, have been producing the Geopolitical Risk Index (GPR) for years. They do so by analyzing newspaper content. To obtain a long data series, they went all the way back to 1900. A chart with their data is shown below.
The war in Iran ranks as the second-highest since World War II and is comparable to the September 11, 2001 attacks.
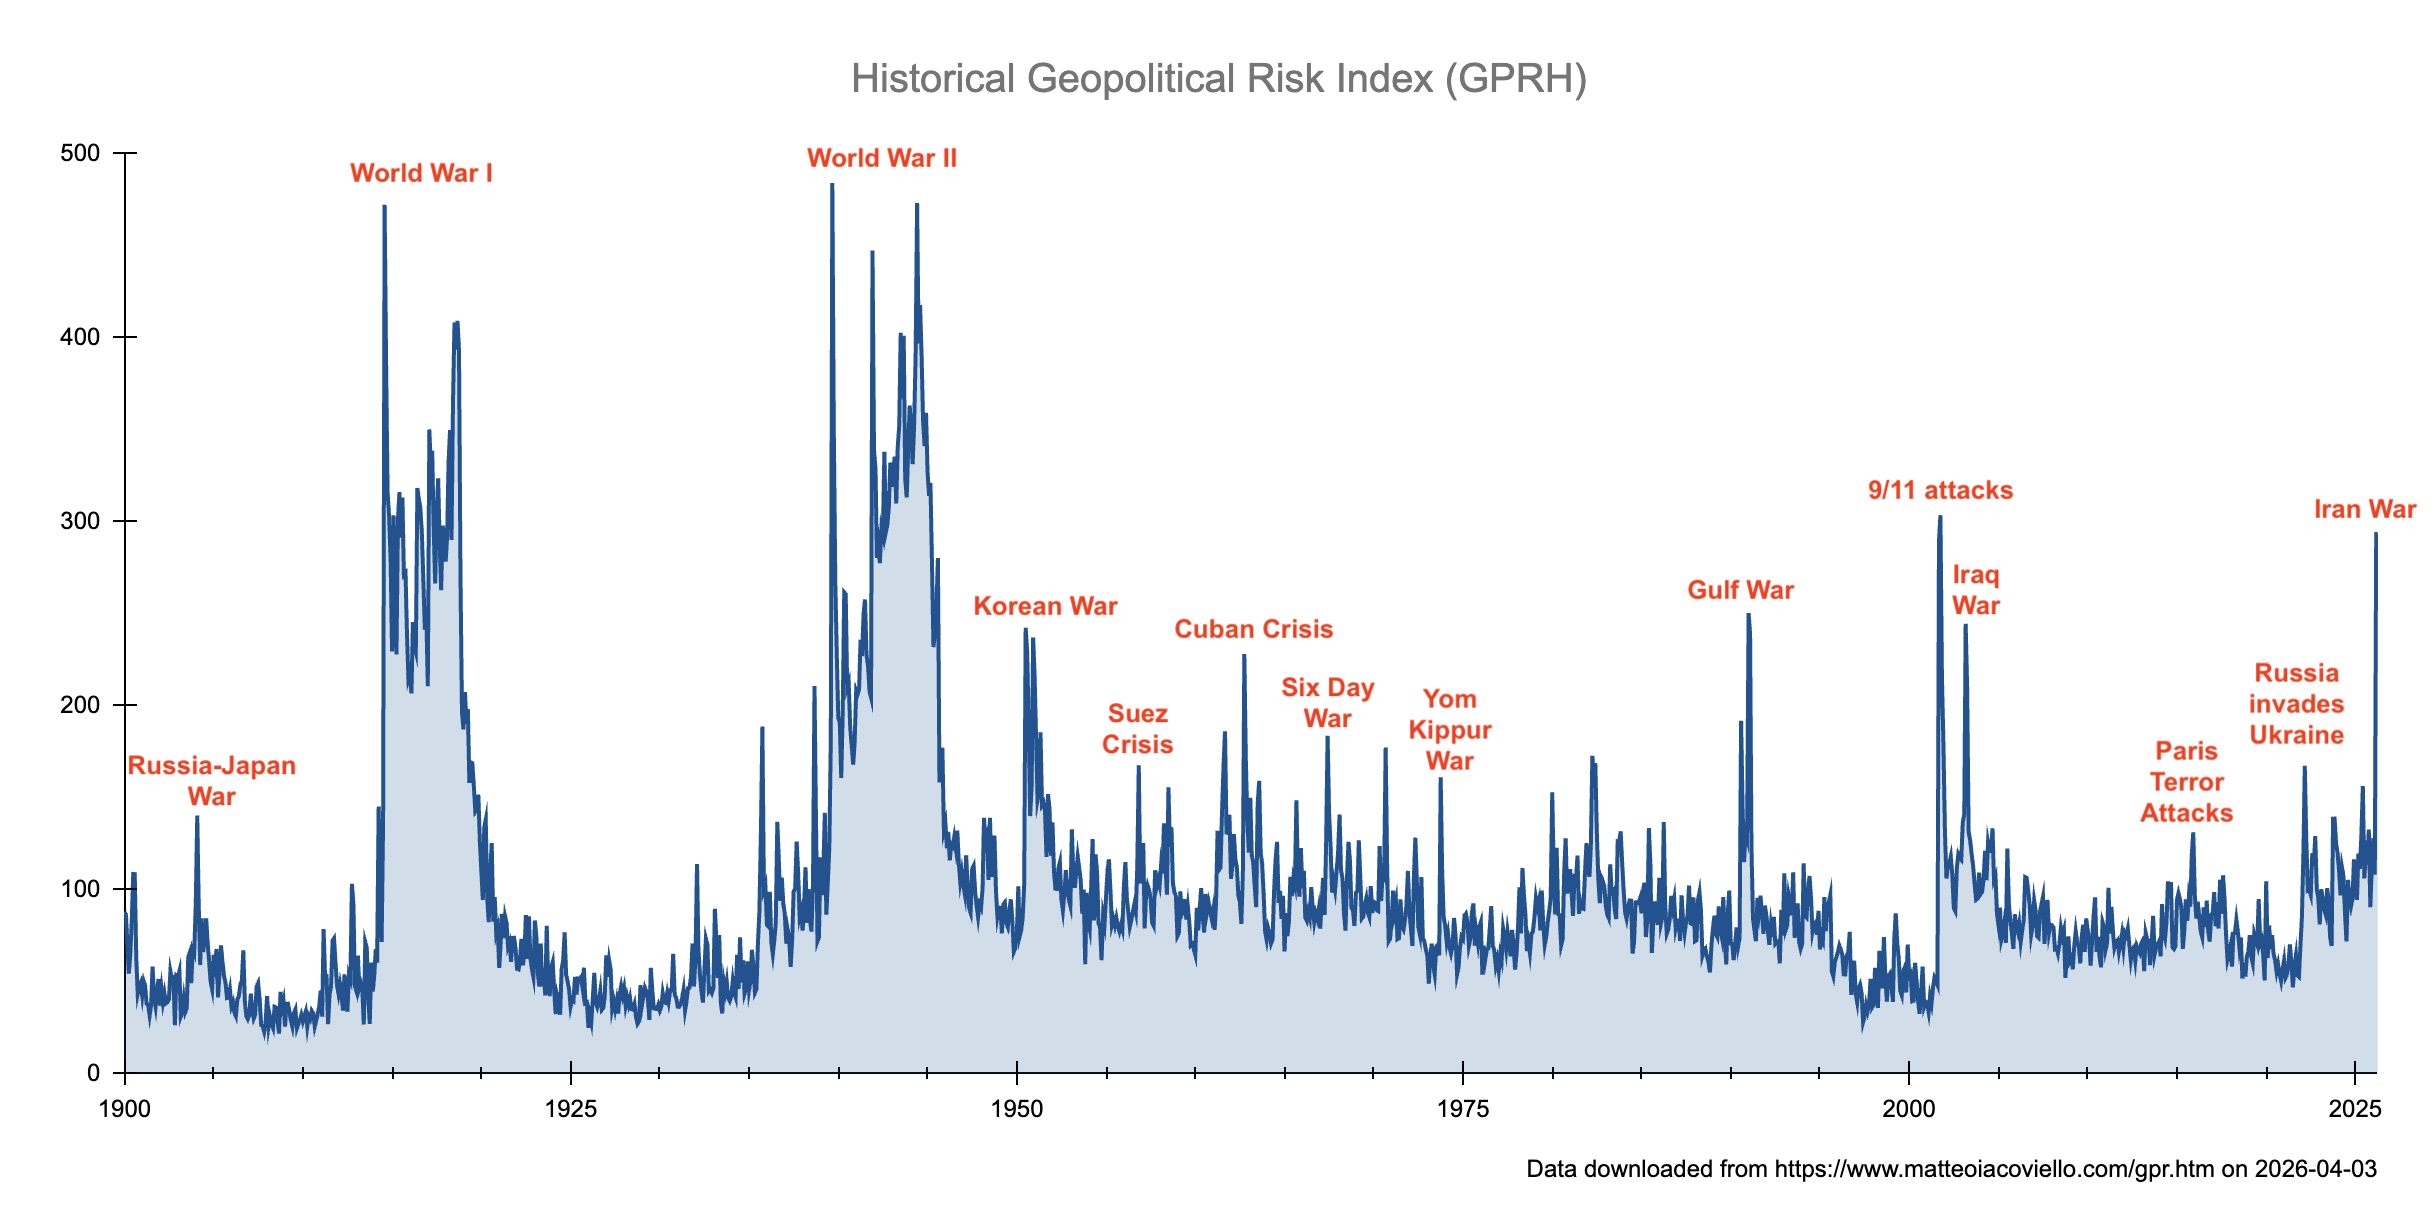
As with many things in economics, it's not just the magnitude that matters, but also the duration. That's the biggest uncertainty right now. If the conflict ends soon, markets will shake off the damage and treat it as a one-off, temporary shock.
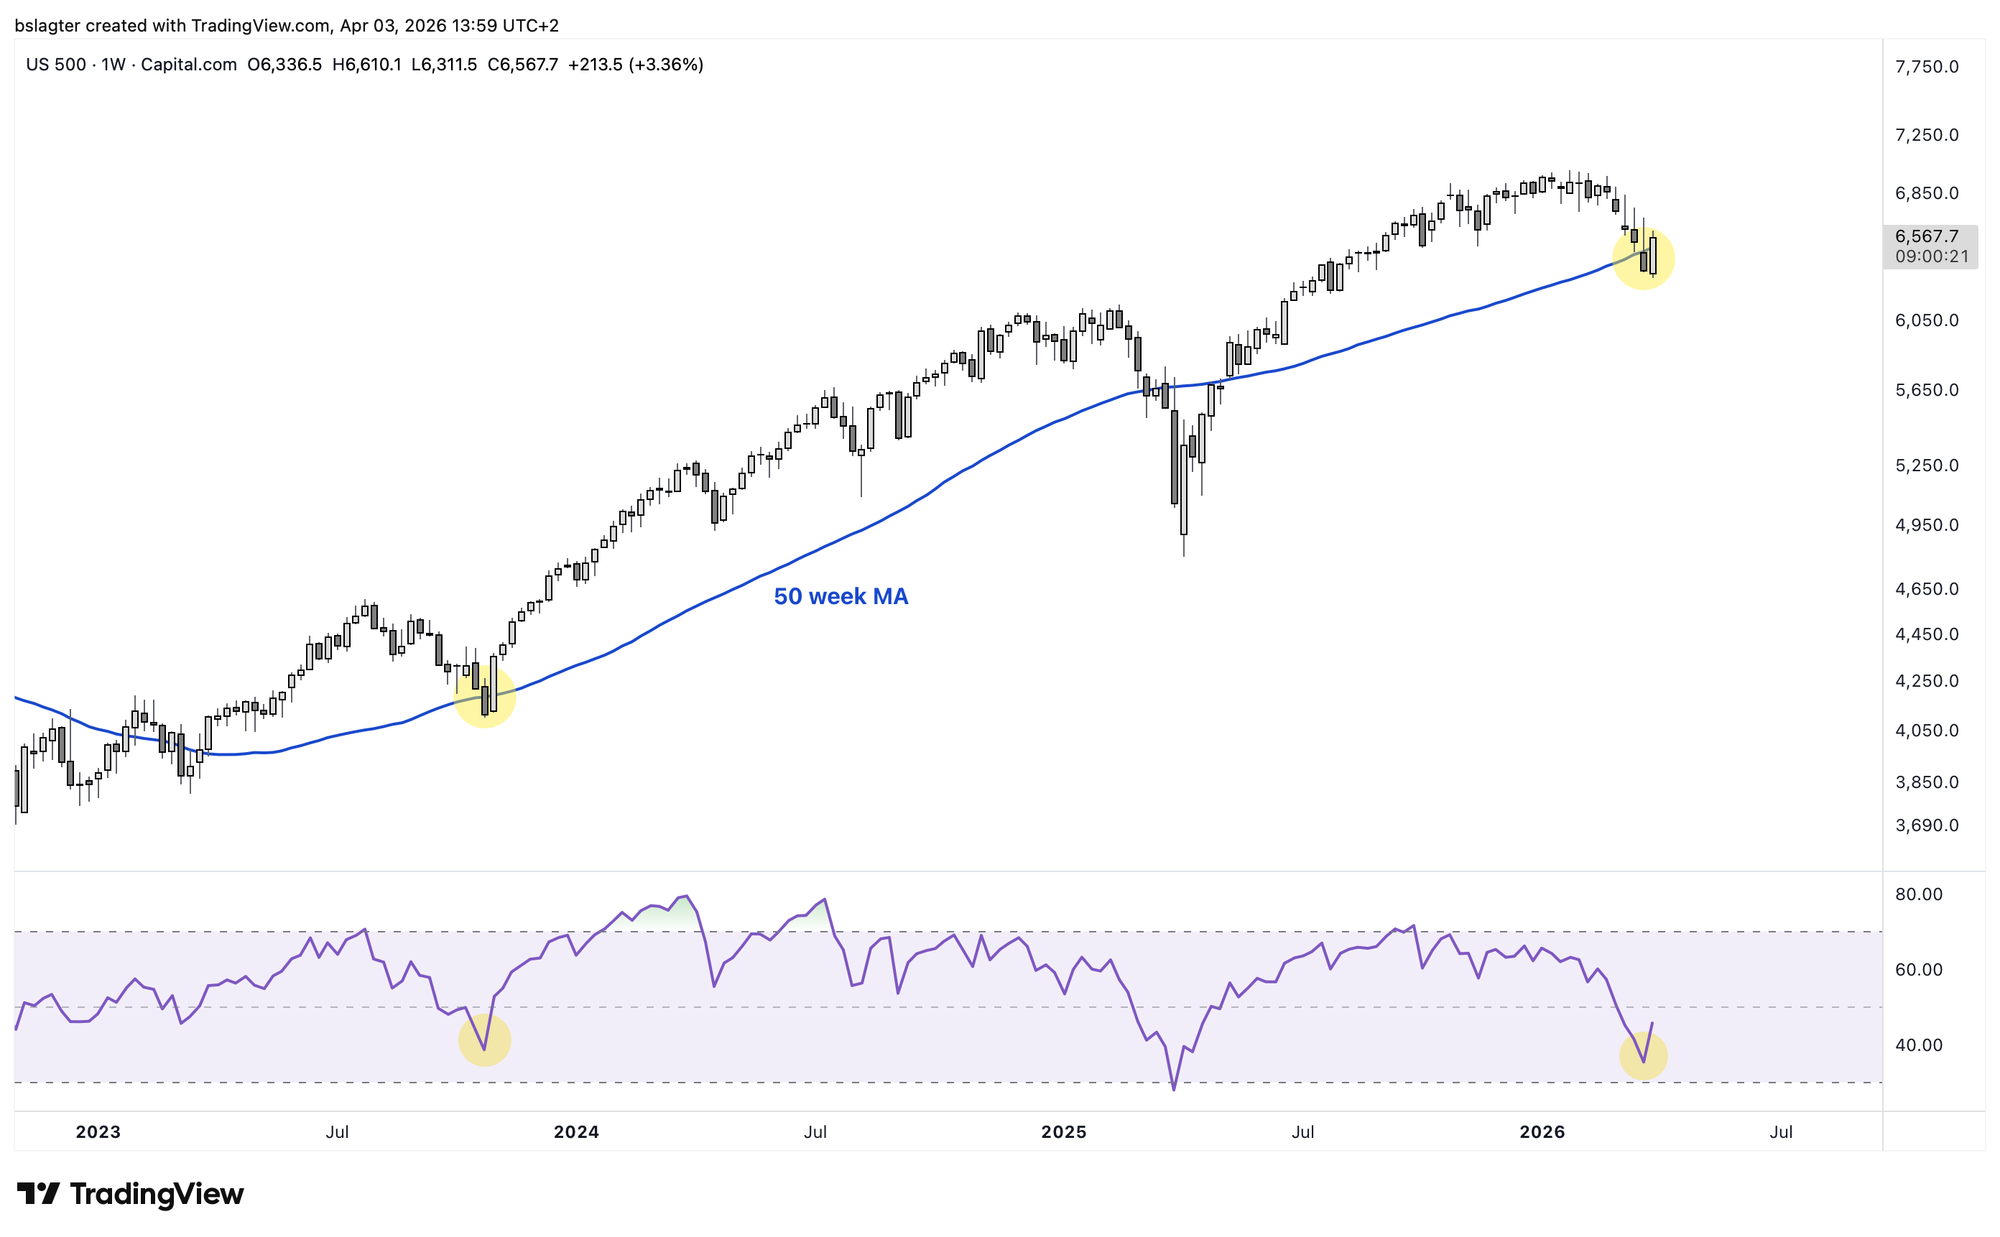
That uncertainty is reflected in the stock chart. Equities are flirting with their dominant moving averages. They're declining toward support levels. On the threshold of a serious shift into a bear market, but also poised for a new period of gains. The S&P 500 currently has a setup similar to October 2023.
The question is whether investors have enough patience and pain tolerance to wait a few more weeks for the promised end of the war. We're curious to find out!
'Are we there yet?'
Probably not. There's a strong chance we'll be stuck in the bear market for at least two more months. To kick off a new bull market right now would require a major positive shock, and that doesn't seem to be on the horizon.
Now let's move on to three contributions from Thom and Sam.
5️⃣ End of the Iran war won't save bitcoin
Thom
While the war in Iran dominates the headlines, a swift end to the conflict doesn't automatically mean a new bull run begins. That sentiment sometimes seems to prevail, because at moments like these the war is all anyone talks about.
Risk appetite among investors was already low before the war began. Bitcoin was already unmistakably in a bear market, and many other assets at the far end of the risk spectrum were also performing poorly.
What was missing was confidence and hunger for risk — two prerequisites for a real bull run. To bring those back, a new positive catalyst is needed. It seems unlikely to me that a reopening of the Strait of Hormuz would be that catalyst.
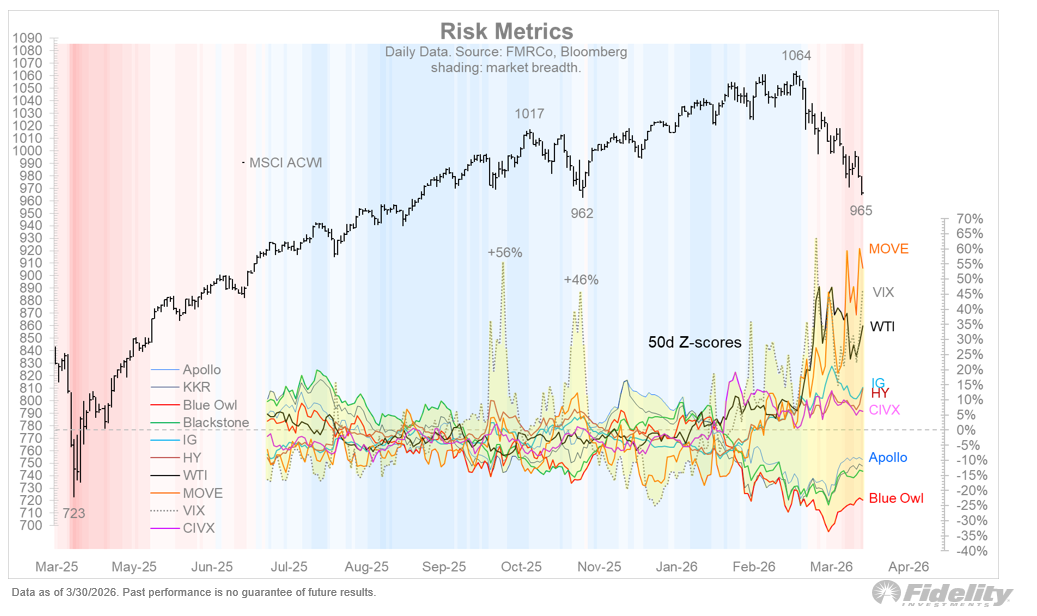
Right now we're seeing volatility indices explode and credit spreads widen rapidly. The chart below, in the yellow shaded area at the bottom, groups several of them together.
They indicate that there's a brake on the growth of global liquidity. That brake was already on before the Iran war, which makes it illogical to assume that the end of the conflict would suddenly cause investors to hit the gas again.
We haven't seen real panic yet. Despite all the turmoil and uncertainty, the S&P 500 has dropped by 10%. In early 2025, the avalanche of import tariffs caused a 20% decline.
I therefore wouldn't be surprised if we see a deeper sell-off. In that case, it would be remarkable if bitcoin escaped unscathed. For me, that's a reason not to allocate extra capital at this stage.
There are many risks hanging over the market, and even if they're resolved, it's unclear to me which catalyst could immediately trigger a bull market. In that regard, I don't think it pays to step in right now. That could change if we see a deeper crash and bitcoin puts in a lower bottom.
6️⃣ U.S. Treasury volatility is bad news for bitcoin
Thom
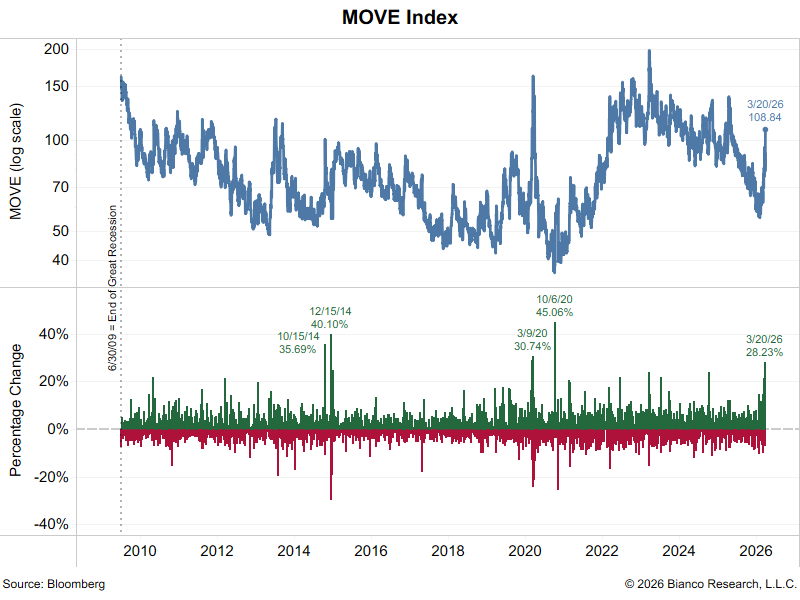
On Friday, March 20, implied volatility in the U.S. bond market (MOVE) suddenly exploded by 28%. That was the largest spike since October 2020. Since the 2008 financial crisis, there have been only four trading days on which the MOVE index surged even more.
This matters for bitcoin because the bond market remains the beating heart of the global financial system. U.S. Treasuries are the most important collateral in many forms of short-term funding, such as the repo market.
When that collateral becomes volatile, its value for that specific function declines. Imagine, for example, that the housing market were extremely volatile, and it were perfectly normal for home prices to swing 10 to 15 percent per day. In that world, it would be far less attractive for banks to issue mortgages.
The same applies to U.S. Treasuries. If they become more volatile, their value as collateral decreases. This effectively acts as a brake on global liquidity. With the same Treasuries as collateral, you can suddenly borrow less capital.
For equities, that's already troublesome, but for bitcoin it's usually even worse. In practice, bitcoin often doesn't behave as a safe haven, but rather as an asset that thrives on ample liquidity, optimism, and high risk appetite.
In that respect, it's crucial for bitcoin and other risk assets that this index stabilizes. In a volatile world, it's simply harder to build toward a brighter future. These are the concrete dynamics we're referring to when we say financial conditions are tightening.
7️⃣ Warning signals from other markets
Sam
Although bitcoin has been trading sideways between $60,000 and $72,000 for two months now, the downtrend that preceded this range is still intact.
Every attempt to break out to the upside has failed so far, and with each failure, the odds increase that we'll test the other side of the range — namely the $60,000 level.
Beyond bitcoin's own weakness, a few other markets are also flashing warning signals. U.S. stock indices, for instance, are now also in a downtrend.
Another important market that many investors watch closely is the oil market. Due to the conflict in the Middle East, oil prices have surged significantly. Trump regularly signals on social media that negotiations with Iran are going well, and while oil prices drop sharply in the moment, crude is already trading back above $100.
High oil prices don't just cause pain at the pump — they're also felt indirectly through higher production and transportation costs for goods. If oil prices stay elevated for longer, that fuels inflation, potentially leading to interest rate hikes.
Another market to keep an eye on is the DXY, or Dollar Index. This measures the value of the dollar against a basket of other major currencies, including the euro, yen, and pound. When the DXY rises, the dollar is getting stronger or the other currencies are getting weaker.
In the chart below, you can see that the DXY has been moving sideways since July 2025 between the yellow lines. Price is currently pressing against the upper boundary of the range. If it breaks out to the upside and eventually clears the lower white line, it could trigger a significant dollar rally.
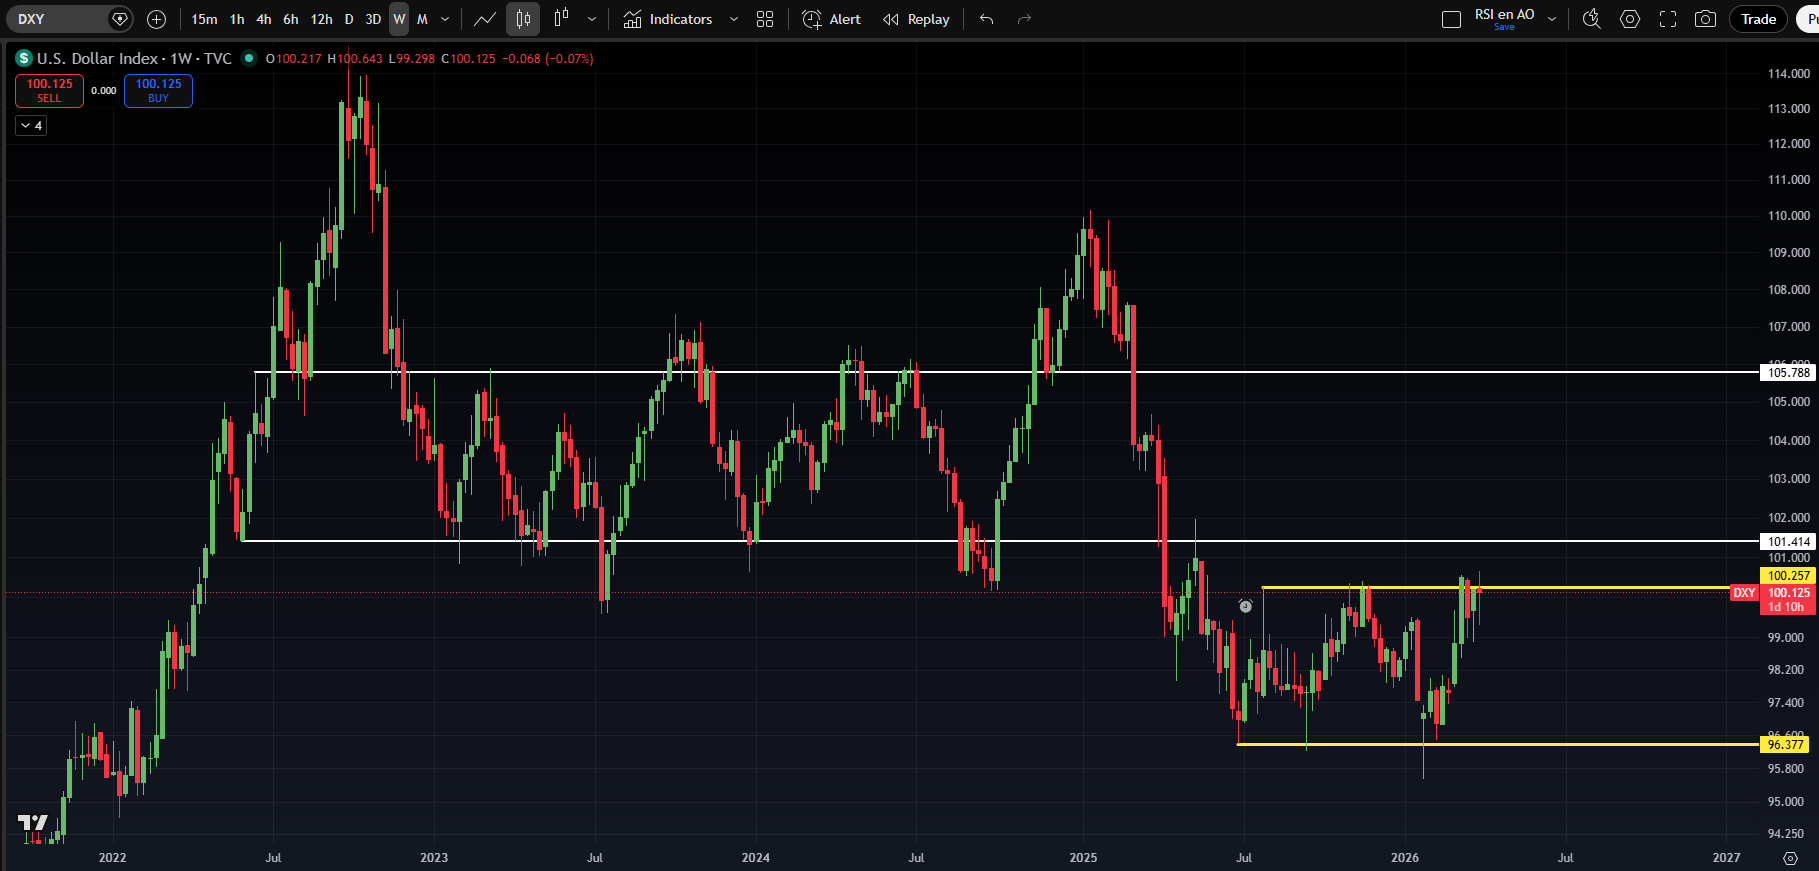
This matters for two reasons. First, we measure bitcoin against the dollar — it's essentially a fraction with the dollar as the denominator. If the denominator rises in value but the numerator (bitcoin) doesn't, the bitcoin price in dollar terms falls.
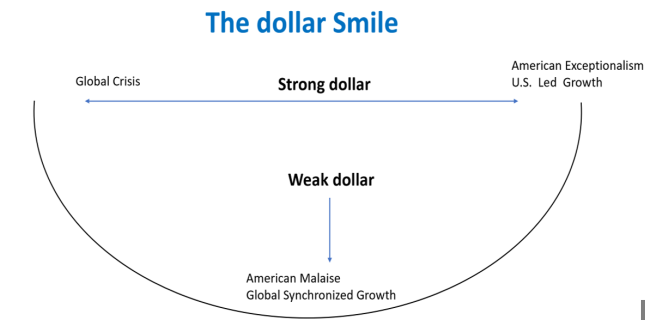
The second reason is known as the 'Dollar Smile Theory.' This theory by Stephen Jen posits that the dollar strengthens in two extreme economic scenarios: fear/recession or U.S. economic strength. Given all the uncertainty and falling stock markets, the market appears to be pricing in the first scenario in particular.
In closing
All previous editions of Alpha Markets can be found in the archive. Questions, comments, and suggestions are always welcome in the community.
Thank you for reading!
To stay informed about the latest market developments and insights, follow our team members on X:
- Bart Mol (@Bart_Mol)
- Peter Slagter (@pesla)
- Bert Slagter (@bslagter)
- Mike Lelieveld (@mlelieveld)
We appreciate your continued support and look forward to bringing you more comprehensive analysis in our next edition.
Until then!