All Your Models Are Destroyed
Bitcoin drifted sideways around $88k last week. For the first time ever, we closed the third year of the market cycle in the red. Quite a few models have been shattered!

On October 20, 2020, Michael Saylor was a guest on Hedgeye CEO Keith McCullough's show to talk about bitcoin. MicroStrategy had made its first major bitcoin purchases in the months prior: 425 million dollars.
The story was simple. We're sitting on hundreds of millions of dollars in cash, and its purchasing power is melting away. Especially when you measure it against what we as a company want to buy with it in the future. Acquiring a company? That costs 10-15% more every year. So we're looking for something that can't be printed indefinitely and that a company is allowed to hold. The outcome was a 'digital commodity', namely bitcoin.
In his conversation with Keith McCullough, Saylor said this:
Now, what happens to all these wonderful models if ten billionaires decide to buy one billion dollar of bitcoin each, and announce we bought it? We're not ashamed of it. We're going to buy more. All your models are destroyed, completely devastated. Bitcoin goes to the moon.
In 2020 and 2021, Saylor was convinced that others would soon follow. The thesis was self-evident, wasn't it? Ten billionaires, ten publicly traded companies, ten governments. And then a hundred, a thousand, and a million. "We're going up forever, Laura."
A good five years later, we have to conclude that Saylor may have been right about the idea—time will tell—but he was certainly wrong about the timing.
In 2024 and 2025, 'bitcoin as digital gold' made the cautious transition from pioneers to the early majority. Only now is it acceptable to hold a bit of bitcoin as part of a diversified portfolio. The moment when ten billionaires, S&P 500 companies, and governments buy a billion dollars worth of bitcoin, and proudly talk about it, still lies (far) in the future.
"All your models are destroyed" became a battle cry among bitcoiners. Often with "to the upside" added.
The sober facts, however, are that bitcoin and the broader crypto sector have underperformed the hype and hopes on many metrics in recent years. Price, hashrate, transactions. Publicly traded companies with bitcoin on the balance sheet. The Coinbase app's position in the app stores. Governments and central banks 'bending the knee'.
Indeed, quite a few models have been destroyed, but "to the downside."
Let's be clear that there's nothing wrong with models failing: "All models are wrong, but some are useful." They travel with you for a while, so to speak. The art is knowing when to say goodbye.
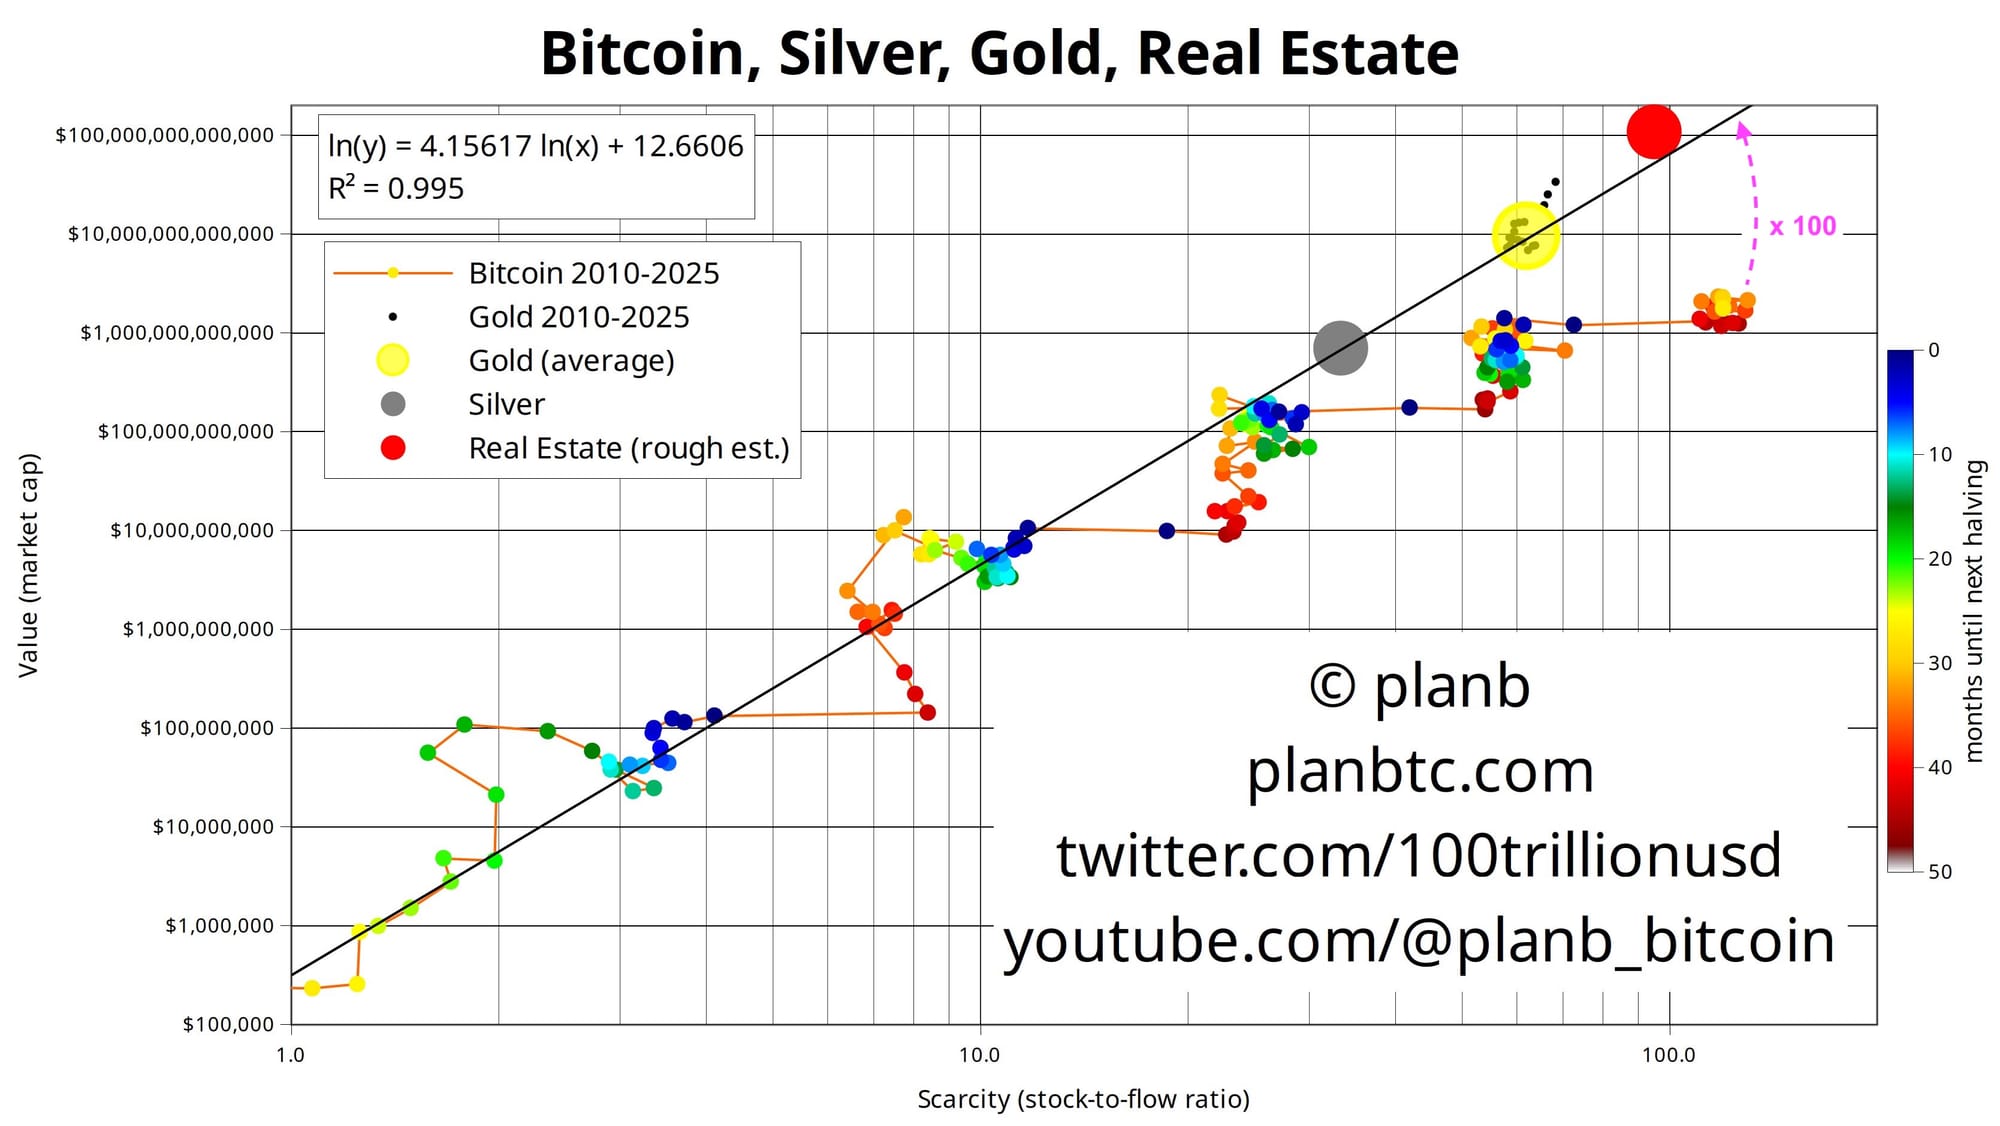
The halving cycle is one example—the idea that bitcoin's market cap rises significantly in response to the halving due to increased scarcity. This idea was popularized in 2019 by Plan B with the stock-to-flow model.
That this model would eventually fail was obvious. Mathematically, market cap simply can't keep 10x-ing every four years indefinitely. But also conceptually. The model only looks at the supply side, while the demand side is equally relevant for the price. We wrote about this in our Alpha Markets piece on March 31, 2023: A shortage of bitcoin.
Plan B himself still clings to his framework. Bitcoin's market cap is now 100 times lower than what the S2FX model predicts. That's evident from the chart he posted on X this week, with the analysis: "IMO bitcoin is extremely undervalued."
This fits well with a technology maturing. Two weeks ago in Crossing the chasm, we discussed the transition from early adopters to the early majority. Another lens to view this through is the Hype Cycle.
Research and advisory firm Gartner has been visualizing its analysis of technological development with this curve for thirty years. They plot innovations on the curve, which they've divided into five phases.
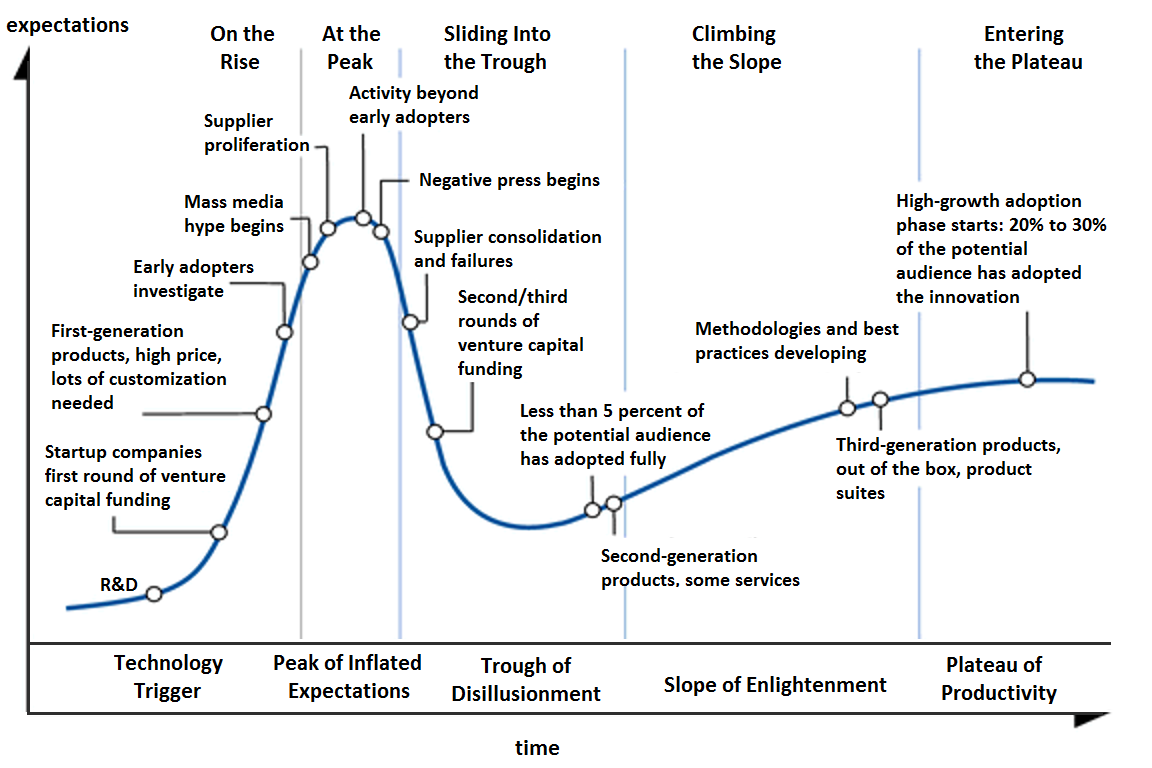
We're all familiar with the 'peak of inflated expectations'—that's where we see the completely unrealistic expectations that come with the hype and euphoria of the bull market. ICOs, NFTs, and memecoins are going to change the world! You could place Saylor's statements from 2020 and 2021 there as well.
The leap to the masses happens when technology moves through the 'trough of disillusionment' toward the 'slope of enlightenment.' When that succeeds, new technology escapes the early adopters and becomes good enough for the masses. Many ideas, however, perish in the chasm and die a quiet death.
We believe that bitcoin (as digital gold) and stablecoins (as digital dollars) are the first two applications to actually make it through the trough of disillusionment, and have begun the long journey toward the plateau of productivity.
It's not surprising that during this transition we're settling accounts with old patterns and expectations. Like the idea that the price always rises for three consecutive years and then falls for one year. With the 2025 year-end close in the books, that idea is also debunked: 🟢 🟢 🔴.
We're very curious what 2026 will bring us.
It seems reasonable to expect that the character of the crypto market has changed, and that comparisons with the past will often fall short.
What remains is the market where buyers and sellers meet. They're different players than a few years ago, with different considerations and convictions, on different exchanges. But the analysis has been the same for a hundred years. Just as the wind creates the same patterns in sand dunes all over the world, recognizable patterns also emerge on charts wherever people trade with each other.
Let's dive into the charts.
As expected, it was quiet in the crypto market this past week. The price hovered around $88,000.
The short-term trend is still down. We're below the moving averages that guide this trend. A breakout above the fan of descending lines on the chart below would confirm a new rising short-term trend.
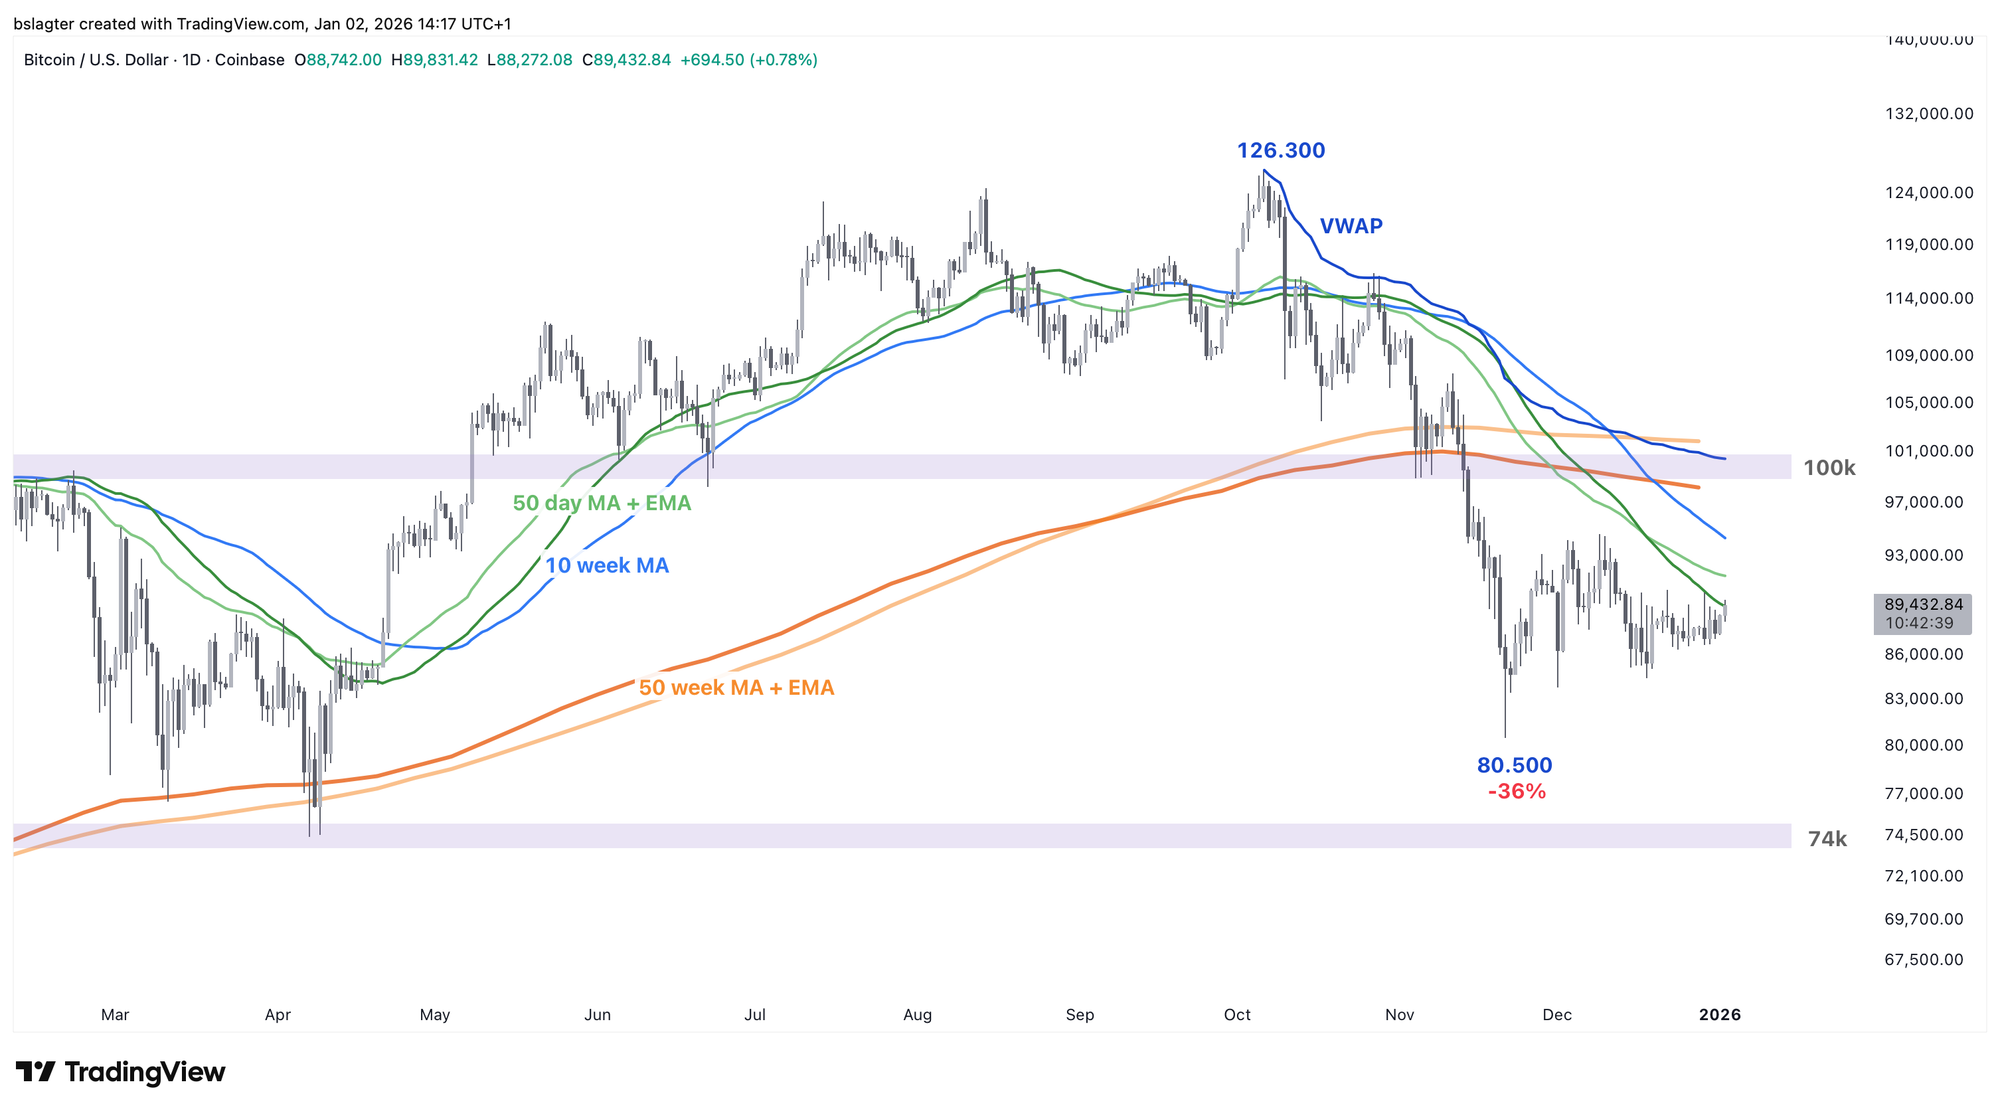
It won't be long before the market picks a direction. First to 100k or first to 74k? I posed this question in Discord, and the responses were roughly split 50/50.
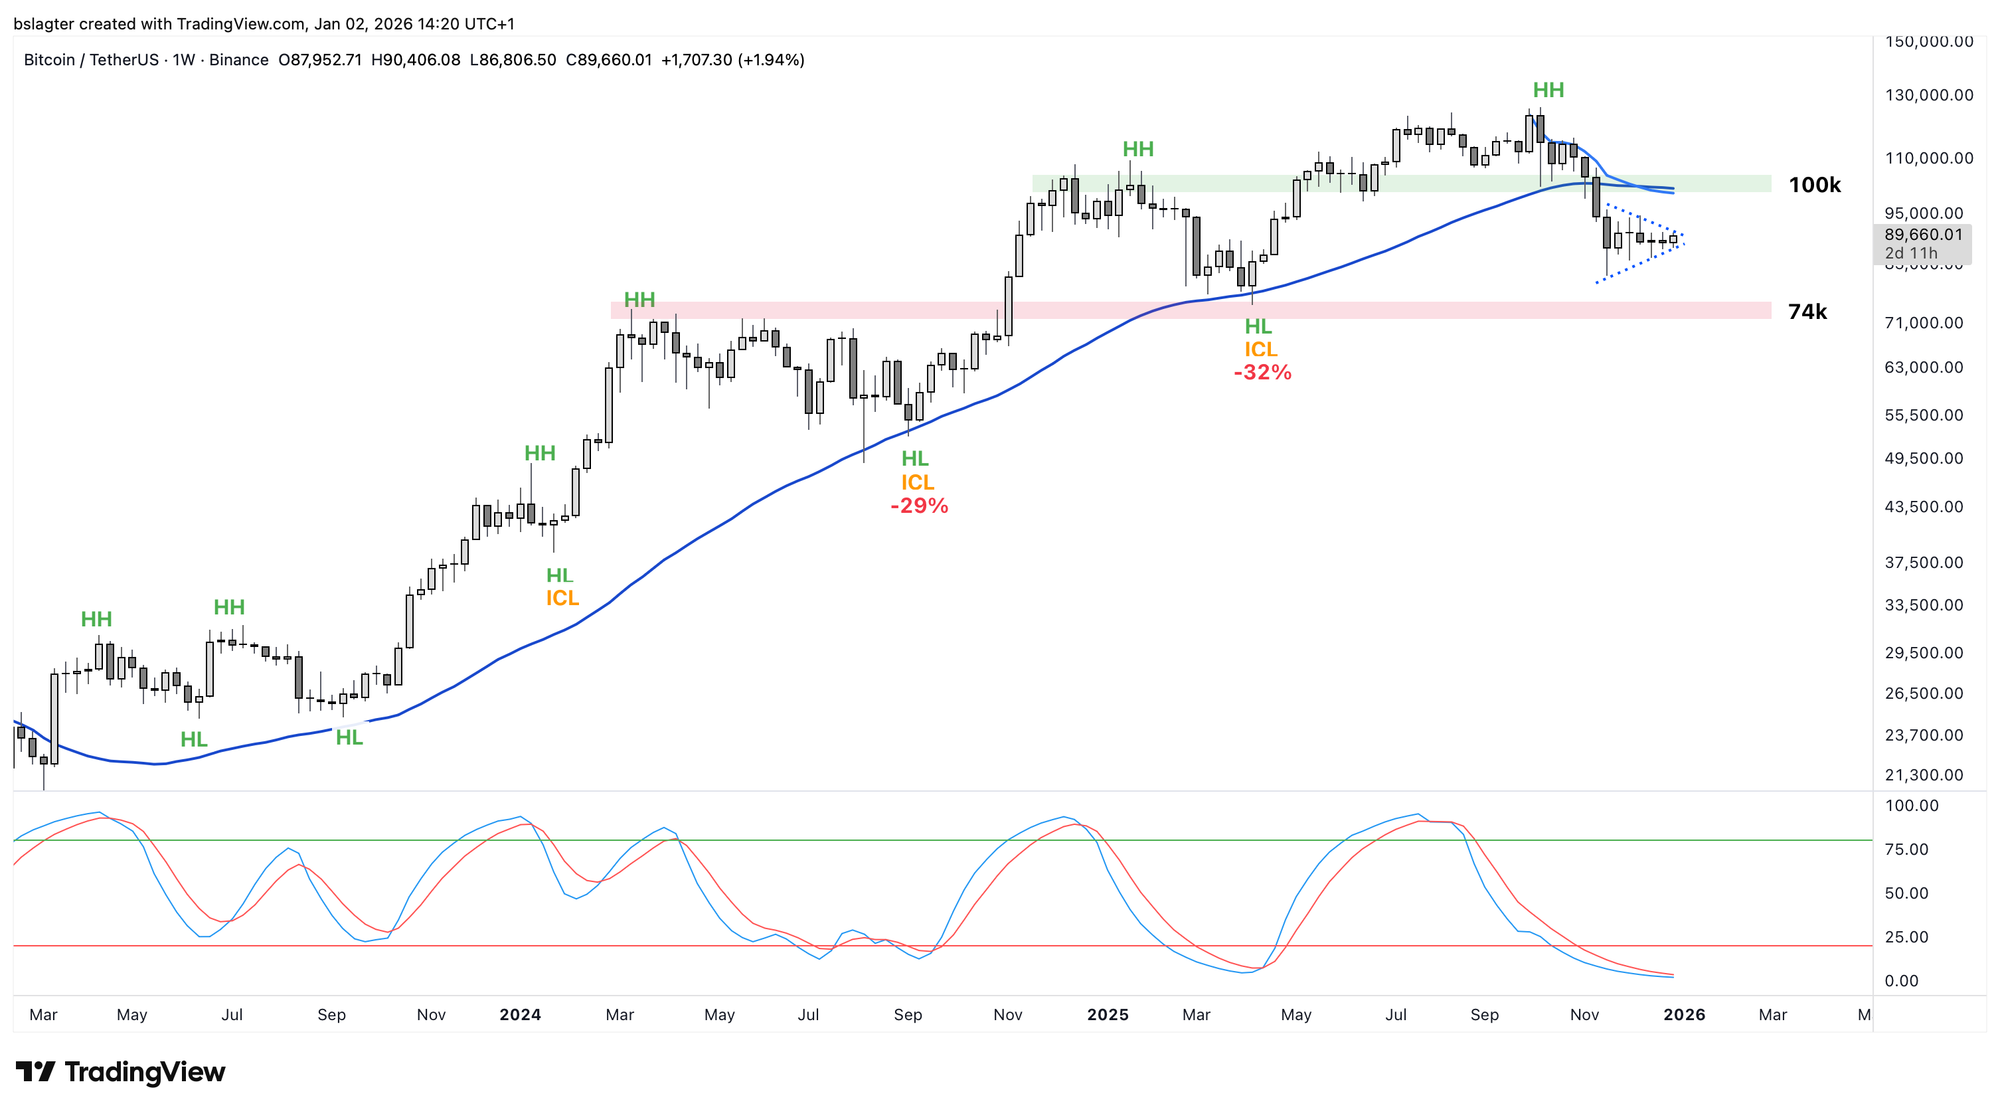
The weekly chart is ready for the beginning of a new weekly cycle. That will tell us a lot about the long-term trend.
- Is it still rising, meaning we're in a bull market? Then we expect a higher high (HH) above $126,000.
- Has it turned down, meaning we're no longer in a bull market? Then the rally ends with a lower high (LH).
The probability distribution from the November 14 Markets piece remains unchanged:
- Bull market continuation: 30%
- A period of sideways action: 40%
- A mild bear market: 20%
- A deep bear market: 10%
Yesterday we had a yearly, quarterly, and monthly close. All three were painted red. You can see the monthly chart below.
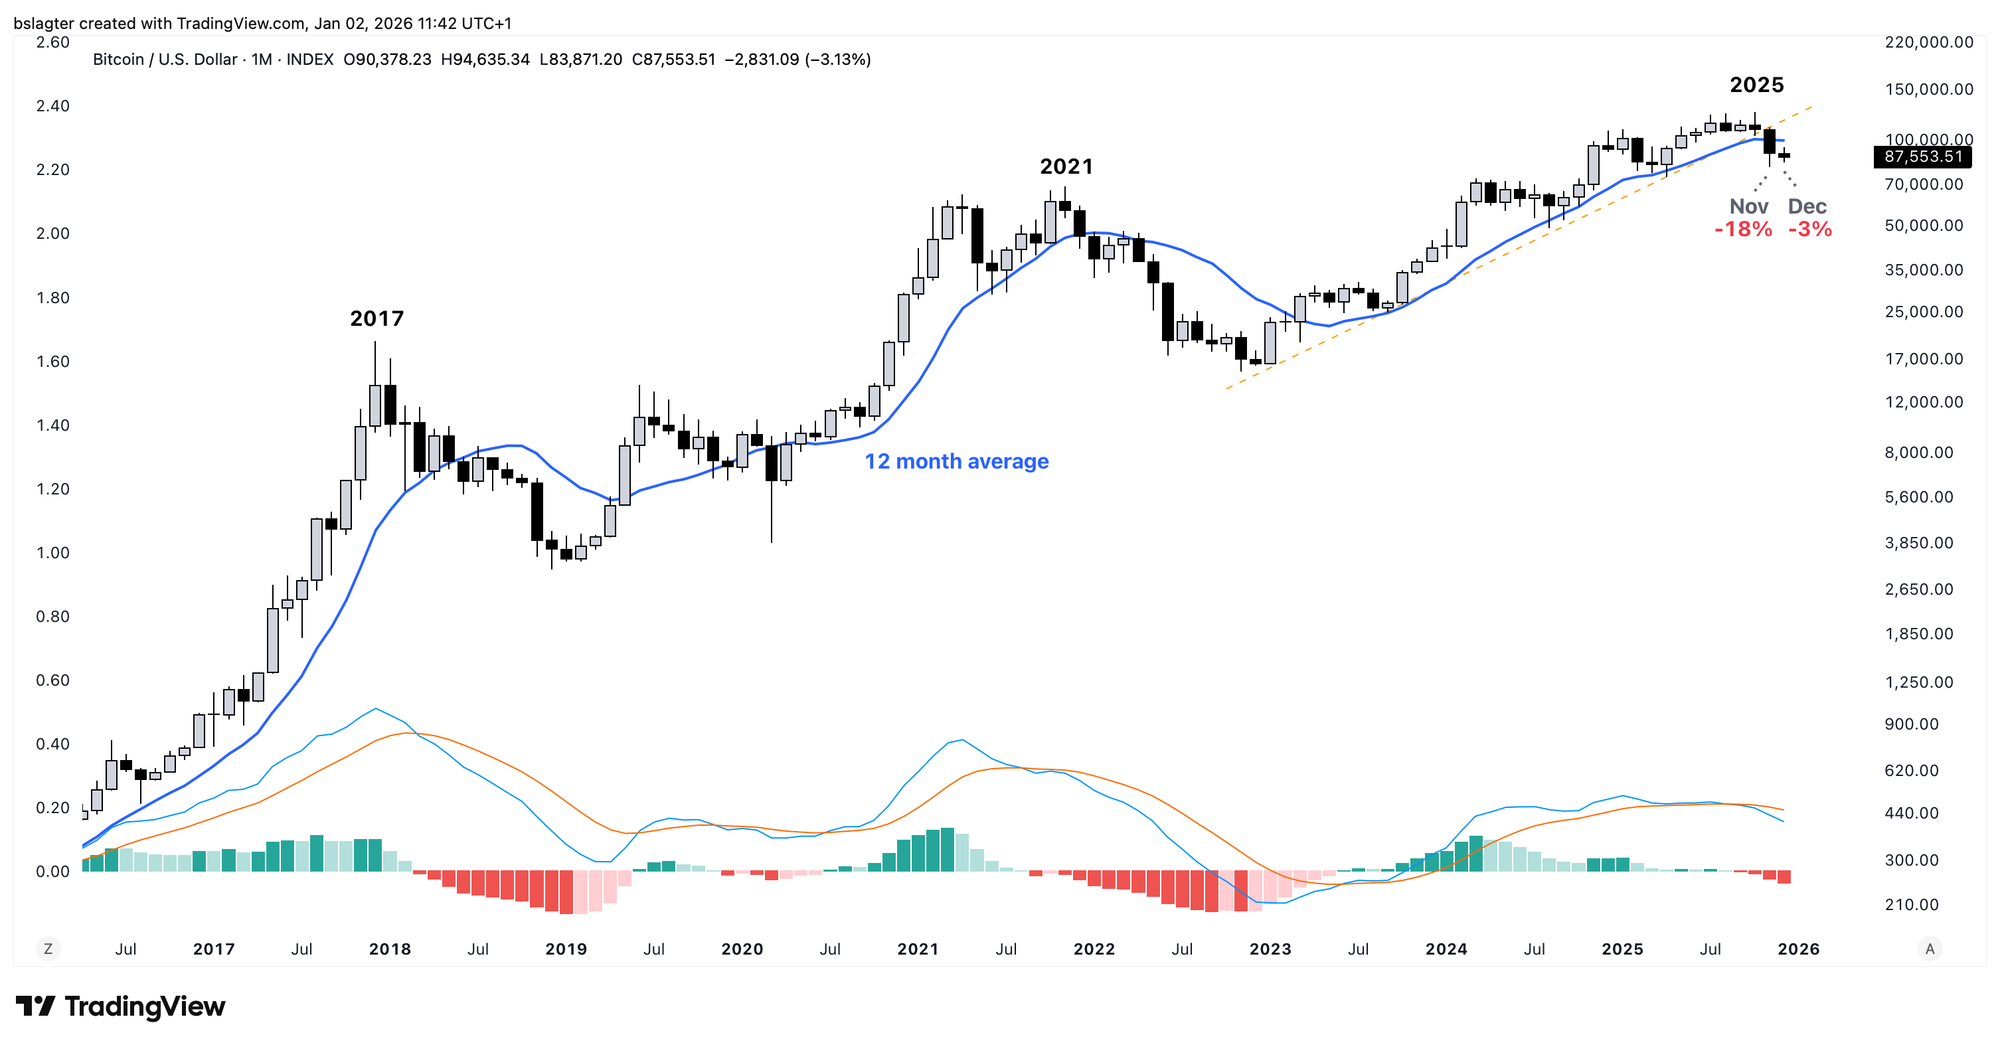
Most signals really do point to the three scenarios where the bull market is over. The dynamic trend guidance (blue), the regular trendline (orange), and momentum (the MACD at the bottom).
But we remain disciplined: we won't write off the bull market continuation scenario until we have more evidence, such as a lower high (LH) below $126,000 or a lower low (LL) below $74,000.
If we get either of those, we'll consider the uptrend on the weekly chart to be over. If we then go on to make an all-time high? We'll view that as a new uptrend and therefore a new bull market.
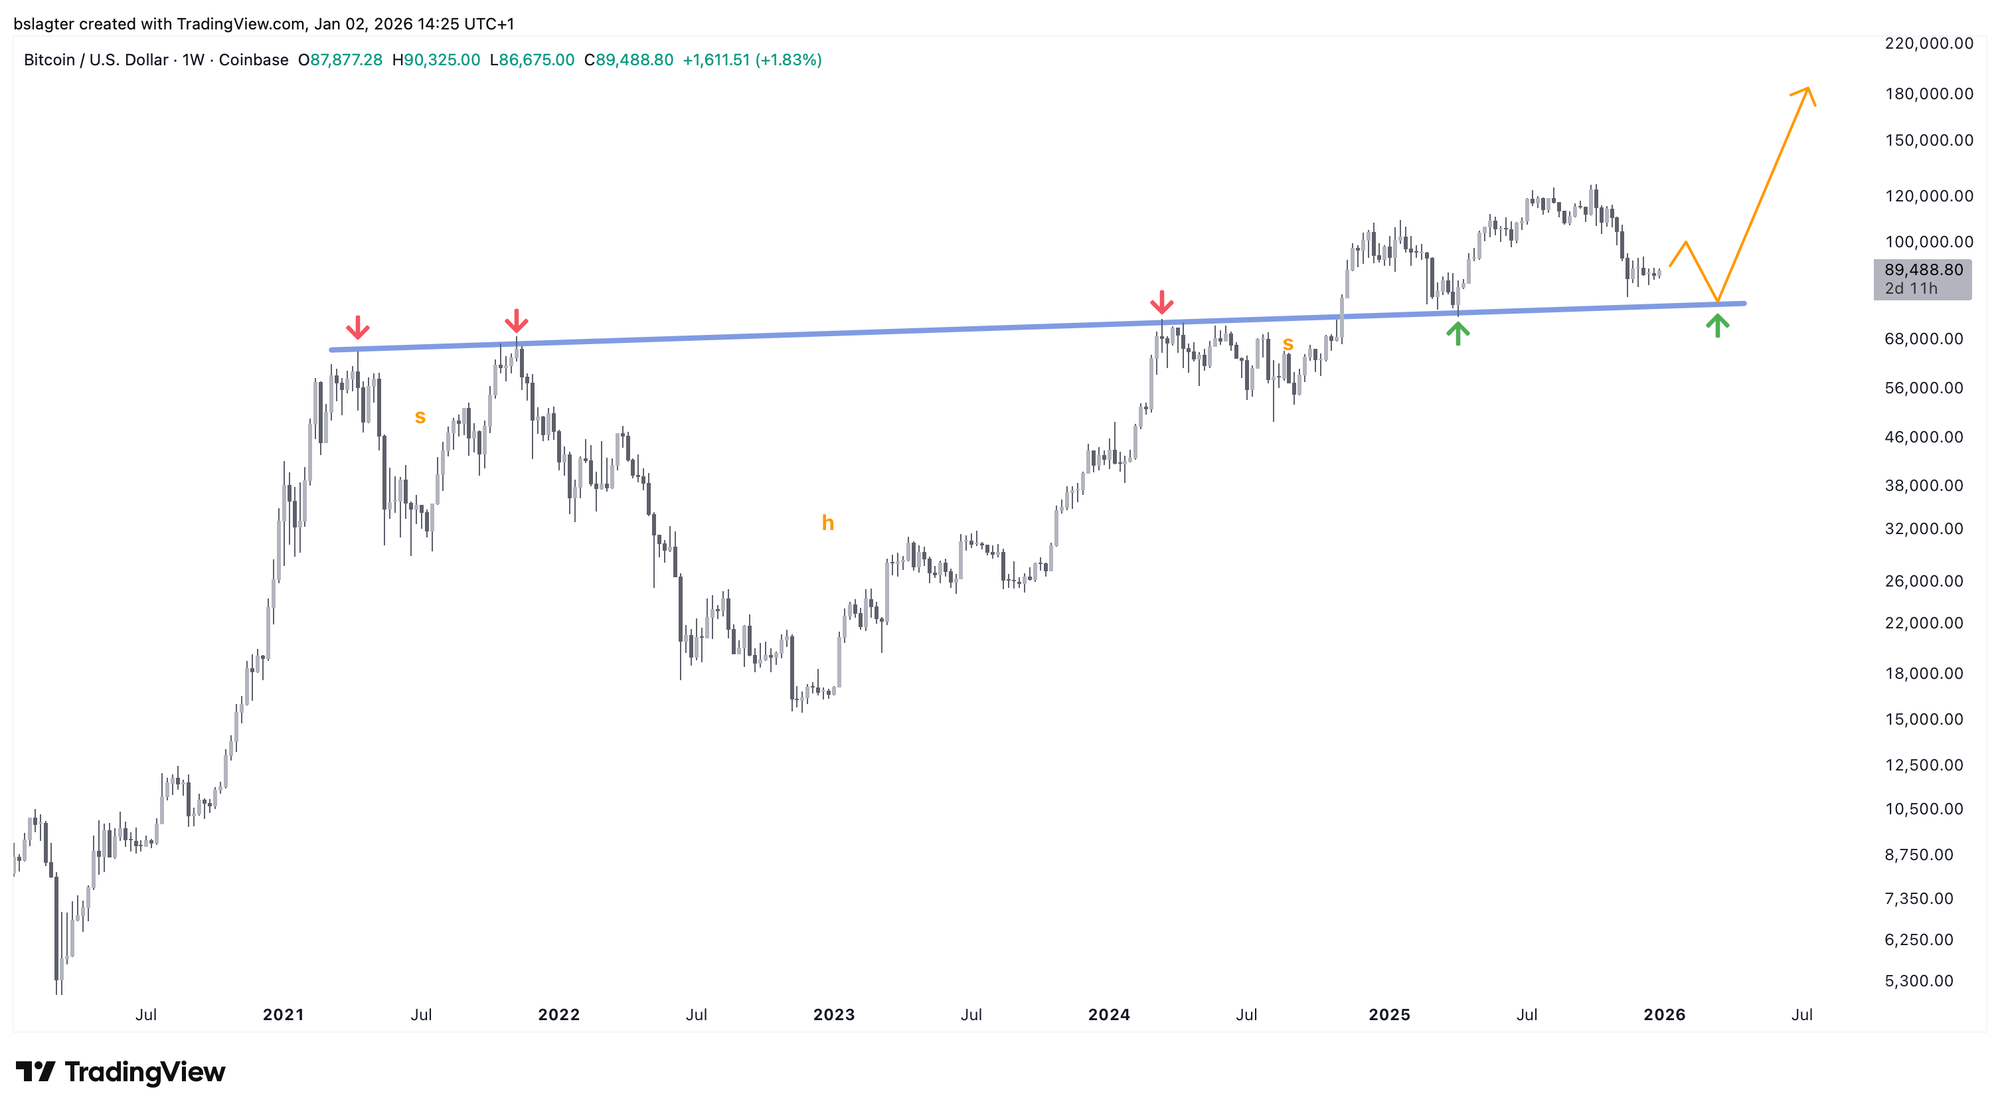
This week, Peter Brandt wrote about a possible interpretation of the weekly chart. Perhaps we should view the weakness of the past year as a test of the neckline of a massive head-and-shoulders pattern.
The advance in Nov 2024 completed a massive 3-1/2 year continuation inverted H&S pattern, subsequently retested in Mar/Apr 2025. The current decline could be a secondary retest of this H&S. This interpretation would allow for a further decline toward $77,000 or slightly lower as a retest of the neckline of that H&S.
That would fit the "period of sideways action" scenario, in which we reach the yearly cycle low as early as Q1 2026, and then begin a new bull market.
In closing
New to Bitcoin Alpha? In 2023, we wrote several foundational pieces about our perspective on the crypto market. These can be useful background for understanding our approach, assumptions, and scenarios.
All previous editions of Alpha Markets can be found in the archive. Questions, comments, and suggestions are always welcome in the community.
Thank you for reading!
To stay informed about the latest market developments and insights, follow our team members on X:
- Bart Mol (@Bart_Mol)
- Peter Slagter (@pesla)
- Bert Slagter (@bslagter)
- Mike Lelieveld (@mlelieveld)
We appreciate your continued support and look forward to bringing you more comprehensive analysis in our next edition.
Until then!