A V-Shaped Bottom: Relief Rally or Bull Market Revival?
Bitcoin crashed to $80.5k last Friday before sharply rebounding above $90k. Is this the V-shaped bottom investors have been hoping for—or just a bear market trap?

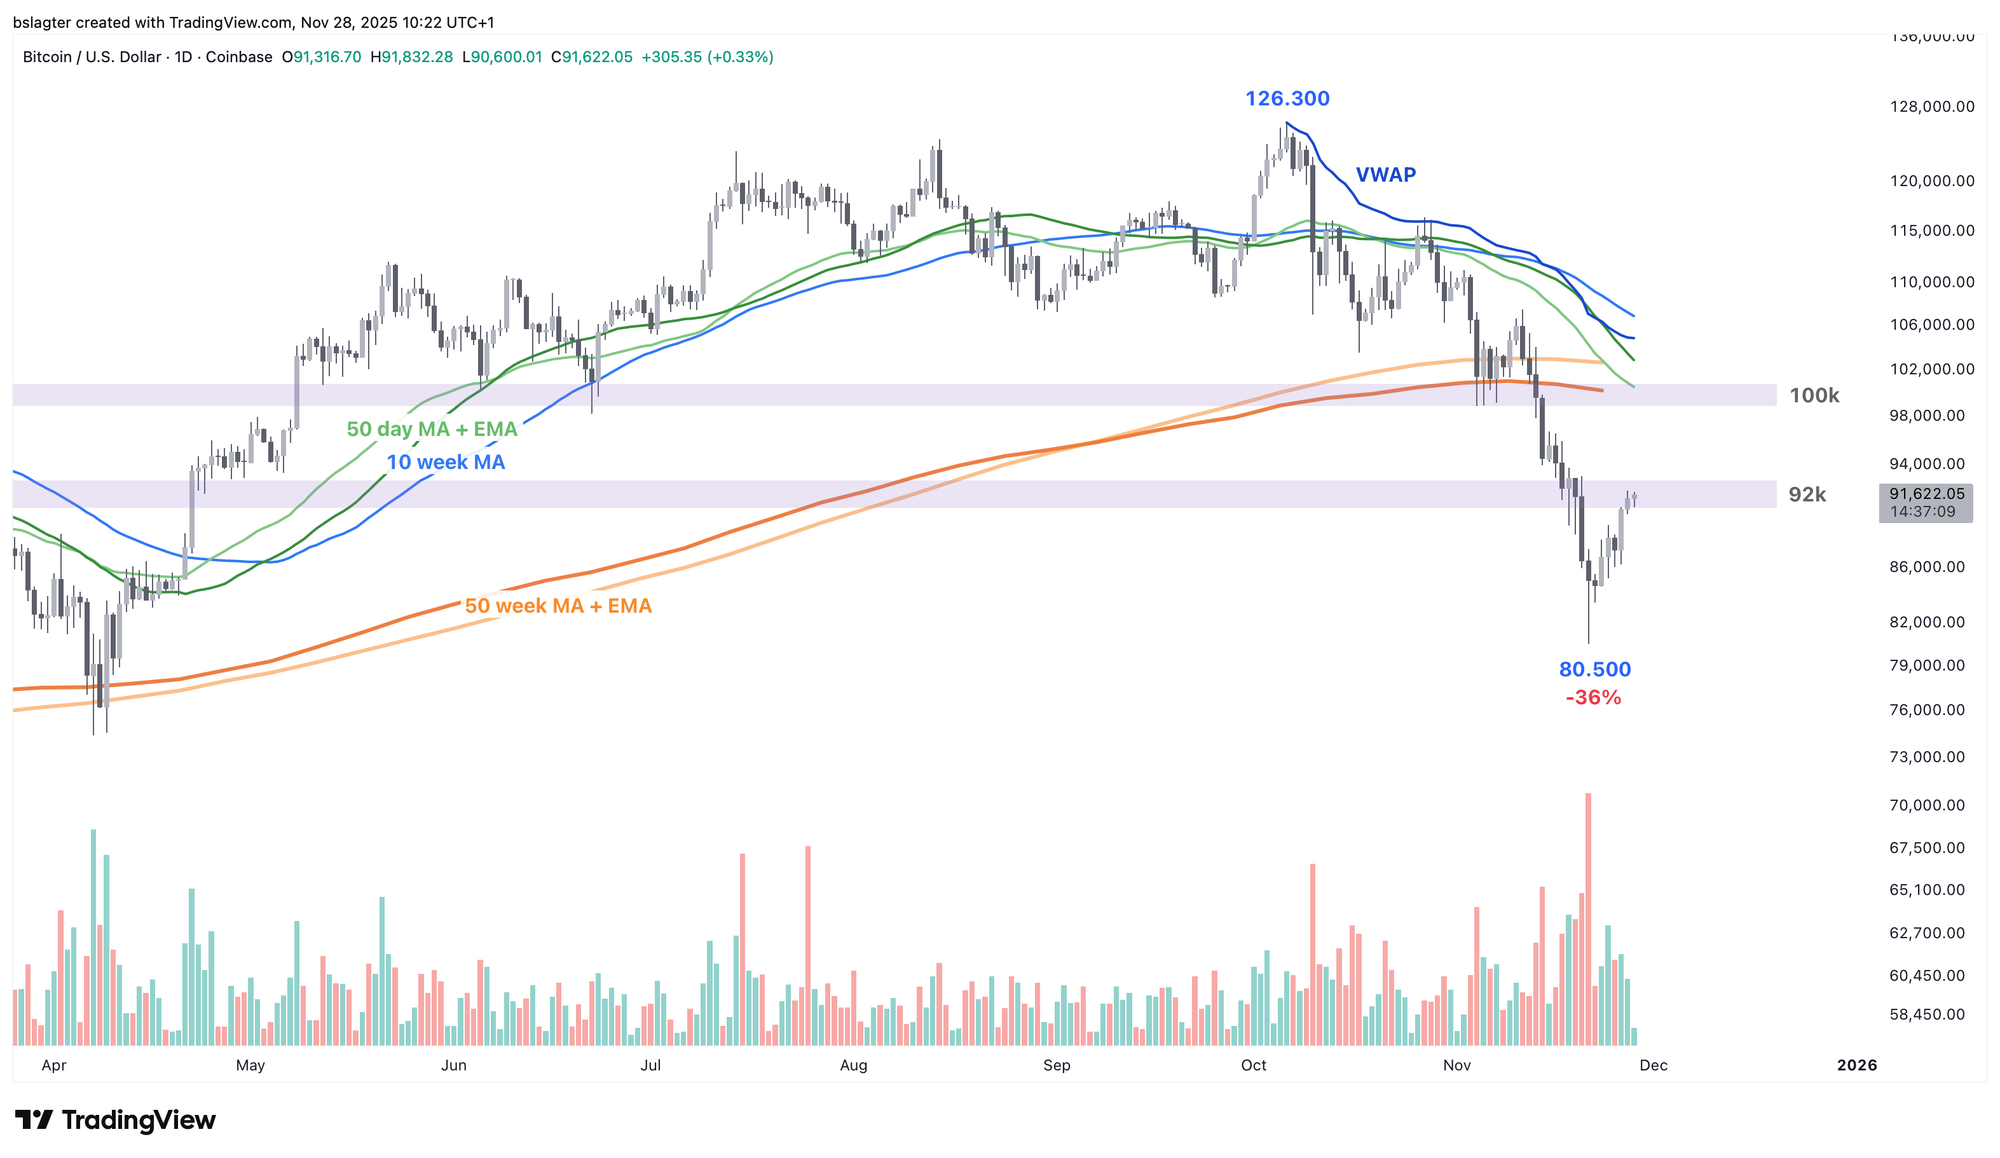
After the peak of $126,300 on October 6, despite the crash on October 10, the price declined in a controlled manner at about 4% per week. After five weeks of gradual decline, bitcoin had arrived at $100,000. At that point, there hadn't been a daily close below 100k for 190 days.
The calm and control were visible in seller behavior. They were primarily taking profits (with minimal losses), preventing a panic-inducing price crash.
In early November, the 100k level was successfully tested as support several times. That gave the optimists hope. The flip side was that disappointment ran deep when, on November 13 and 14, the price came crashing down from $104,000 to $94,000 in less than 30 hours.
This didn't just break through the 100k barrier, but also the moving averages with a length of approximately one year. The 365-day VWAP, the 400-day average, and the 50-week average, for example. All used by investors as signals to reduce risk.
The controlled decline turned into panic.
On November 20 and 21, we saw significant capitulation for the first time since the 2022 bear market. In two days, on-chain data showed $9.9 billion in realized losses. The chart below shows the 2-day moving average of bitcoin's realized loss.
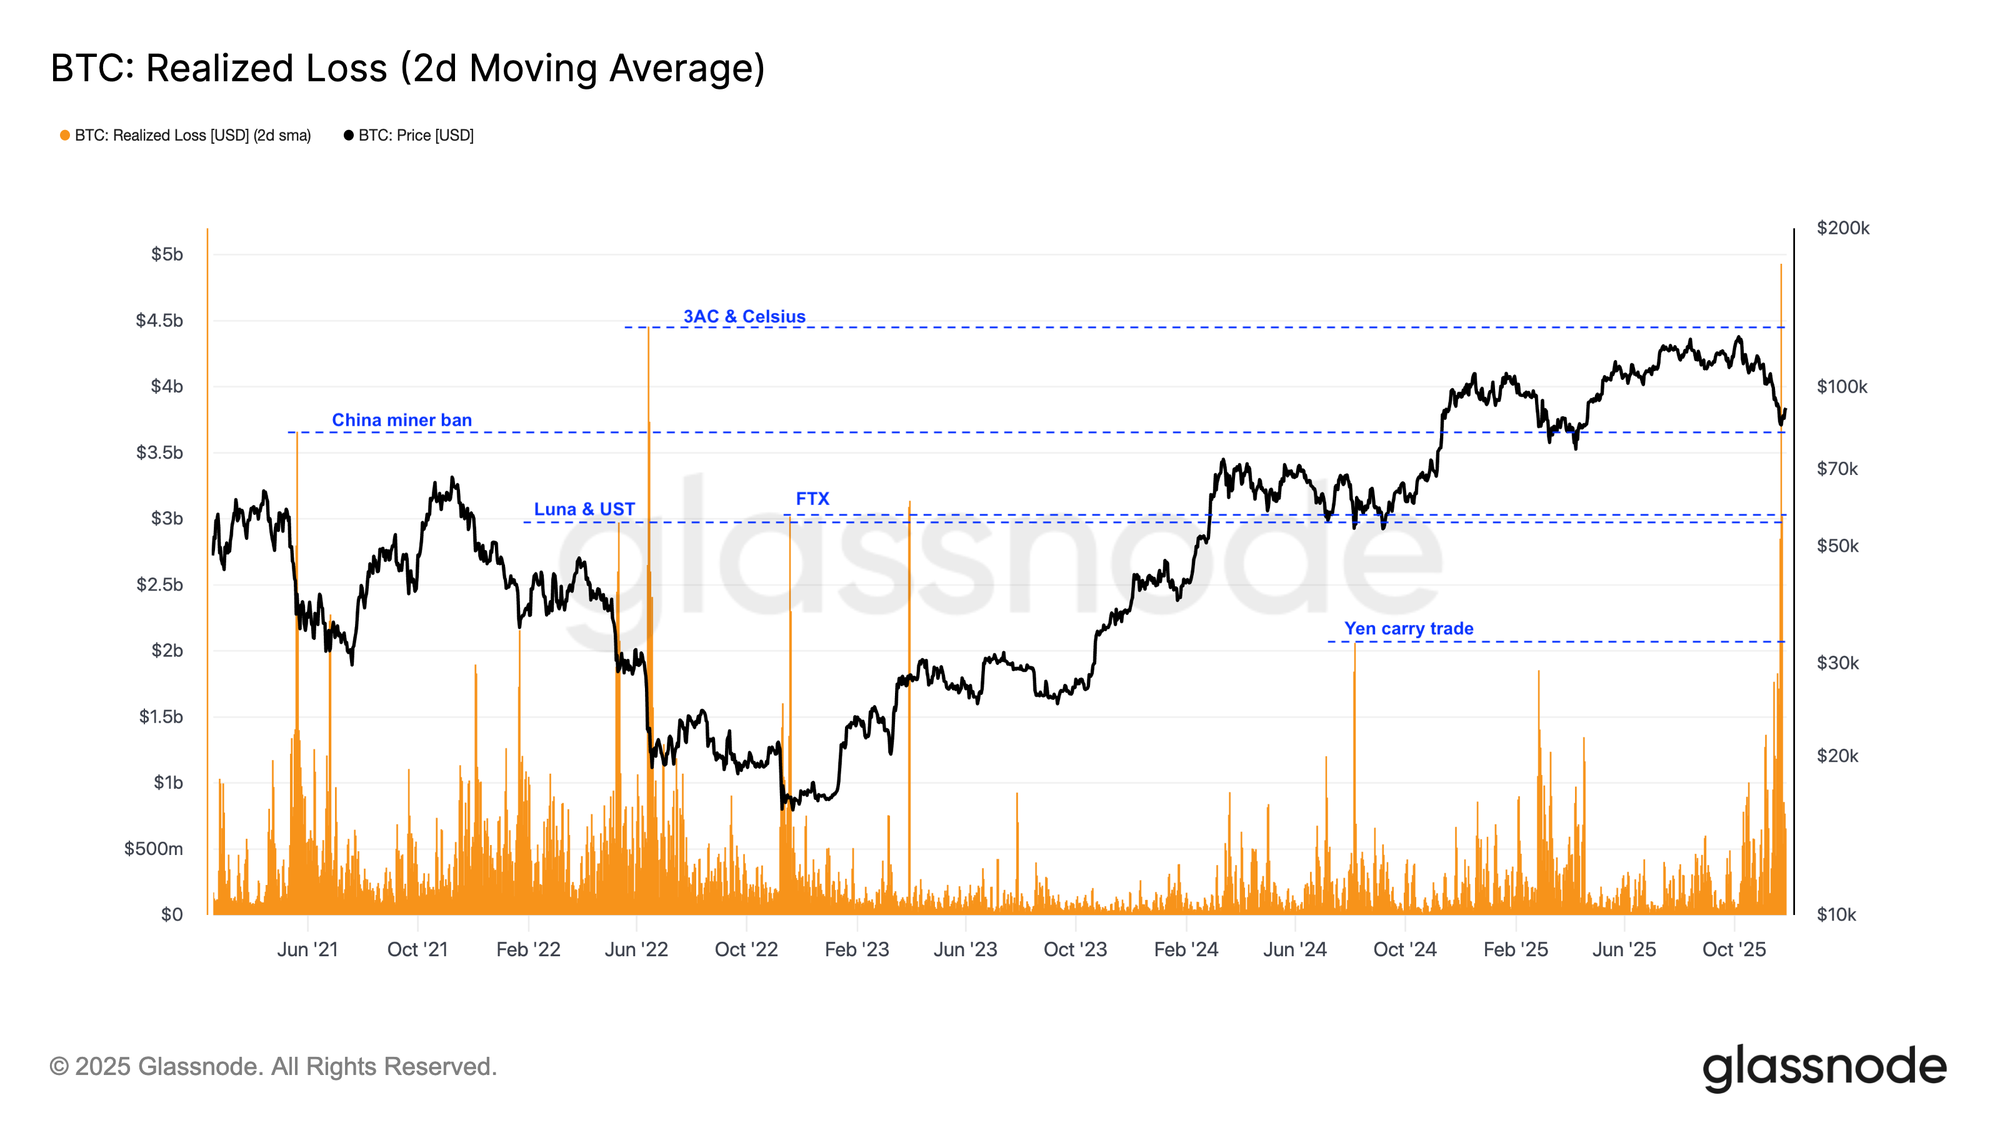
Of course, there are several caveats to the chart above. Bitcoin's total market cap is now much higher than in 2021 and 2022, meaning a realized loss of nearly $10 billion today roughly corresponds to $3 to $5 billion back then. The choice of a 2-day average is also tailored to last week's capitulation—with a 7-day average, June 2022 would actually come out higher.
But even with that in mind, last Thursday and Friday's crash was a remarkable event. A 13% drop, significant realized losses, high trading volume, and a V-shaped bottom.
In last week's Alpha Markets, we discussed the counter-trend rally:
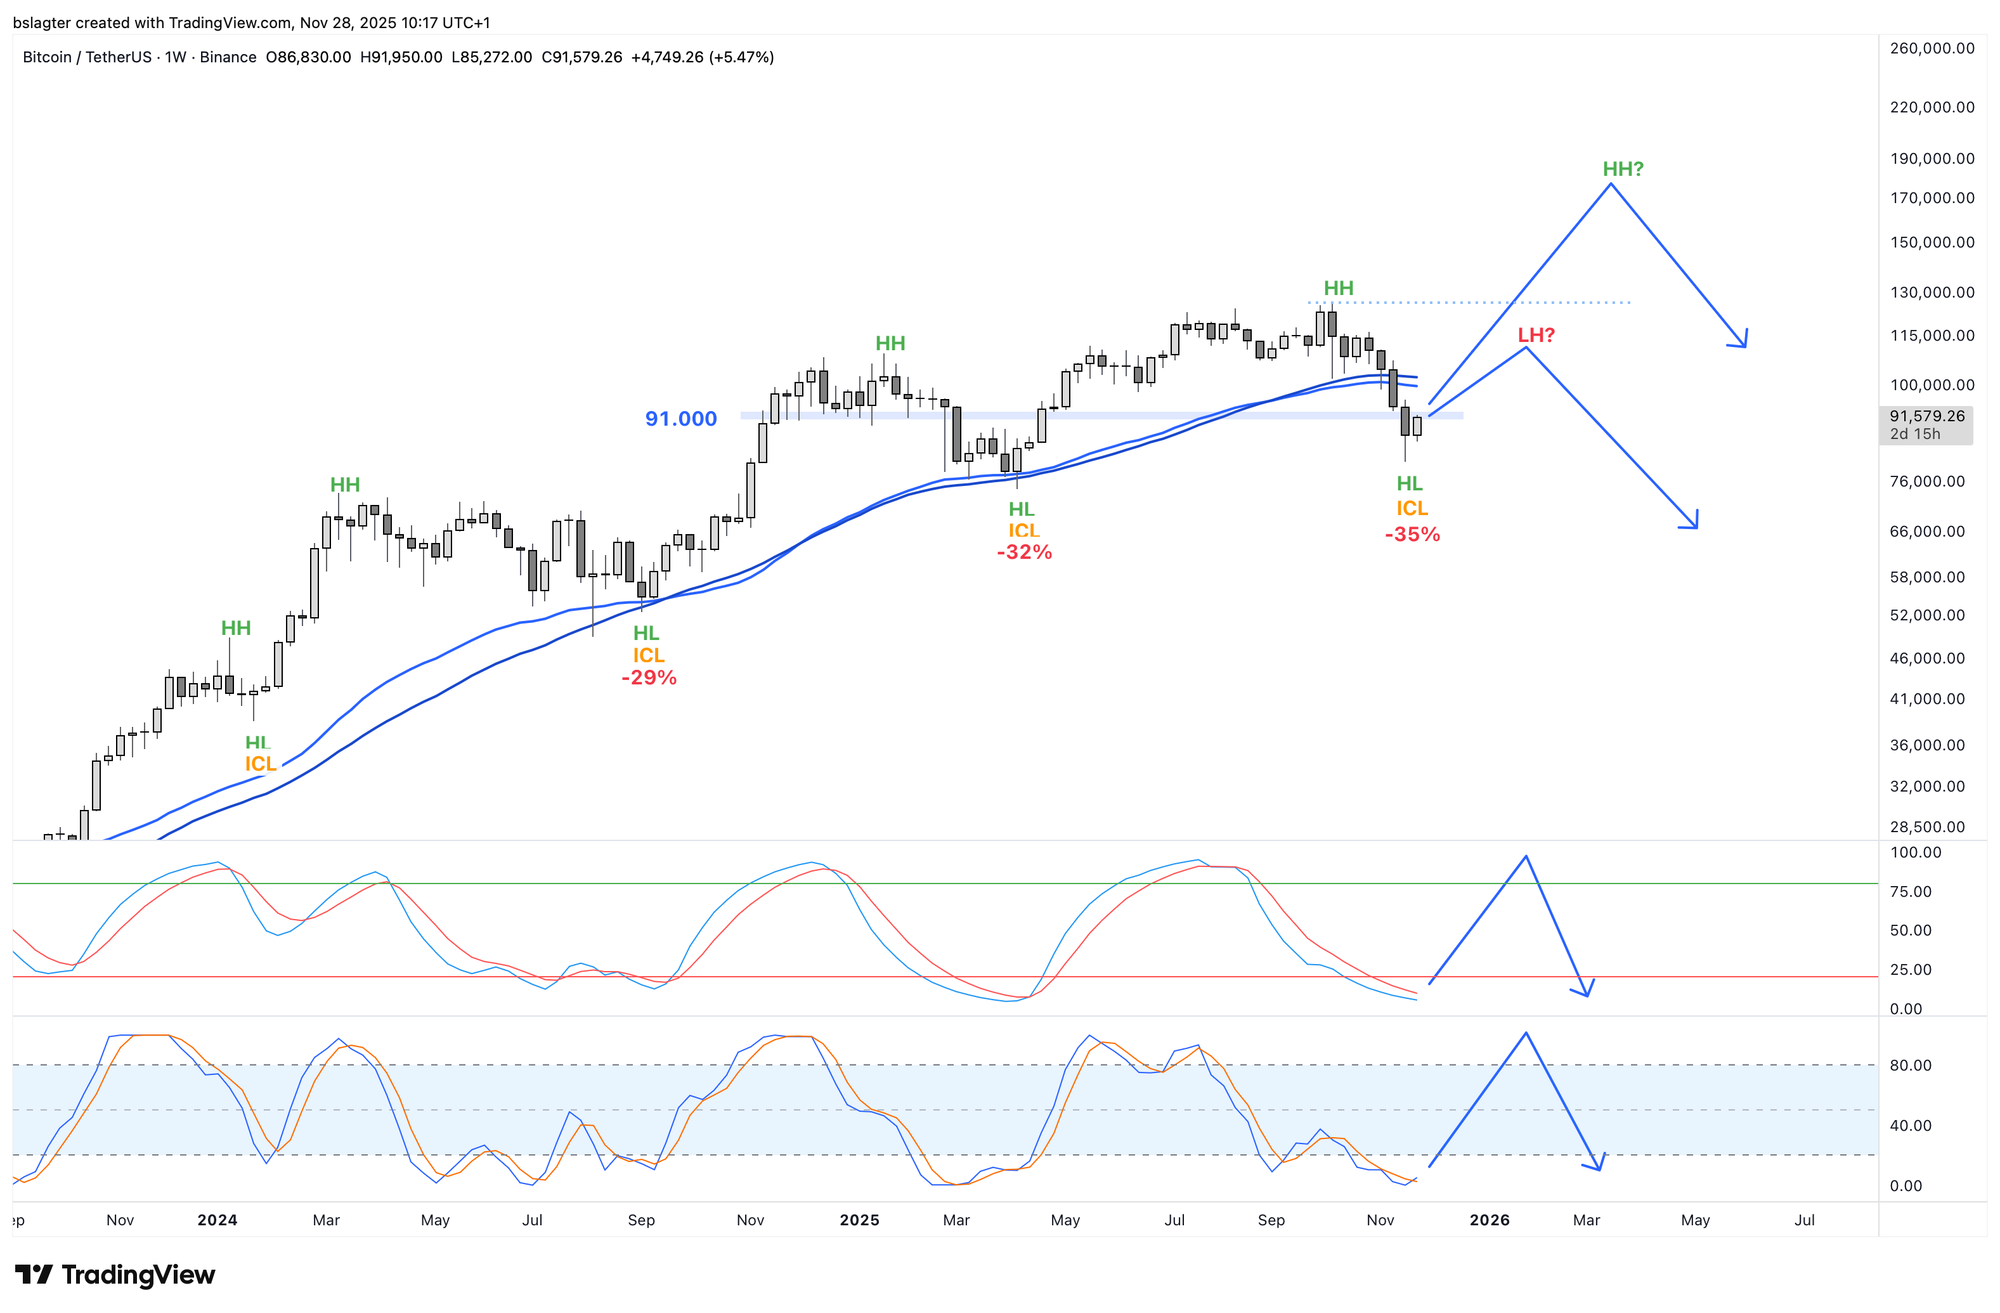
In every trend (rising or falling), you have movements that go against the trend. In a bull market, we call that a correction. In a bear market, a relief rally or counter-trend rally. The beginning of a weekly cycle is always rising, even in bear markets.
There's a good chance we're seeing the start of that now. That would make November 21 the weekly cycle low and the beginning of a new weekly cycle.
The big question is how high the top of this new weekly cycle will be. That gives us important information.
- If we push through to new all-time highs above $126,000, then the uptrend on the weekly chart is intact. We'll have a higher high (HH).
- If we stall below $126,000, that's an additional sign that the uptrend on the weekly chart is over. We'll then have a lower high (LH) for the first time since the previous bear market.
How you can tactically leverage this rally was covered in last week's Alpha Markets, split into 'I haven't exited yet' and 'I've already exited.'
The chart above shows that the 100k level could once again play an important role. That's where all the key price levels converge. The 50-day average, the 50-week average, the VWAP from the top, and the descending trendline.
We continue with the following topics for our Alpha Plus members:
- How high will this rally go?
- The upcoming monthly close
- Credit cycle reaches a crucial point
- The tide is slowly turning
1️⃣ How high will this rally go?
Bert
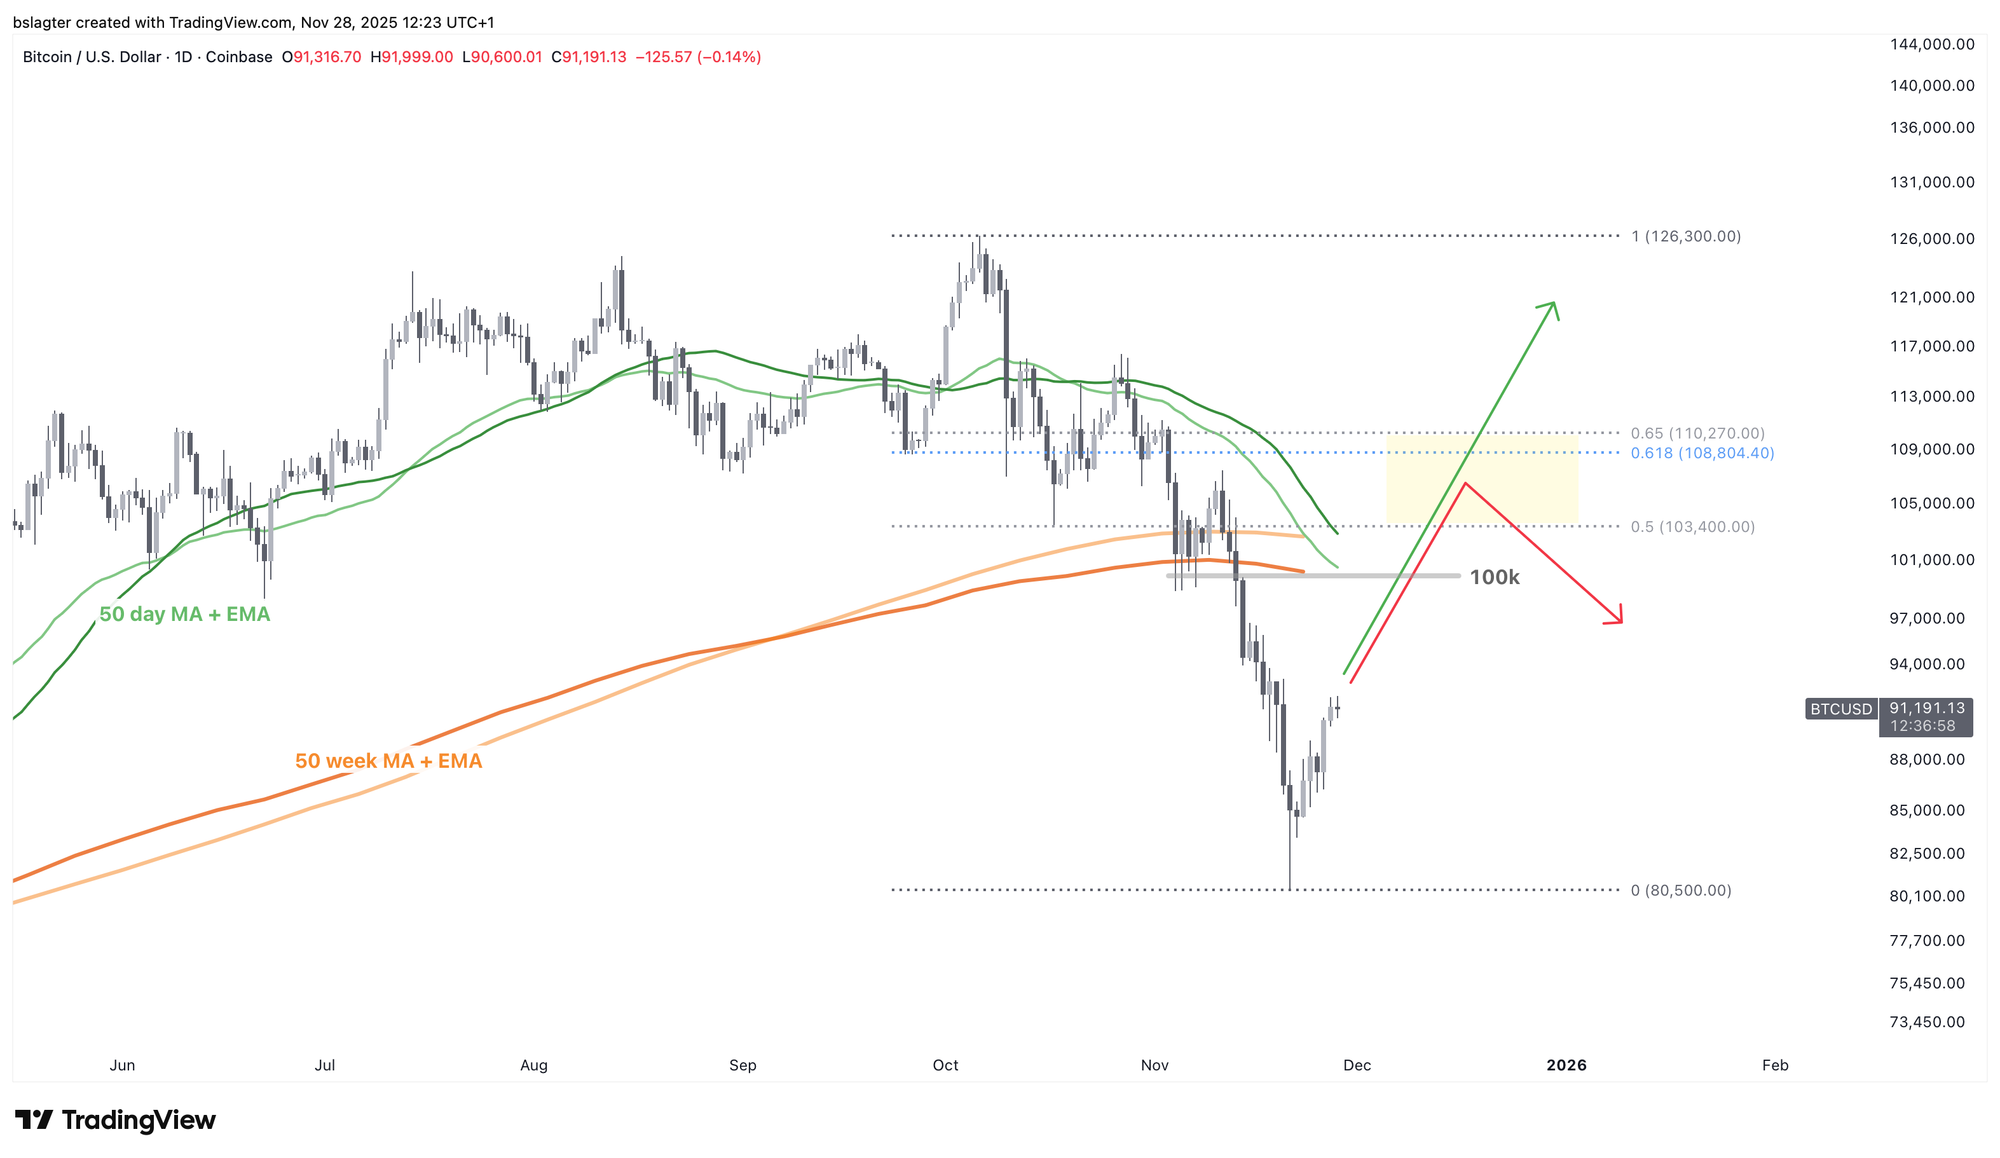
After a sharp decline, you often see the subsequent countermovement reclaim 50% to 65% of that drop. The zone between 61.8% and 65%—the 'golden pocket'—regularly acts as a turning point. If price breaks through there, the odds increase significantly for a continuation to new highs.
For the decline from $126,300 to $80,500, that zone lies between $103,000 and $110,000, with the focal point around $109,000.
A rise to that level is the ultimate test for the bears. We'd be back above the dominant moving average and above 100k. Optimism returns. Omega candles and price explosions are promised once again. Will investors latch onto that enthusiasm, or will they stubbornly continue selling their bitcoin, as we've seen in recent months?
Has the bear market begun? Then the advance stops there. The rally turns out to be nothing more than a relief rally. The weekly cycle makes an early top and we begin the descent toward a lower weekly cycle low below $80,000.
Is the bull market still intact? Then the bulls break through $110,000 and subsequently $126,000. Looking at earlier rising weekly cycles of this bull market, a logical price target would be between $150,000 and $160,000.
2️⃣ The upcoming monthly close
Bert
After the first weekly close below the 50-week average and below $98,000, we increased the probability of the bull market ending from 35% to 70%. In a few days, the first monthly close since that moment will follow, and it strongly appears that November will close below $100,000.
You can view this as additional evidence for the end-of-bull-market scenario, but there's another average to consider: the 20-month average.
As a dividing line between bull and bear markets, the 20-month average hasn't performed better than the 12-month. But in other markets, the 20-month average has often played a role. It's possible that bitcoin is moving toward the dynamics of other mature markets.
Another argument is that moving averages become less effective as more people watch them. People buy or sell before price reaches the average, trying to front-run others. As a result, price either doesn't reach the average at all or cuts right through it.
A different average can then take over as the trend guide. On the monthly chart, we won't know for certain for a long time. For now, it's an additional reason for both bears and bulls to think in scenarios.

3️⃣ Credit cycle reaches a crucial point
Thom
The concept of global liquidity frequently appears in the financial world, and bitcoin responds exceptionally strongly to changes in it. Although there's no clear definition of this concept, it's intuitively quite easy to understand.
It all starts with the realization that money is mostly not something physical you can possess. It consists of promises that people, institutions, and companies make to each other.
Making those promises, expanding the money supply, requires trust. Liquidity-driven bull markets emerge when people trust each other's promises. They emerge when there's belief in a better future for the economy.
And that's also why it doesn't work to simply look at the increase in the global M2 money supply measured in US dollars. Many analysts and finfluencers on X share these kinds of charts, but they give you a far too limited picture of global liquidity.
Global M2 is off the charts. #Bitcoin will close this gap. Prepare accordingly. pic.twitter.com/84gAbVggox
— Carl ₿ MENGER ⚡️🇸🇻 (@CarlBMenger) October 19, 2025
In essence, it all comes down to trust. There must be market-wide trust in a better future, so that people believe each other's promises, and credit creation kicks into a higher gear.
That's exactly where things started to stall in recent weeks:
- The Fed's hawkish rate decision suddenly created uncertainty about a rate cut in December, even though one had been priced in.
- We saw credit spreads rise. This is the extra interest companies must pay to borrow capital compared to the US government. Rising spreads mean capital providers have less confidence in corporate creditworthiness and are charging higher rates.
- Volatility in the US Treasury market (MOVE Index) increased significantly. US government bonds are the world's most important collateral for loans, and when their volatility increases, you can borrow less against that collateral.
- Real rates (nominal rates minus inflation expectations) rose, increasing the cost of capital. This has a dampening effect on the economy and thus also limits confidence in the future.
In short, confidence suddenly deteriorated sharply in the short term, dealing a blow to the credit cycle. Fundamentally, nothing is broken yet. The US economy looks largely healthy and a recession seems unlikely.
Yet confidence must return to give bitcoin's bull market another chance. Fortunately, we're also seeing some signals pointing that way, keeping that possibility alive:
- The AI narrative is still very much alive thanks to Nvidia's strong quarterly results.
- The probability of a rate cut in December has now climbed back to nearly 85 percent.
- Trump came out this week with his "Genesis Mission": an executive order to accelerate the development of artificial intelligence. The US doesn't want to leave anything to chance on this front, which should give the market additional confidence.
- The Russell 2000 index for smaller US companies started the week strong, which typically means investors are willing to take on more risk again.
- Midterm elections are scheduled for November 2026 that Donald Trump wants to win, and a bull market on Wall Street is important for that.
- Trump may appoint a new Federal Reserve chair by May 2026.
Although the US labor market is cooling considerably, and there are certainly certain risks in the system, there's still a solid case to be made for a longer bull run for bitcoin and other risk assets.
4️⃣ The tide is slowly turning
Thom
In recent weeks, it appeared that the Federal Reserve would leave rates unchanged on December 10. That has since changed, and the market now sees an 80%+ chance of a rate cut.
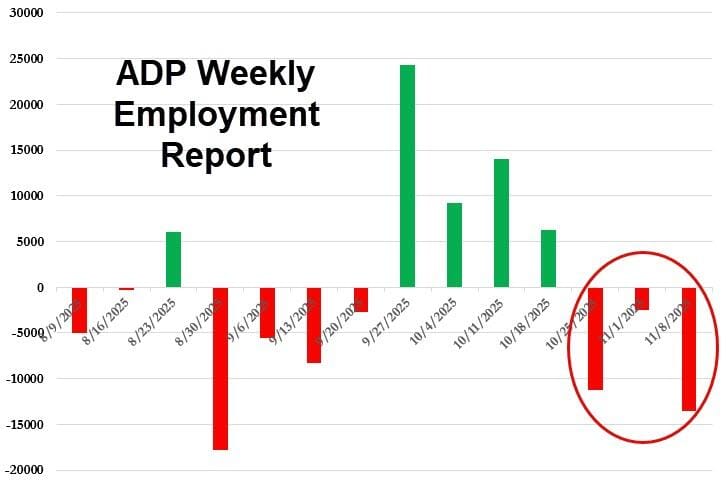
Given the economic data from recent weeks, that's a logical assessment. According to the latest ADP jobs report, the private sector lost an average of 13,500 jobs per week over the past four weeks.
At the same time, the threat of a new inflation wave has diminished considerably. Although inflation is still higher than desired, the Federal Reserve seems to be satisfied with the current level of around 3%.
Based on September's CPI and PPI, which are now in, the major banks expect September's PCE inflation to come in at 2.8% and the Core variant at 2.9%.

Ideally, inflation would be slightly lower, but the risk of rapid labor market deterioration currently appears to weigh more heavily for the Federal Reserve. Mary Daly, president of the San Francisco Fed, says she supports a rate cut in December for that reason.
This doesn't immediately create an optimal investment climate for bitcoin, but the tide is slowly starting to turn.
In recent weeks, financial conditions worsened because the market was suddenly confronted with uncertainty about a December rate cut. Now we're seeing that uncertainty reverse, which in theory gives bitcoin the chance to form a solid bottom around current price levels.
If financial conditions continue to improve after that, this bottom could serve as a springboard for another period of sharp price increases. Although sentiment isn't currently optimal, that remains my base case scenario for the coming months.
In closing
New to Bitcoin Alpha? In 2023, we wrote several foundational pieces about our view of the crypto market. These can be useful as background for our approach, assumptions, and scenarios.
All previous editions of Alpha Markets can be found in the archive. Questions, comments, and suggestions are welcome in the community.
Thank you for reading!
To stay informed about the latest market developments and insights, follow our team members on X:
- Bart Mol (@Bart_Mol)
- Peter Slagter (@pesla)
- Bert Slagter (@bslagter)
- Mike Lelieveld (@mlelieveld)
We appreciate your continued support and look forward to bringing you more comprehensive analysis in our next edition.
Until then!