A Tough Climb
Crypto and stock prices are bouncing back somewhat, though it's not all that convincing – markets are still waiting for an end to the uncertainty over Trump's policy, which might take a while.

Between February 21 and March 11, bitcoin’s price dropped 23%, falling from $99,500 to $76,500. U.S. stocks also suffered significantly during that period, largely due to investors’ growing reluctance to take risks amid increasing uncertainty over Trump’s economic policies.
After several weeks of steadily declining prices, a rebound—a period of recovery—often follows. On March 14, we wrote:
With the drop to $76,500, bitcoin has filled the CME gap and reached the price target associated with the rectangle top. Meanwhile, a bullish divergence has become visible on the daily chart. It wouldn’t be surprising if we’ve seen a local bottom, with some recovery coming in the next few weeks.
This recovery hasn’t been overwhelming. That isn’t due to any disappointing macroeconomic data—there were no negative surprises here. Even U.S. central banker Jerome Powell’s speech was solid.
So, what is it then?
The simple answer is this: investors remain cautious until the uncertainty surrounding U.S. economic and geopolitical policies subsides. Until that happens, households, companies, and investors aren’t inclined to take on excessive risk.
In financial markets, we never speak in certainties—only probabilities and opportunities. It’s quite possible that we’re facing a mini bear market, as we noted recently. This would be consistent with a potential months-long escalation of the U.S.-led trade war.
However, the possibility of resuming the bull market on a much shorter time frame is by no means off the table. Let’s examine the situation today. What might the route to a new all-time high look like? What obstacles could we encounter along the way?
The main hurdle is the zone between $89,000 and $92,000. In this area, the 50-day moving average, the 10-week moving average, two horizontal price levels, and the descending trendline from this correction all converge.
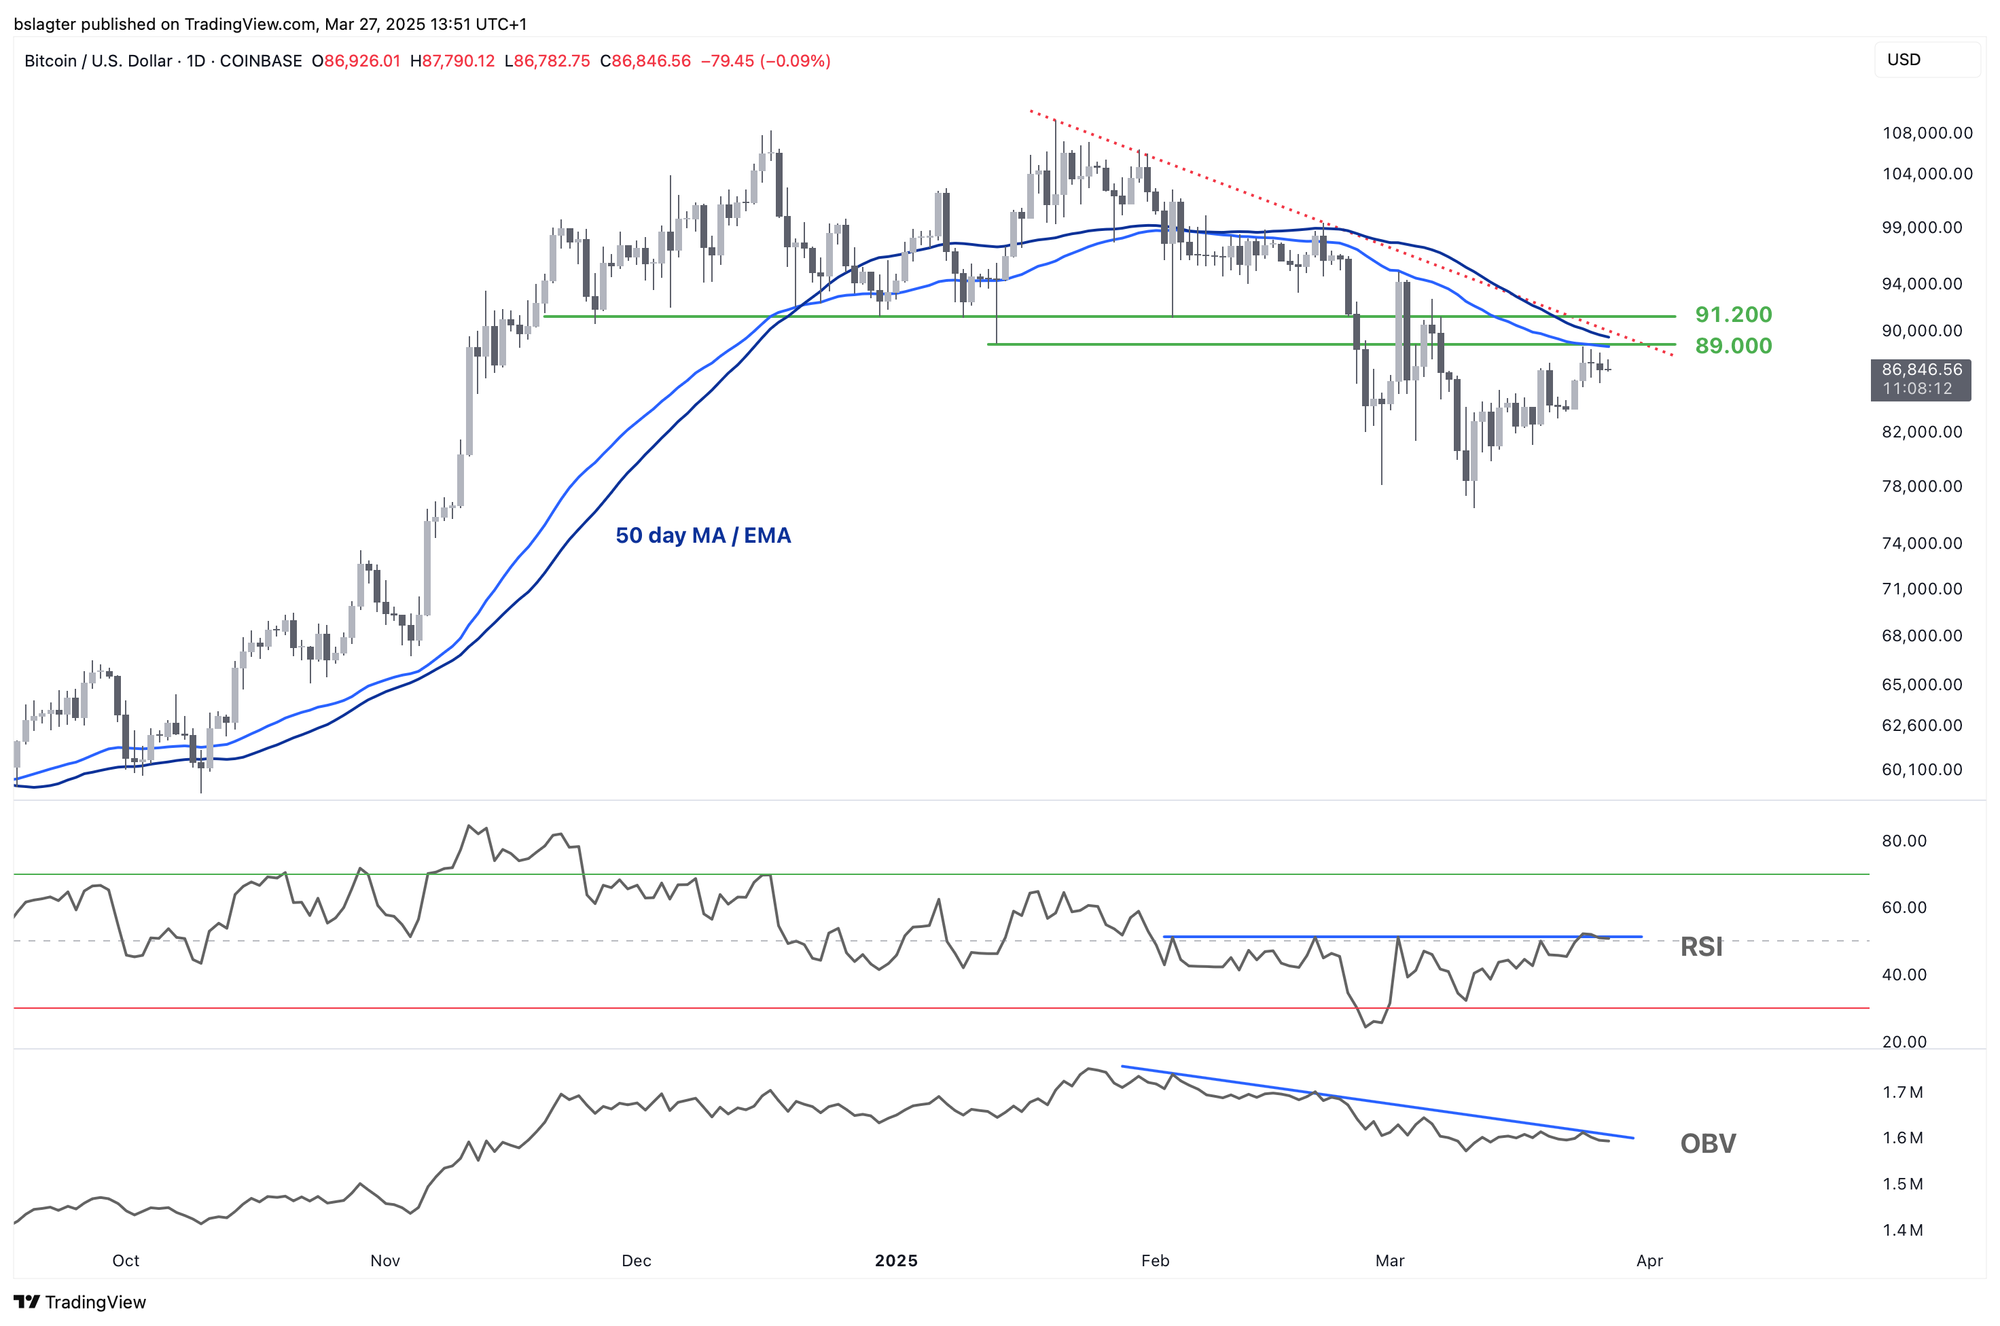
The first step is to secure acceptance above $92,000—a confirmed daily close, a solid weekly close, a robust retest of that level as support, and sustained upward movement. But that alone won’t clear all hurdles.
It’s not just on social media that we’re seeing negative sentiment—the on-chain data backs it up as well. Every time the price makes a small upward move, sellers jump in, trying to exit without locking in a loss. This is typical behavior during corrections and one reason why the recovery might take time.
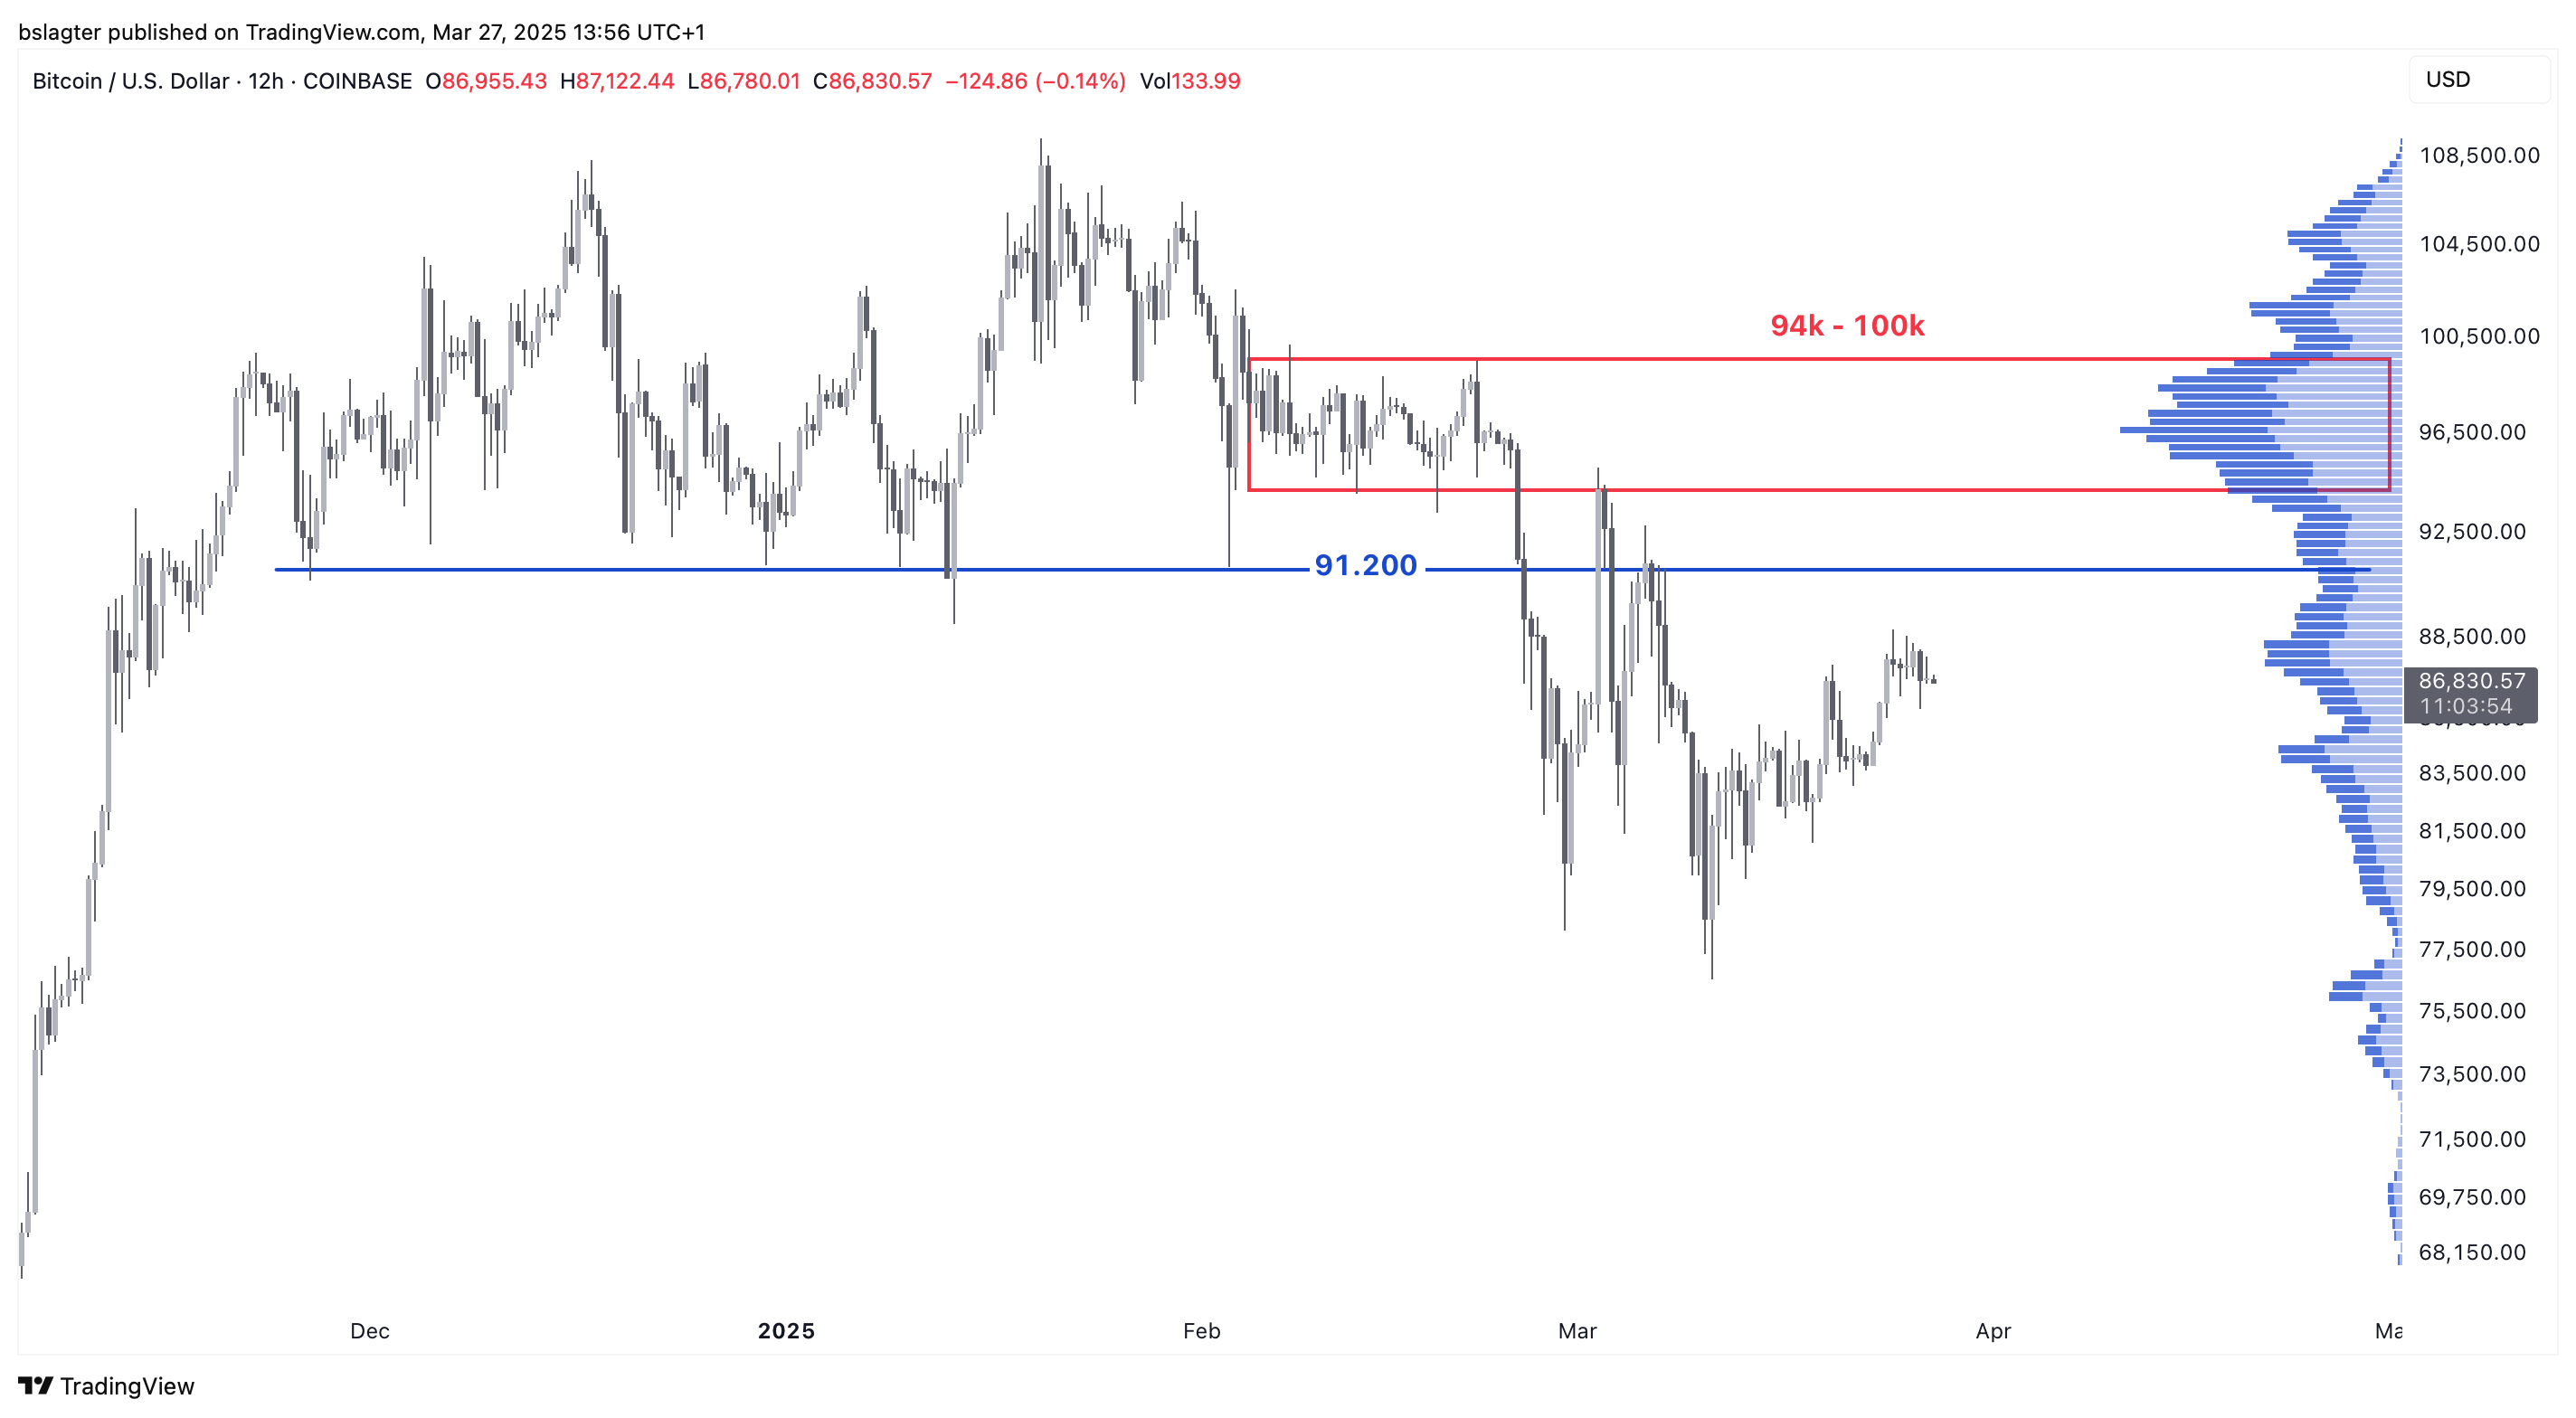
In the chart below, you can see a volume profile on the right. This tool shows how trading volume is distributed across different price levels. There’s heavy trading between $94,000 and $100,000—many entered at these levels. Some will likely want to exit without losses around these prices, potentially creating significant resistance.
Only after acceptance above $100,000 does the path open for new record highs. If this weekly cycle, like previous ones, holds the potential for a 100% surge, then we’d move from $76,000 to roughly $150,000.
For now, that scenario doesn’t seem to be unfolding. In the short term, the trend remains downward. The uptick over the past two weeks is merely a rebound within a broader downtrend. This means we’re currently operating under two assumptions:
- Long term: We remain in a bull market until proven otherwise. A key indicator would be acceptance below the 50-week moving average (the handbrake).
- Short term: We’re in a downtrend until proven otherwise, with a crucial sign being acceptance above $92,000.
This short-term weakness might also result in a prolonged period of sideways movement between $70,000 and $100,000—comparable to last summer’s range when prices traded between $52,000 and $74,000 for eight months.
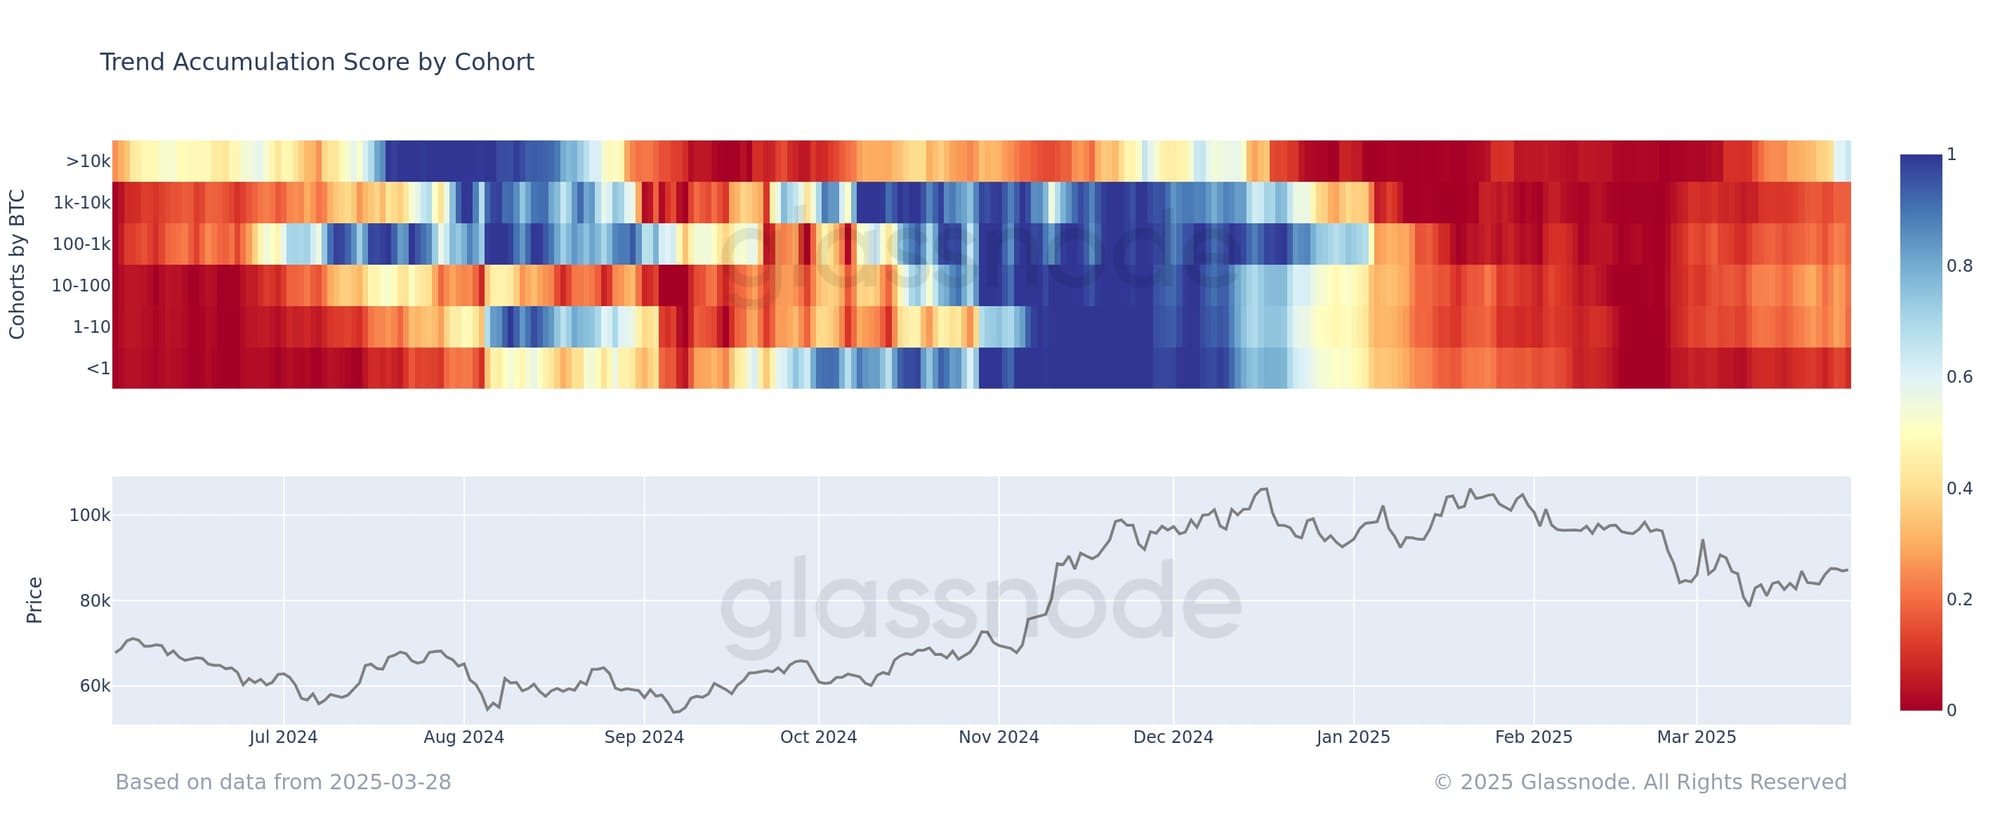
There’s little evidence in the data to suggest that this period of weakness will be short-lived. A few small bright spots indicate that sellers are gradually losing interest in offloading at these levels—a constructive sign, as it’s a prerequisite for forming a proper bottom.
The chart below displays the Accumulation Trend Score broken down by investor size. The behavior of the largest investors is changing. In the upper right, we see a transition from red to blue—from distribution (shrinking positions, selling) to accumulation (building positions, buying).
We also observe a growing divergence between large and small investors—a sentiment the Bitwise CEO noted back in February around that time:
There is an absolutely massive disconnect between retail and professional sentiment in crypto right now. Retail sentiment is the worst it's been in years, while professional investors are extraordinarily bullish. It's like living in two completely separate worlds.
And that is the reality we must contend with for now. As long as risk appetite—especially among retail investors—remains low and continues to decline, the crypto market will face significant headwinds. Professional investors aren’t as concerned; they’re acquiring bitcoin at attractive prices.
We will continue with the following topics for our Alpha Plus members:
- Do not underestimate the American economy
- The daily & weekly cycle