A Plan for the Bear Market
After the February 5th capitulation to $60,000, the market has settled. No more doubt: this is a bear market. When do we get back in? What's the right plan now?

On Thursday, February 5th, the market capitulated. Every indicator confirmed it: the accelerating decline, trading volume, realized losses, and the breadth of the selloff. You could see it in the sentiment and the narratives people were telling each other. The decline since October 2025 is no brief deviation—we're in a bear market.
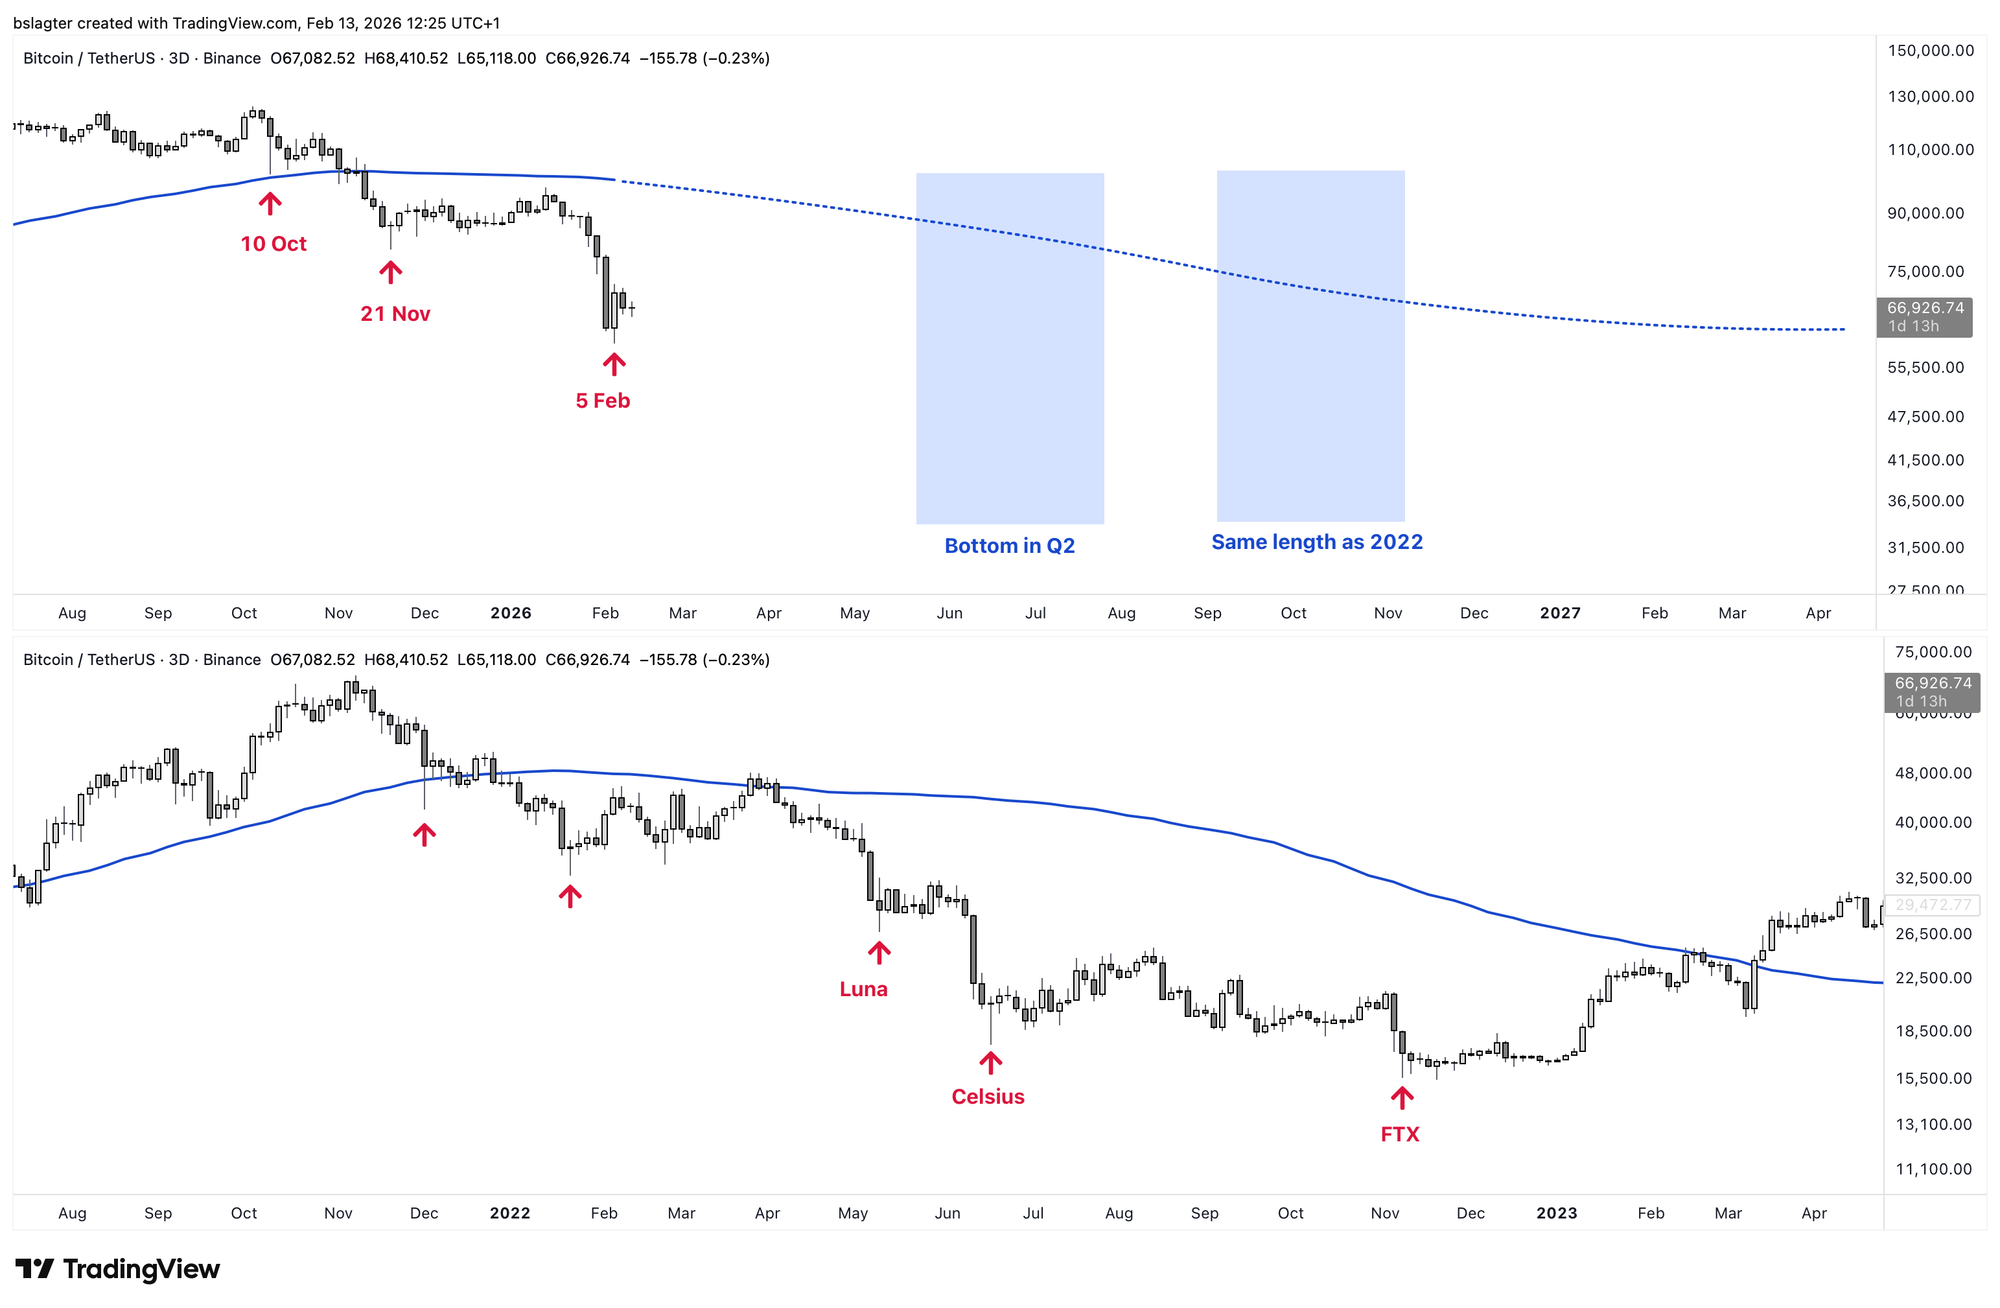
Bear markets often feature multiple capitulation events. In the 2022 bear market, you could point to five such moments. Three of them we remember through the collapse of tokens and companies, like Luna, Celsius, and FTX.
In this bear market, we've seen three moments so far when investors exited positions at a loss on a massive scale and positions got liquidated. We remember them by date, like the October 10th crash, because despite the market violence, no systems or companies have collapsed yet.
The capitulation brought us to the lowest point of this bear market, just shy of $60,000. That's 52% below the $126,000 top on October 6th. With this, we've hit the price target of the bear flag that formed in December and January.
We assign a low probability to the scenario that this is also the end of the bear market and that we've now begun a new bull market. In other words, we expect more time and/or decline is needed to complete the entire process where selling pressure dries up and stubborn buyers regain the upper hand.
We expect the next weekly cycle low (ICL) at the end of the second quarter. In the meantime, price could certainly rally significantly first. Just as you see corrections in every bull market, you see rallies in every bear market.
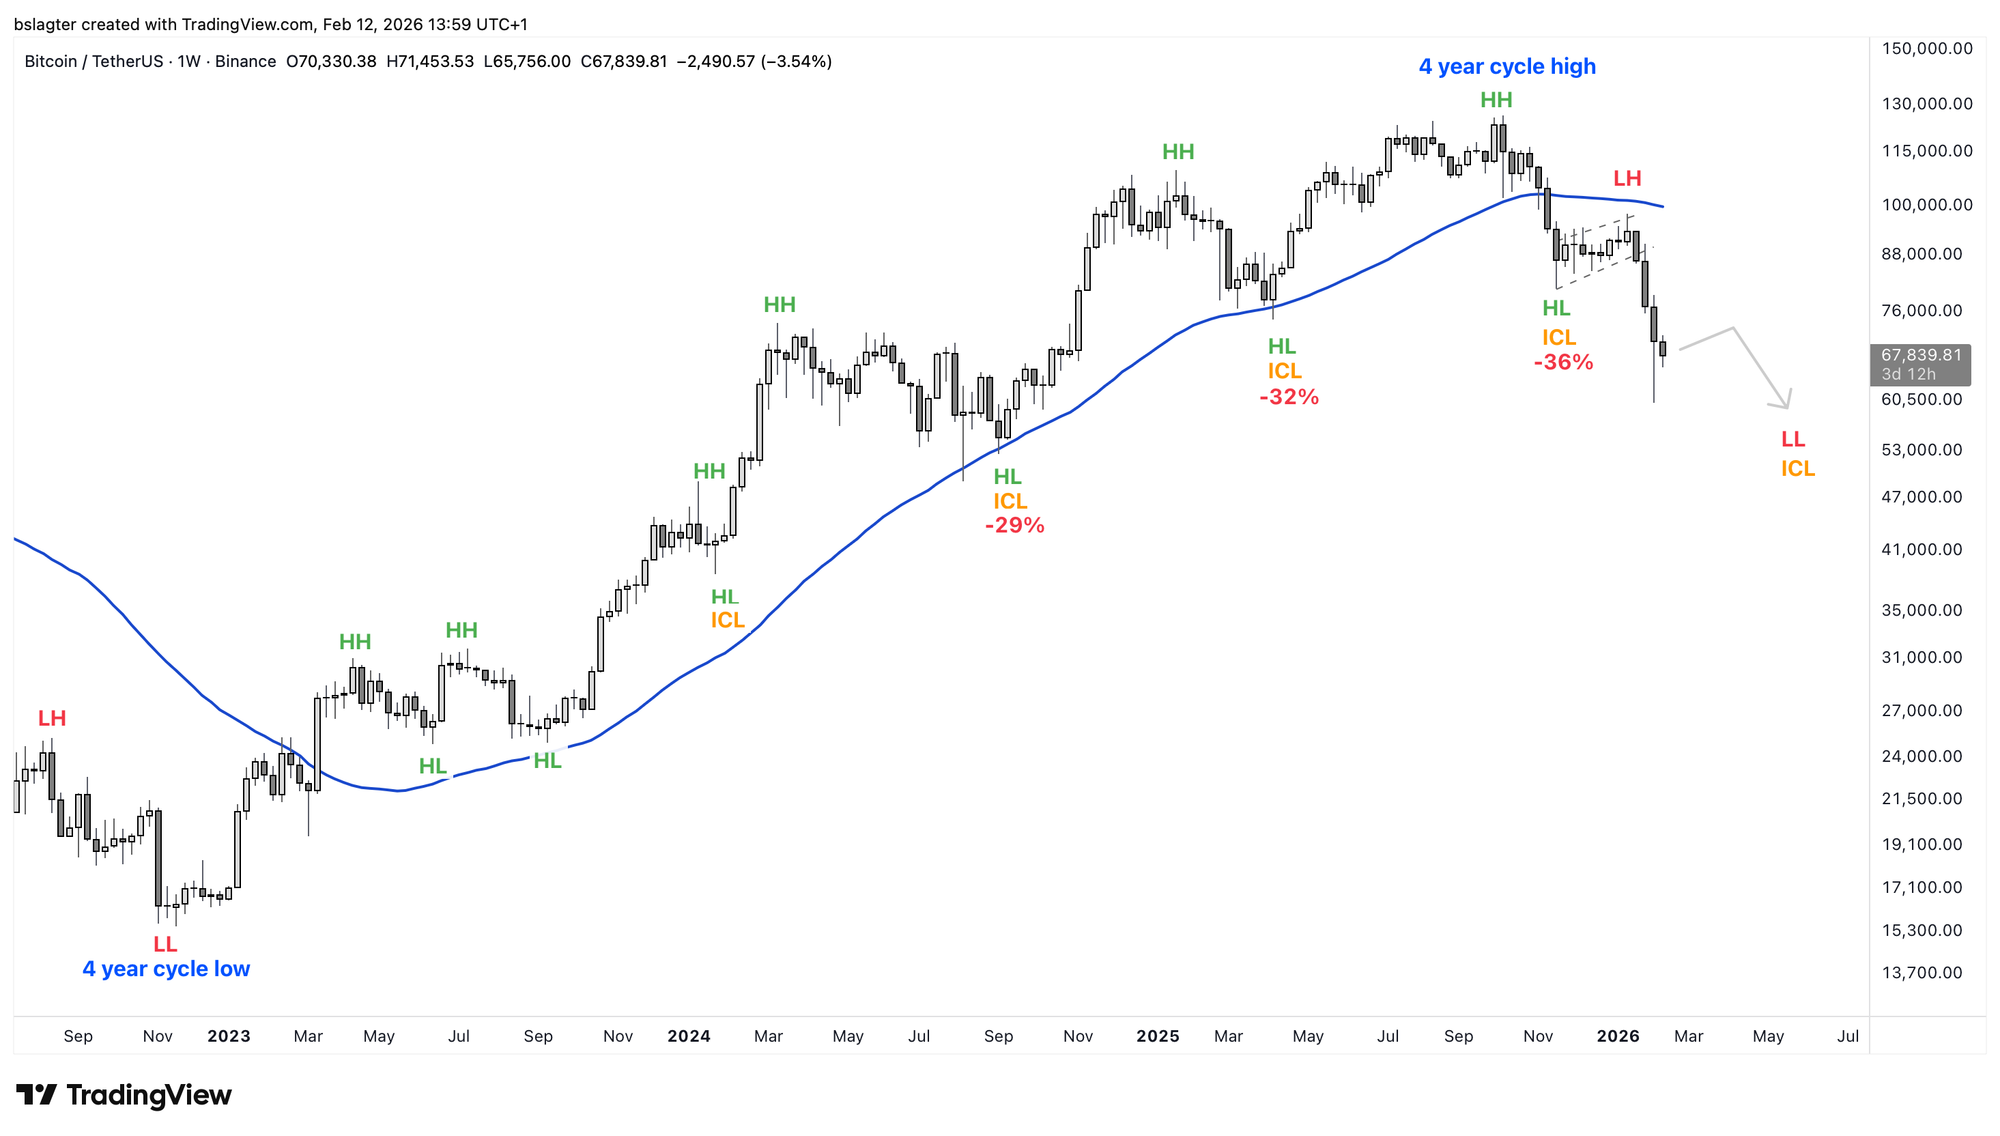
On the weekly chart below, we see the beginning of a downtrend. Price is below the dominant moving average, we have a lower high (LH) at $98,000, and we're heading toward a lower low (LL) below $80,000. A downtrend on the weekly chart is what we practically call "the bear market" in bitcoin.
Now that we've established we're in a bear market, it's time for a bear market plan, preparing ourselves for the next bull market.
We continue with the following topics for our Alpha Plus members:
- A plan for the bear market
- The coming weeks for bitcoin
- Bottom formation takes time
- A strange bear market for bitcoin
- Why bitcoin bear markets feel so uncomfortable

1️⃣ A plan for the bear market
Bert
Now that we've established we're in a bear market, it's time for the next chapter: the coming bull market.
Nassim Taleb talks about the 'risk of ruin'—the risk of bankruptcy, disqualification, or death. The stock of a company that goes bankrupt or the currency of a country that collapses suddenly becomes worthless. In that case, demand suddenly evaporates completely. The market ceases to exist. The music stops. And so does the rhythm of bull and bear markets.
If bitcoin doesn't suddenly cease to exist, another bull market will inevitably follow this bear market. There's no law of nature guaranteeing that bull market will reach higher than the previous one, but as long as adoption continues, that's the likely outcome.
When we talk about adoption, think of the number of people using bitcoin as an investment, savings vehicle, payment method, or infrastructure to build on. This is boosted by easier access through ETFs, banks, and brokers. By regulatory clarity and oversight. By the normalization of holding a small amount of bitcoin in a diversified portfolio. All of this is still happening.
Our investment hypothesis for the coming years is (a) that bitcoin won't cease to exist, meaning another bull market is coming, and (b) that adoption will continue, meaning the next bull market will take us to new all-time highs.
In last week's Markets, we discussed price and time targets for the bear market bottom. Let's revisit those first.
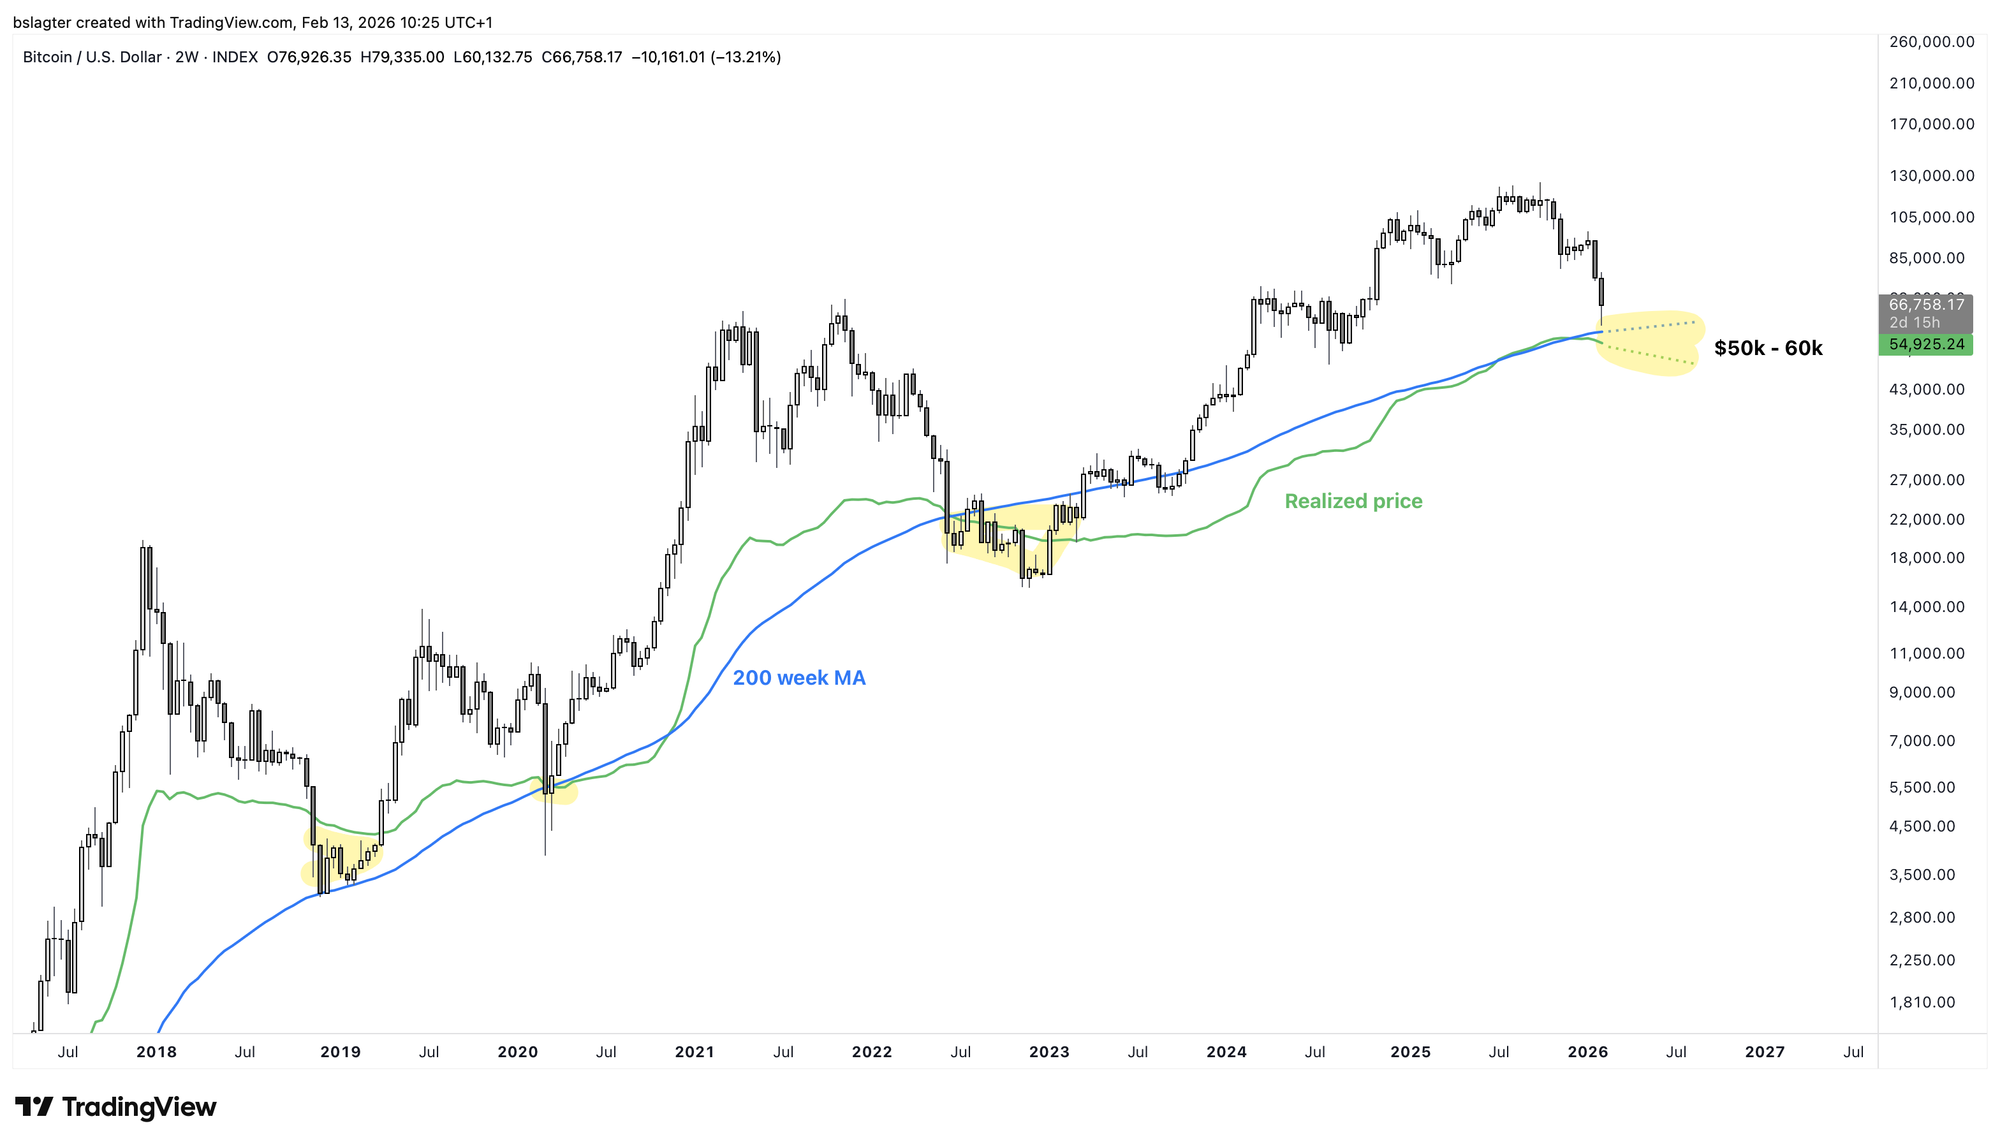
Price target. The 200-week moving average and the realized price are decent indicators of the point where investors on average are no longer in profit. Both currently sit around $57,000. Over the coming months, they'll diverge slightly, creating a zone between $50k and $60k.
An FTX-style capitulation would be needed to push us well below the realized price (MVRV = 1.0). If we were to drop to MVRV = 0.8 like in November 2022, that would correspond to a bottom at $45,000.
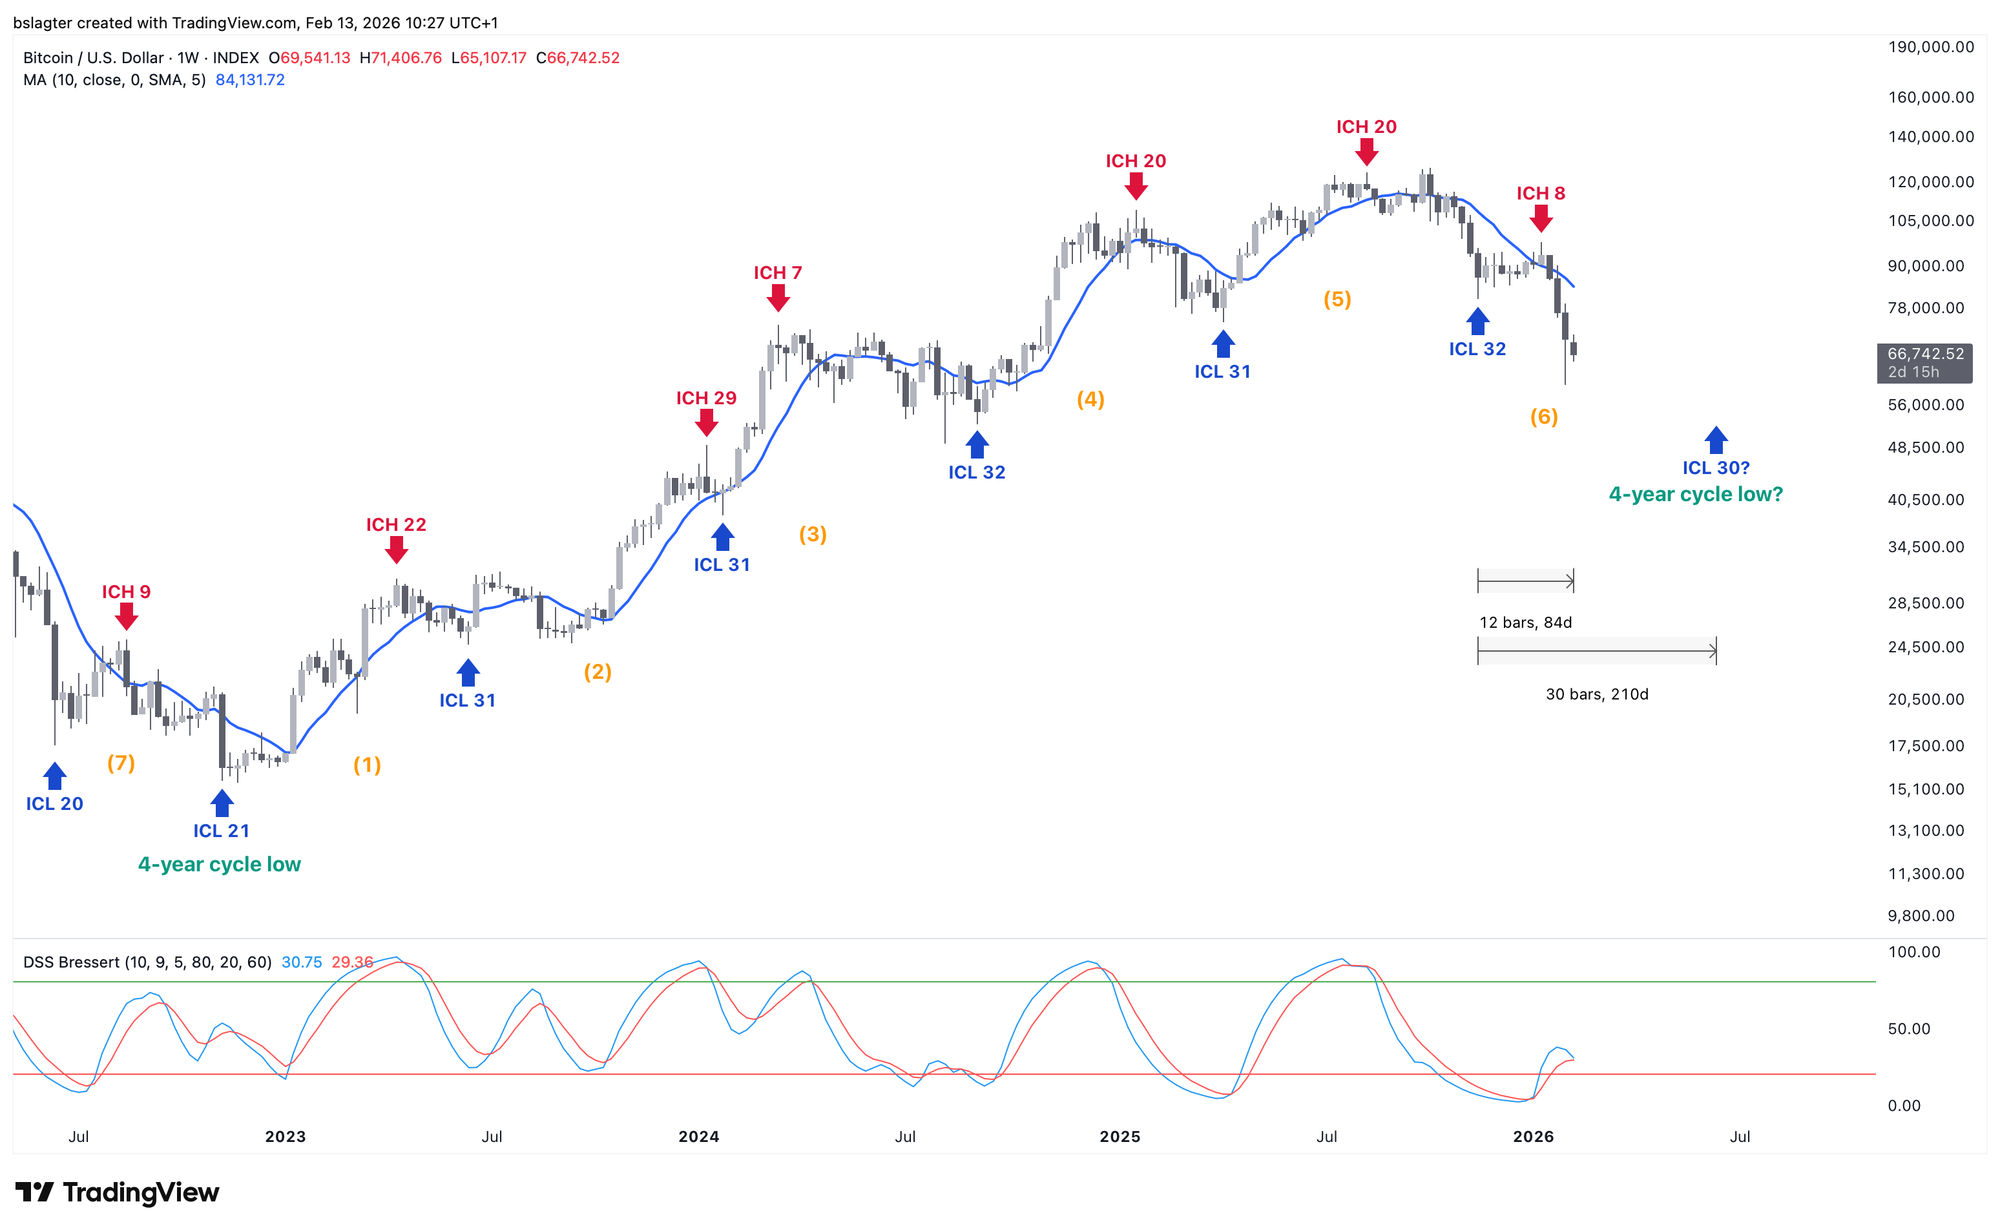
Time target. We're in week 12 of this weekly cycle. It has 'failed' and is therefore part of the declining phase of the yearly cycle. In the best case, the coming weekly cycle low (ICL) will also be the yearly cycle low (YCL). An average length of 30 weeks brings us to June this year.
How will we recognize whether the next weekly cycle is actually the beginning of a new bull market?
Based on the fundamental principle that a bull market is an uptrend on the weekly chart, we need to wait until we see a higher high (HH) or a higher low (HL). That could take a while. In 2023, we didn't see a higher high at $30,000 until April and a higher low at $25,000 until June.
An earlier indicator, just like at the bull market top, is the dominant moving average. On the weekly chart, this would mean a weekly close above the 50-week moving average. In 2023, we had that in March with a weekly close at $27,000.
From a cycle analysis perspective, an important piece of evidence is a monthly close above the 10-month moving average for the start of a new yearly cycle. This is comparable to a weekly close above the 50-week moving average.
That 'reverse handbrake' currently runs around $98,000. That's still a long way above $50k-$60k if that's where the bottom forms, but this moving average is dropping by about $1,000 per week. By June, that threshold will already be around $80,000.
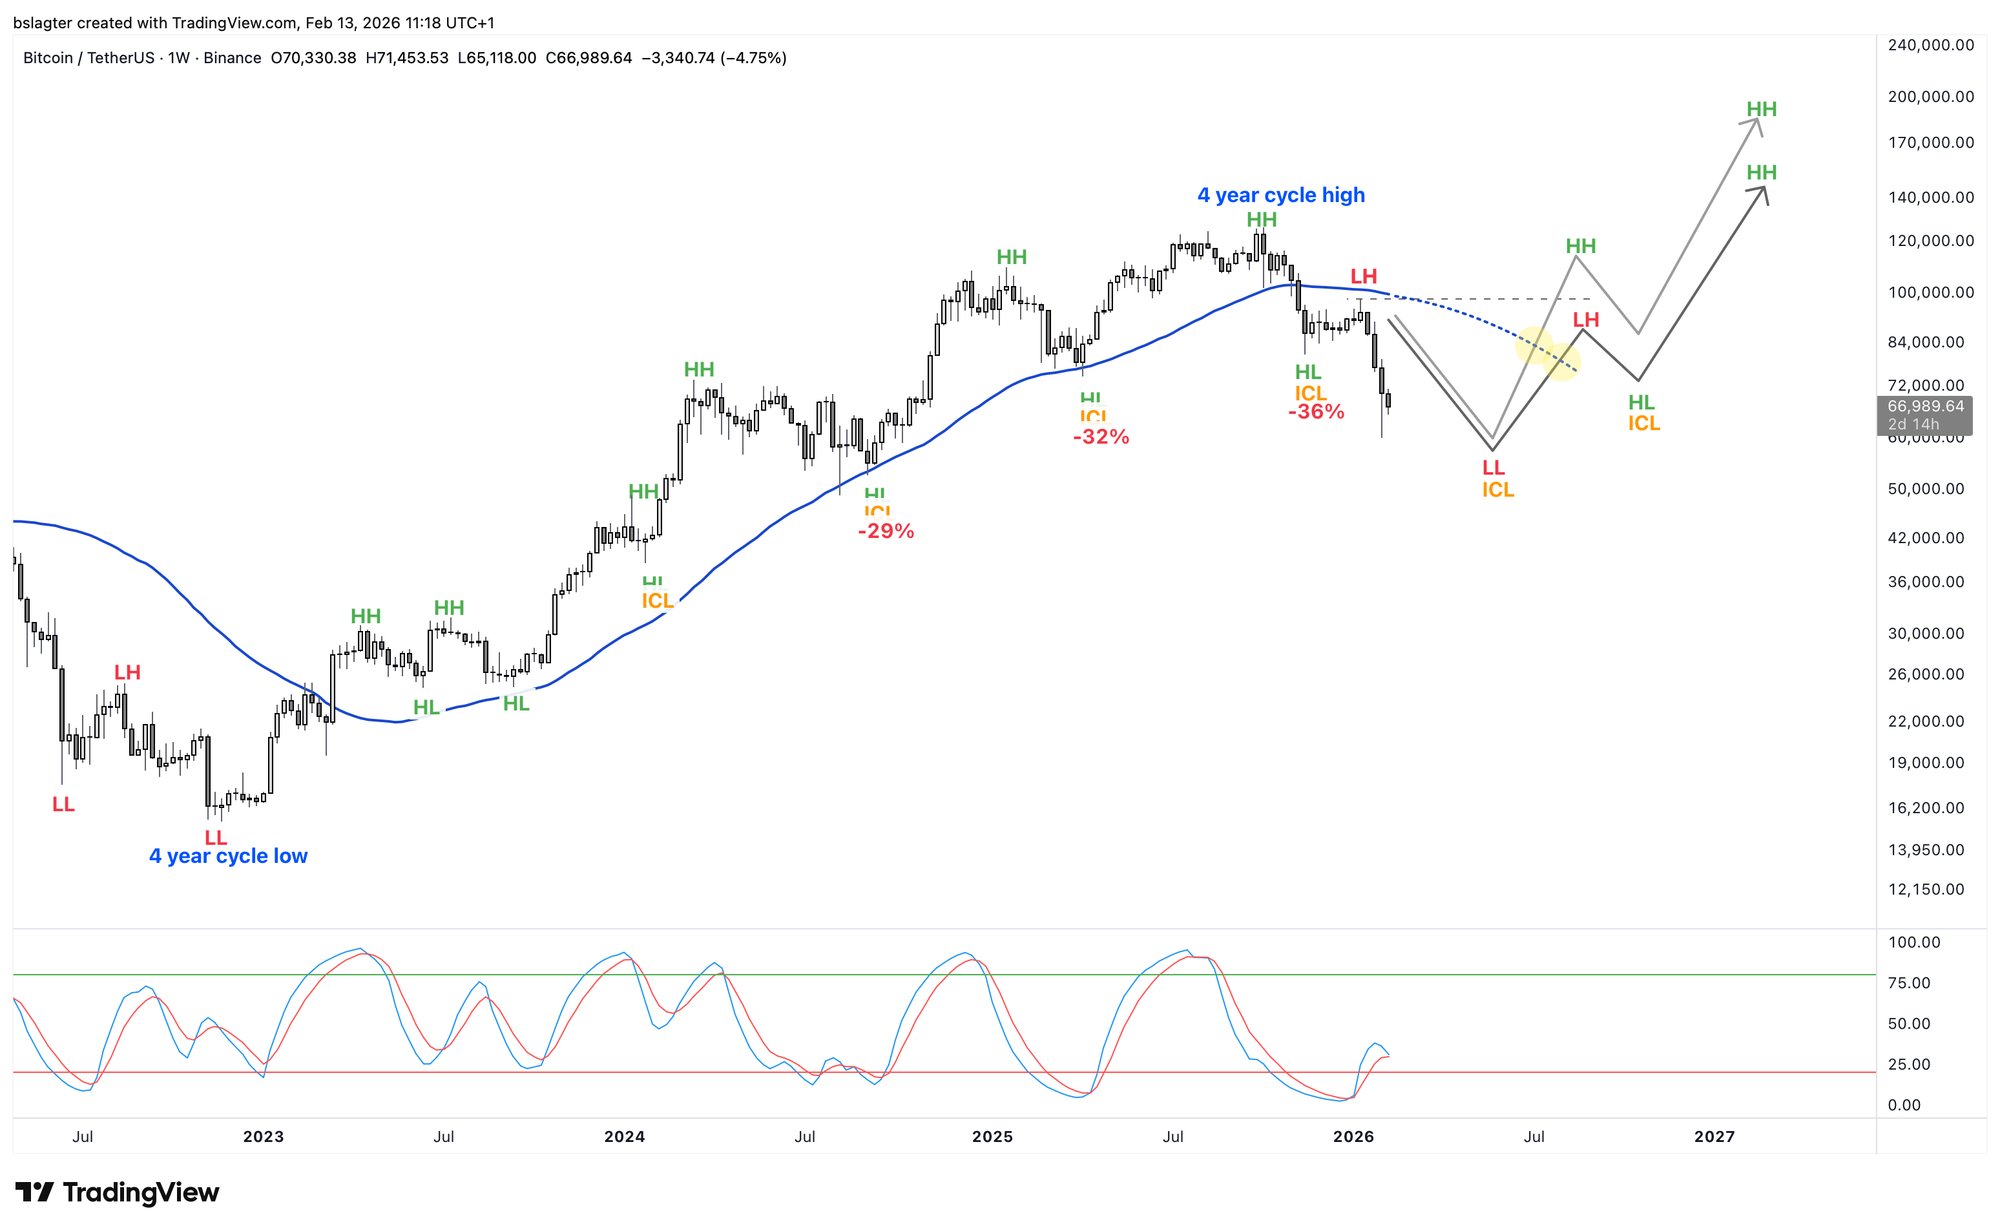
The chart above shows our base case scenario. The bear market could also form a bottom deeper and later, or conversely, earlier and less deep.
- In a bull market, it's impossible to make a perfect plan for taking profits.
- In a bear market, it's impossible to make a perfect plan for getting back in.
If we accept that our plan can't be perfect, the door opens to making a good plan. There are several good tactics for a bear market, and they more or less mirror the options you have in a bull market.
- You can enter on a weekly close above the 50-week moving average. The reversal of the handbrake.
- You can enter (weekly, monthly installments) from the moment price first drops below a certain threshold, such as $50k, $60k, or $70k.
- You can enter a position once price drops below the 200-week moving average.
- You can simply run your DCA stoically throughout the entire bear market, accumulating at the average price of the bear market.
Caleb Franzen, who has also been working with the base case that we're in a bear market since November, chose option three. He bought bitcoin for the first time in a while this week.
At $97k, I said Bitcoin was in a new bear market.
— Caleb Franzen (@CalebFranzen) February 12, 2026
At $97k, I said every bear market retested its 200W MA.
At $97k, I said that I'd buy the 200W MA cloud retest.
Now... nearly 3 months later, here we are...
On the 200W moving average cloud.
So I bought Bitcoin. pic.twitter.com/fG1DZPSid0
2️⃣ The coming weeks for bitcoin
Bert
Our base case is that we need more time and/or depth before starting a new bull market. But that doesn't mean price can only go down.
In most bear markets, you also see periods of strength and recovery. We now have four red months behind us, and February will be the fifth if we close below $78,000. That's already exceptional.
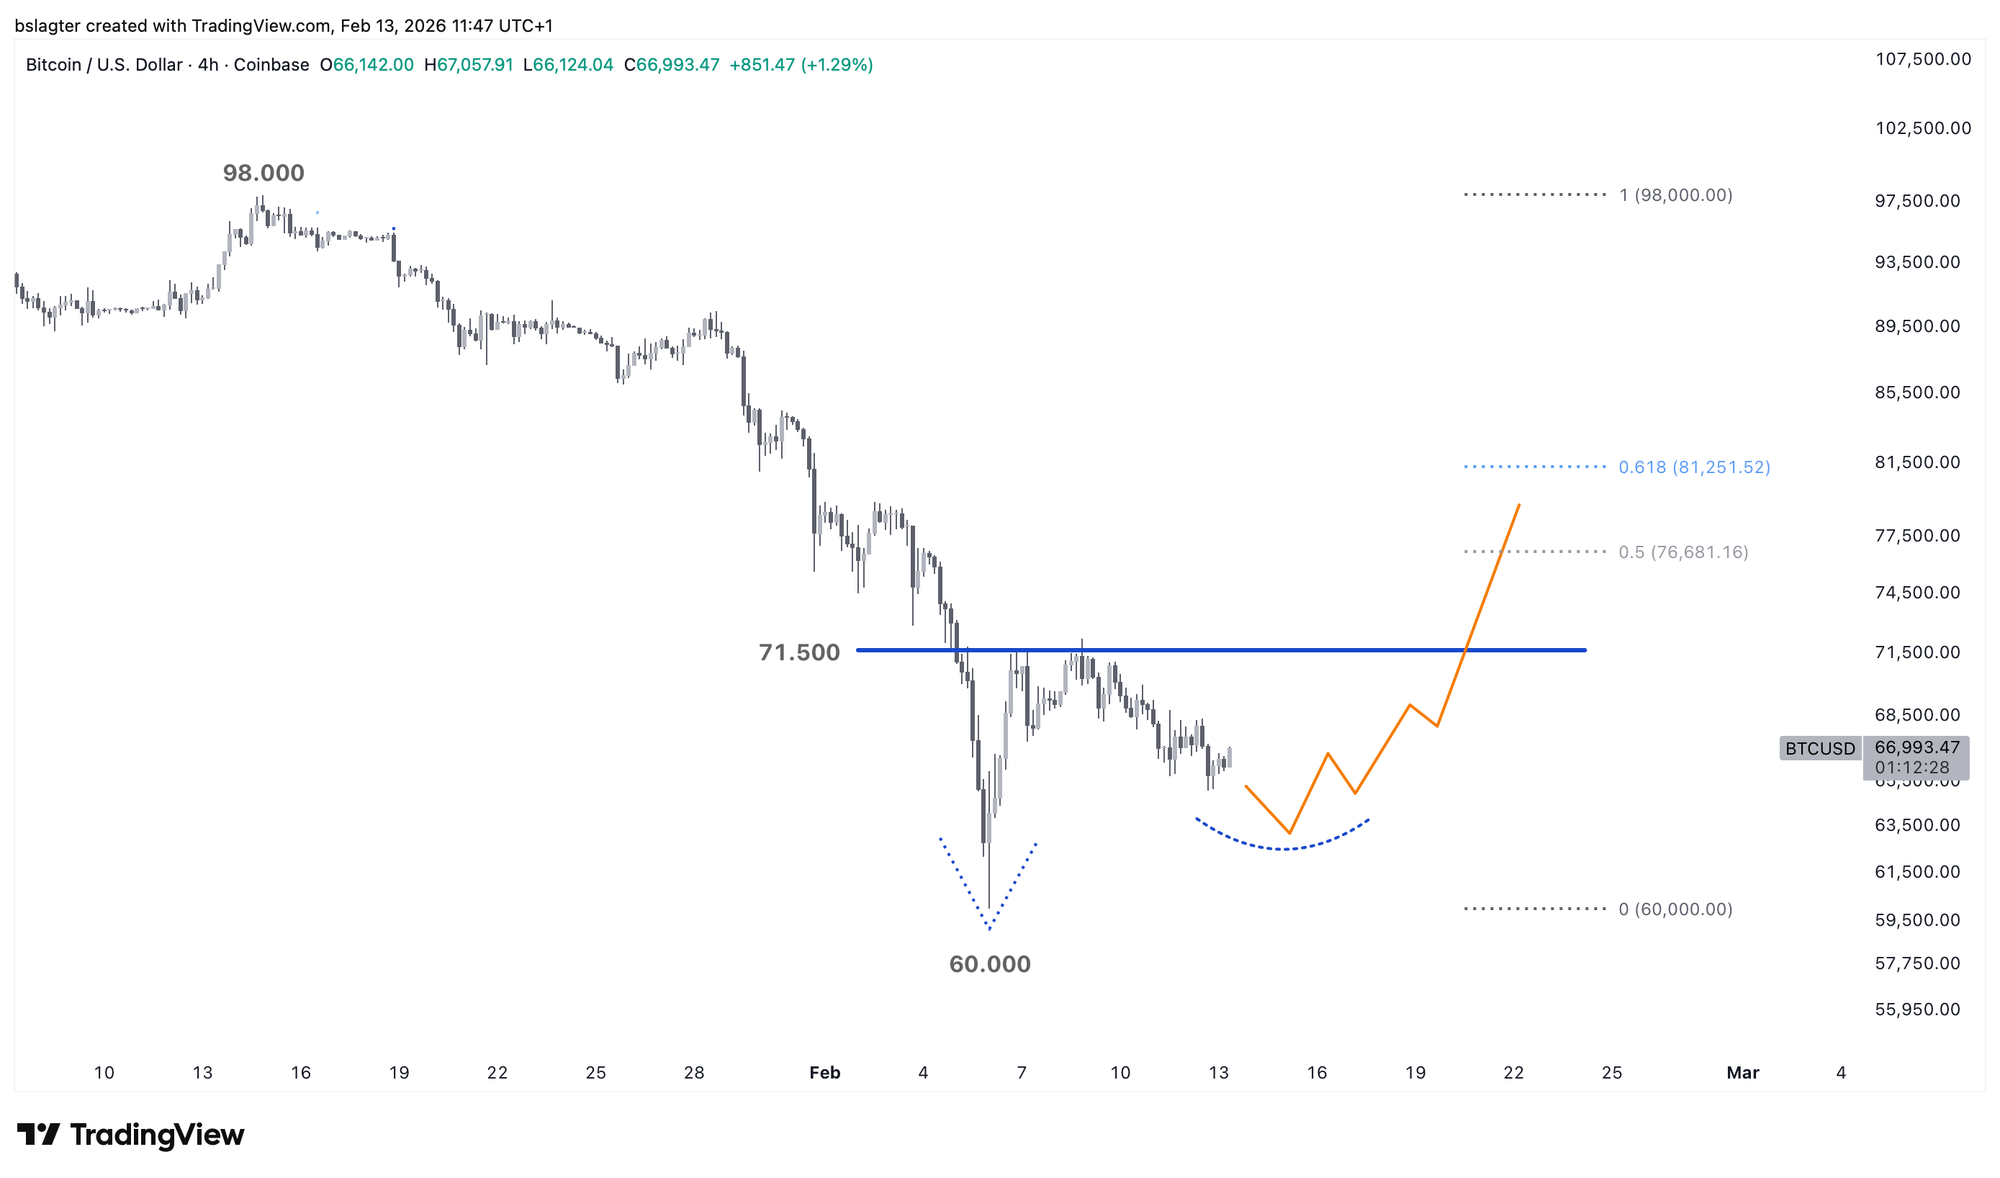
On the chart, we see the beginnings of several patterns that indicate a reversal from a short-term downtrend to an uptrend. A double (Adam & Eva) bottom or an ascending triangle, for example. For all of them, confirmation requires acceptance above $71,500.
Above that level, a rise toward prices around $80,000 is likely. That's also where the capitulation bottom of November 21st lies. But the premise remains that this is a bear market rally, on the way to a definitive bear market bottom later this year.
3️⃣ Bottom formation takes time
Sam
You'll often hear analysts say when asked whether we've reached the bottom after a sharp decline: "Time will tell."
Analysts say this because nobody knows what the future holds. However, in most cases, bottom formation takes time.
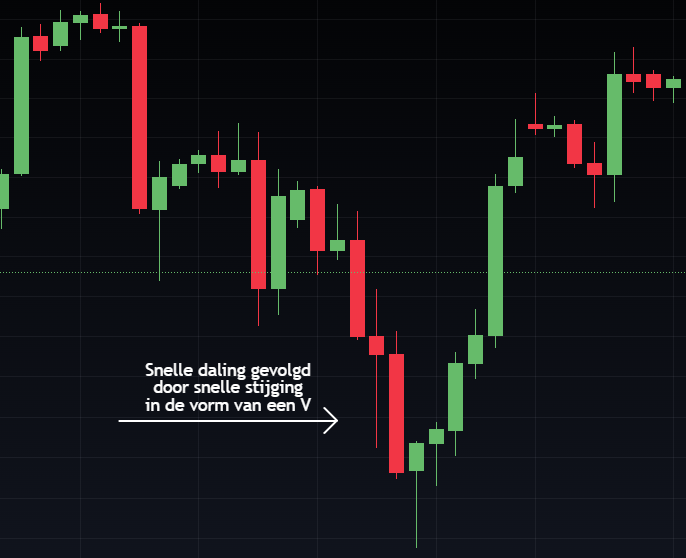
What precedes a bottom is a (period of) decline. During this time, sellers have been stronger than buyers. In some cases, this happens due to a market shock resulting in a sharp price drop. The subsequent removal of panic then leads to a quick price recovery. This is also called a V-bottom, and an example is shown in the image below. V-bottoms are not common on higher timeframes.
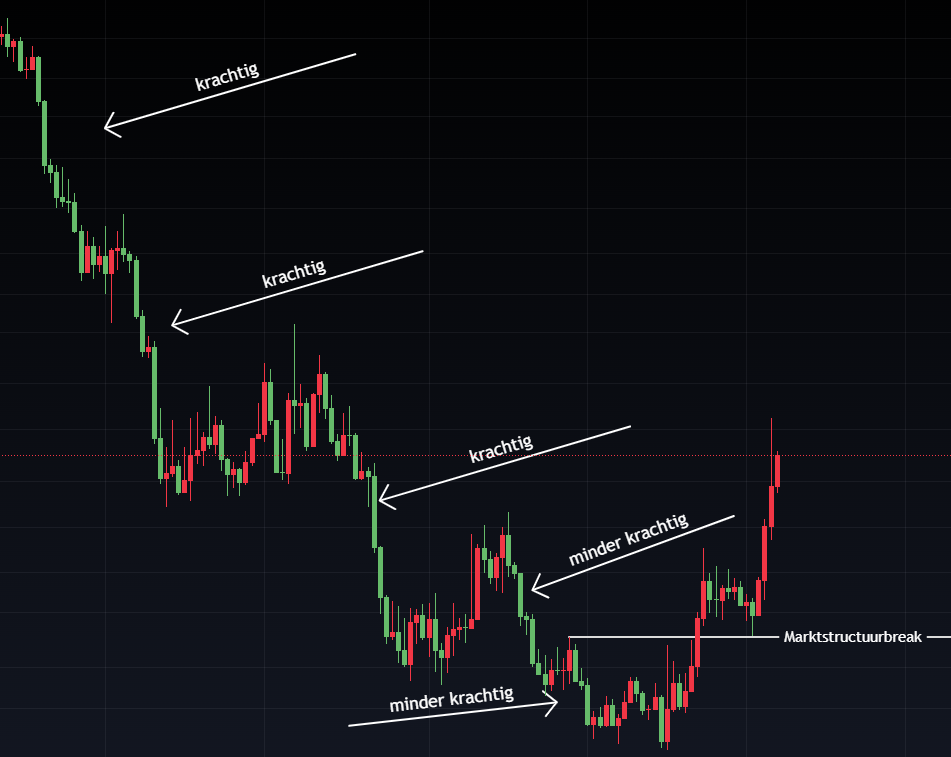
A bottom is generally more often formed through loss of momentum. The strong downtrend then slowly transitions into a regime where each new low comes progressively less far below the previous low.
This weakening is often visible in momentum indicators, such as through divergence on the RSI or flattening EMAs. This is a sign that sellers are less eager to sell and buyers consider the price low enough to enter. A good time to enter is once the loss of momentum is confirmed by setting a higher high.
These bottoms require more daily and weekly closes to form, which is why time will have to tell whether we're close to a bottom after a sharp decline.
4️⃣ A strange bear market for bitcoin
Thom
In a classic bear market, it's usually fairly easy for investors to pinpoint where things went wrong for bitcoin. In 2022, for example, a series of major players collapsed while financial conditions deteriorated rapidly. Central banks aggressively raised interest rates to tame the inflation wave, credit became scarcer, and risk appetite vanished from the market. That formed a logical backdrop for falling prices.
This time is different. Sure, you can point to gold's strong advance or the sharp drop on October 10th, but truly convincing explanations are lacking. In fact, the broader investment climate on paper actually appears supportive. Financial conditions have actually eased further in recent months.
By financial conditions, we mean how easy or difficult it is to borrow money, invest, and take risk in the economy. You can think of it as 'the weather' in financial markets. Since late 2022, that weather has gradually improved. Credit became more accessible, liquidity increased, and pressure from high interest rates began to slowly subside.
We can clearly see this development in the National Financial Conditions Index (NFCI) from the Chicago Fed. This index, constructed from more than a hundred financial variables, declines when conditions ease. Historically, bitcoin tends to respond positively to this: looser financial conditions often coincide with rising prices, while tightening tends to create pressure.
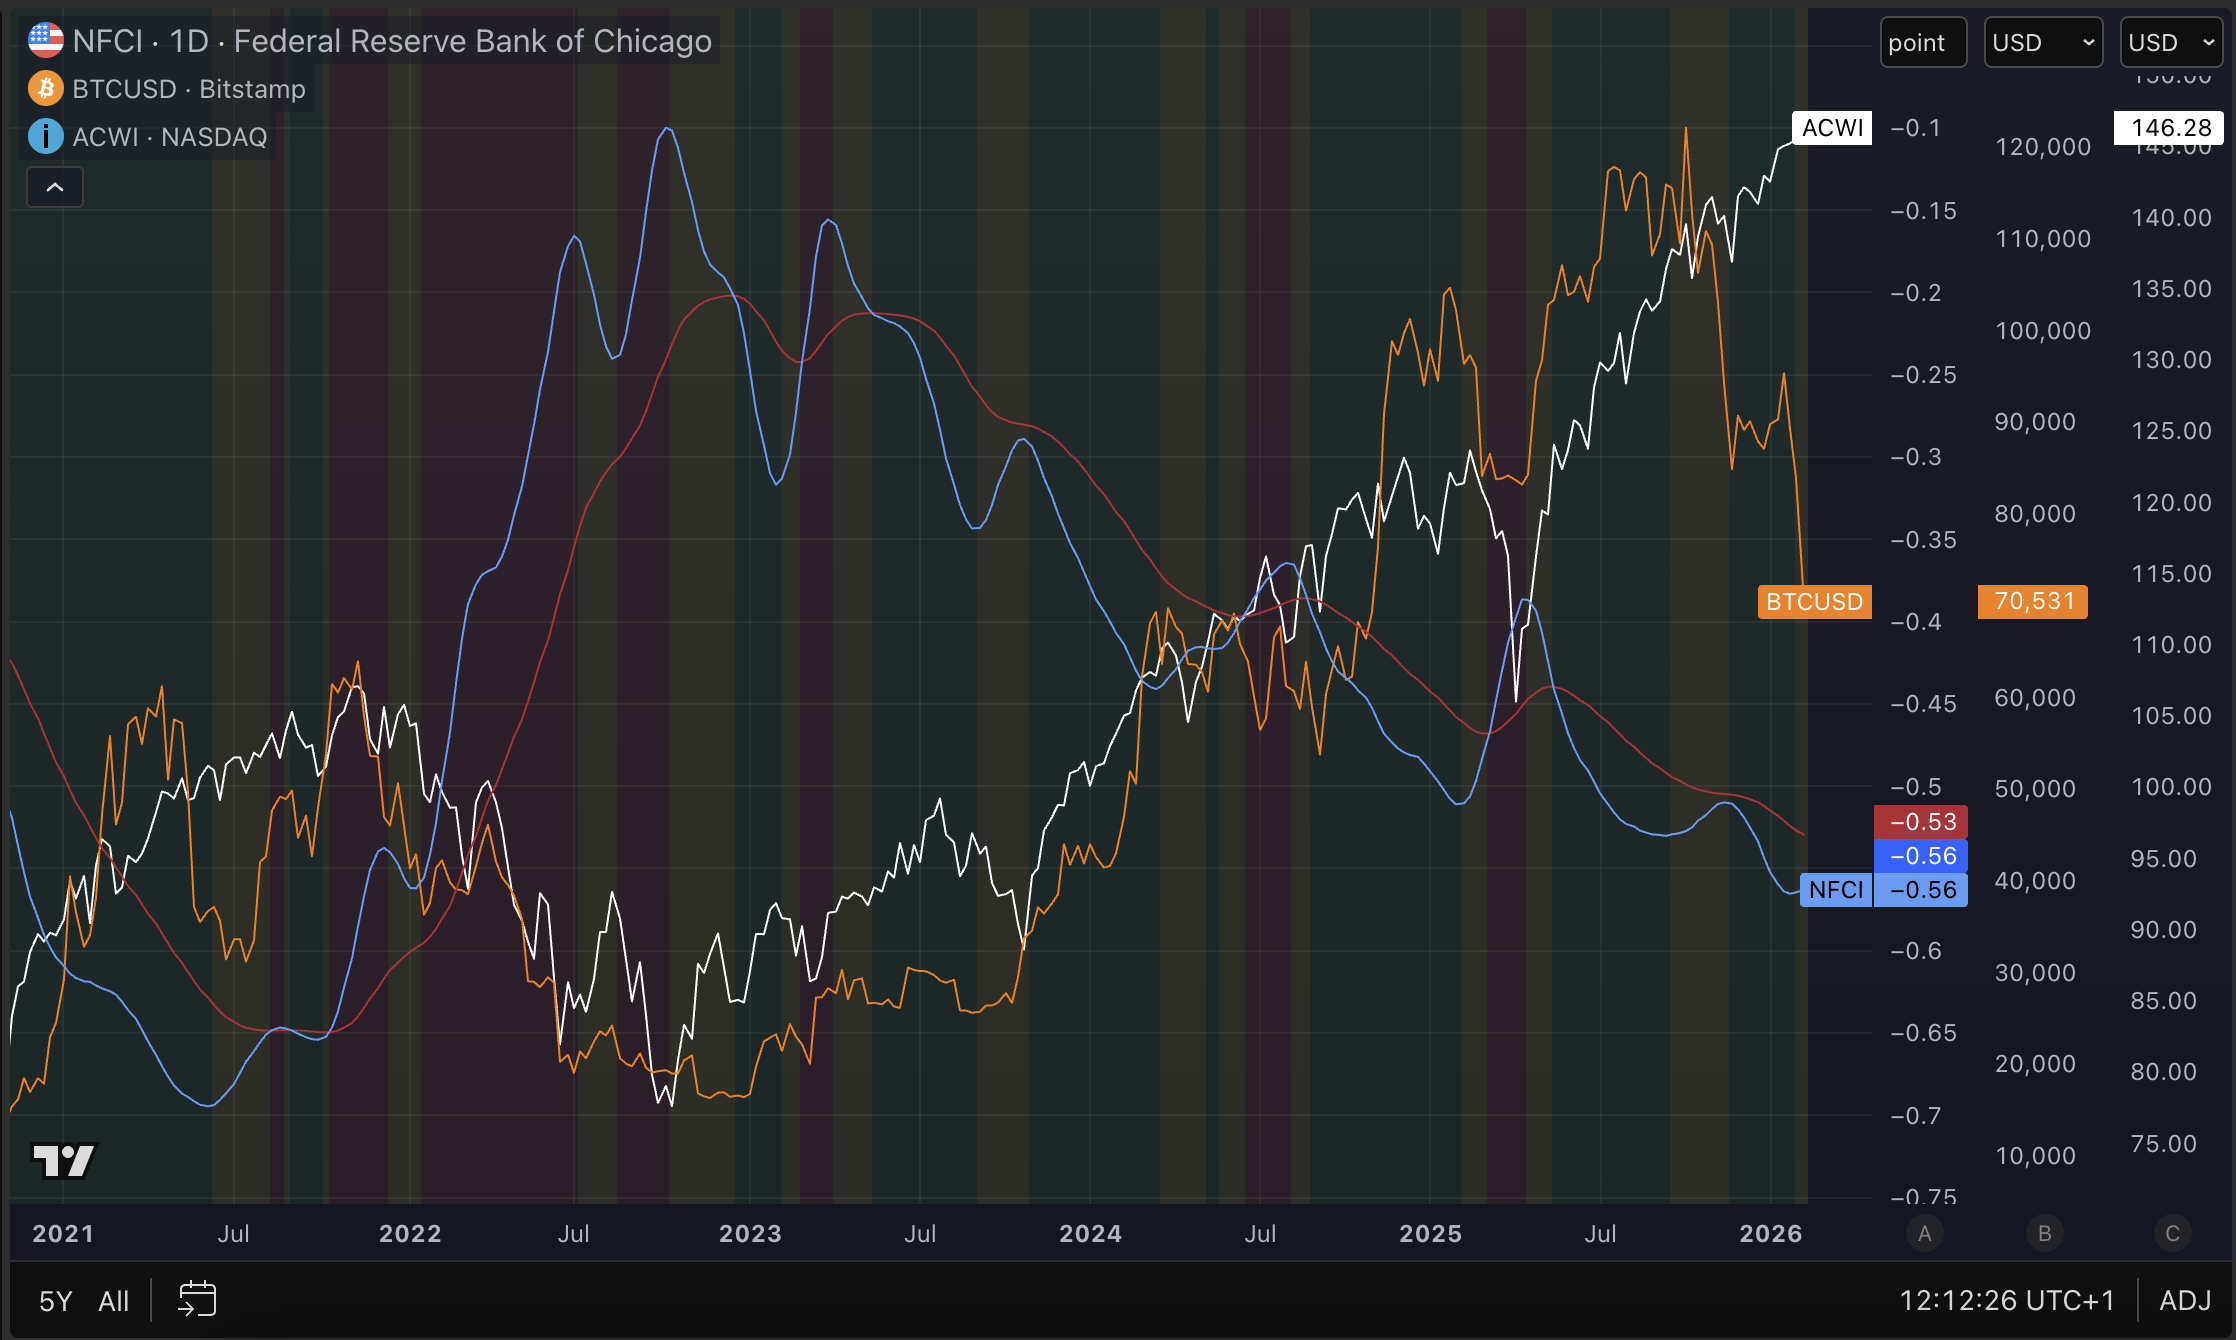
That's exactly where the friction lies now. Since October 2025, financial conditions have been easing again, but instead of rising, the bitcoin price began to decline. Meanwhile, global equity markets, measured via the ACWI index, managed to continue climbing.
This week too, we saw macroeconomic data from the United States mostly surprise to the upside. The jobs report came in better than expected, as did many other key data points from recent periods.
For bitcoin, it seems to be primarily a lack of momentum. Fundamentally speaking, the investment climate remains favorable. I therefore consider it unlikely that bitcoin's bottom lies much lower than the $60,000 we've already seen.
5️⃣ Why bitcoin bear markets feel so uncomfortable
Thom
We find ourselves once again in a phase where bitcoin obituaries are flying around our ears.
"It was fun while it lasted. Trillions of dollars flowed into an asset that produces nothing, yields no interest, and is completely dependent on the next investor willing to pay more," according to someone under the pseudonym Shah.
Social media is currently teeming with statements like these. That fits with where bitcoin currently sits in the cycle. As price continues to sink, confidence in bitcoin's narrative as digital gold slowly crumbles.
And then the existential question inevitably surfaces: what is bitcoin, actually?
You can't hold it, see it, or feel it. At its core, it's nothing more than a number on a screen. When gold declines, at least something tangible remains: a physical metal with thousands of years of history, stored in central bank vaults around the world.
Even with stocks, there's something to hold onto. Microsoft stock can drop thirty percent, but behind it still stands a company that makes products we use daily. There's revenue, profit, and an economic reality.
Bitcoin has none of that. No factory, no cash flows, no tangible form. When price rises, it's easy to believe in the idea of bitcoin as digital gold. During declines, what remains is mostly a sense of emptiness and doubt. And that's precisely why bear markets in bitcoin feel so uncomfortable: there's nothing to hold onto except trust.
Although I've been on this ride several times now, it still feels uncomfortable. Yet I always manage to hold onto the idea that bitcoin is the discovery of digital scarcity. An asset with a limited supply that you can verifiably teleport to the other side of the world within ten minutes.
At this moment, bitcoin's total market cap is still more than twenty times smaller than gold's. I would be surprised if that's still the case ten years from now. In a world that's increasingly digitizing, there must, in my view, also be a place for digital scarcity.
In closing
All previous editions of Alpha Markets can be found in the archive. Questions, comments, and suggestions are always welcome in the community.
Thank you for reading!
To stay informed about the latest market developments and insights, follow our team members on X:
- Bart Mol (@Bart_Mol)
- Peter Slagter (@pesla)
- Bert Slagter (@bslagter)
- Mike Lelieveld (@mlelieveld)
We appreciate your continued support and look forward to bringing you more comprehensive analysis in our next edition.
Until then!