A New Baseline Scenario for Bitcoin
Bitcoin’s battle for $100k rages on amid eight months of wild peaks and testing support. ETF success, shifting policies, and “chopsolidation” hint at a cycle shift. Is this the end of the bull run, or just the calm before crypto’s next explosive move?

This Bitcoin bull market centers on the battle to hit the $100,000 mark.
Even in the previous cycle, that was the key milestone. With slogans like “laser eyes till 100k” and “100k by conference day,” we had hoped to cross that magic threshold in 2021. That didn’t happen – the ticker stalled at $69,000.
The bottom of the subsequent bear market, following a series of spectacular collapses – Luna, Celsius, FTX – settled at $15,500. The yearly low on November 21, 2022, marked the end of that market cycle and the start of the current one.
This time, however, it worked. The combination of highly successful Bitcoin ETFs and the potential dismantling of Biden’s anti-crypto policies pushed the price toward $100k by the end of 2024. On December 5, a six-digit number appeared on the tickers for the first time.
That was just the start of a grueling battle that would last more than eight months – and perhaps isn’t even over yet. It’s not solely about reaching $100,000; it’s about long-term investors exiting at that level and passing on their Bitcoin to new investors.
In the zone between 108k and 112k, five peaks signal five attempts to break above 100k. Each time, gravity proved too strong. It seemed to work momentarily around mid-July when the price jumped from $108,000 to $123,000 in just five days. Could we now surge directly to $150,000?
Unfortunately, no.
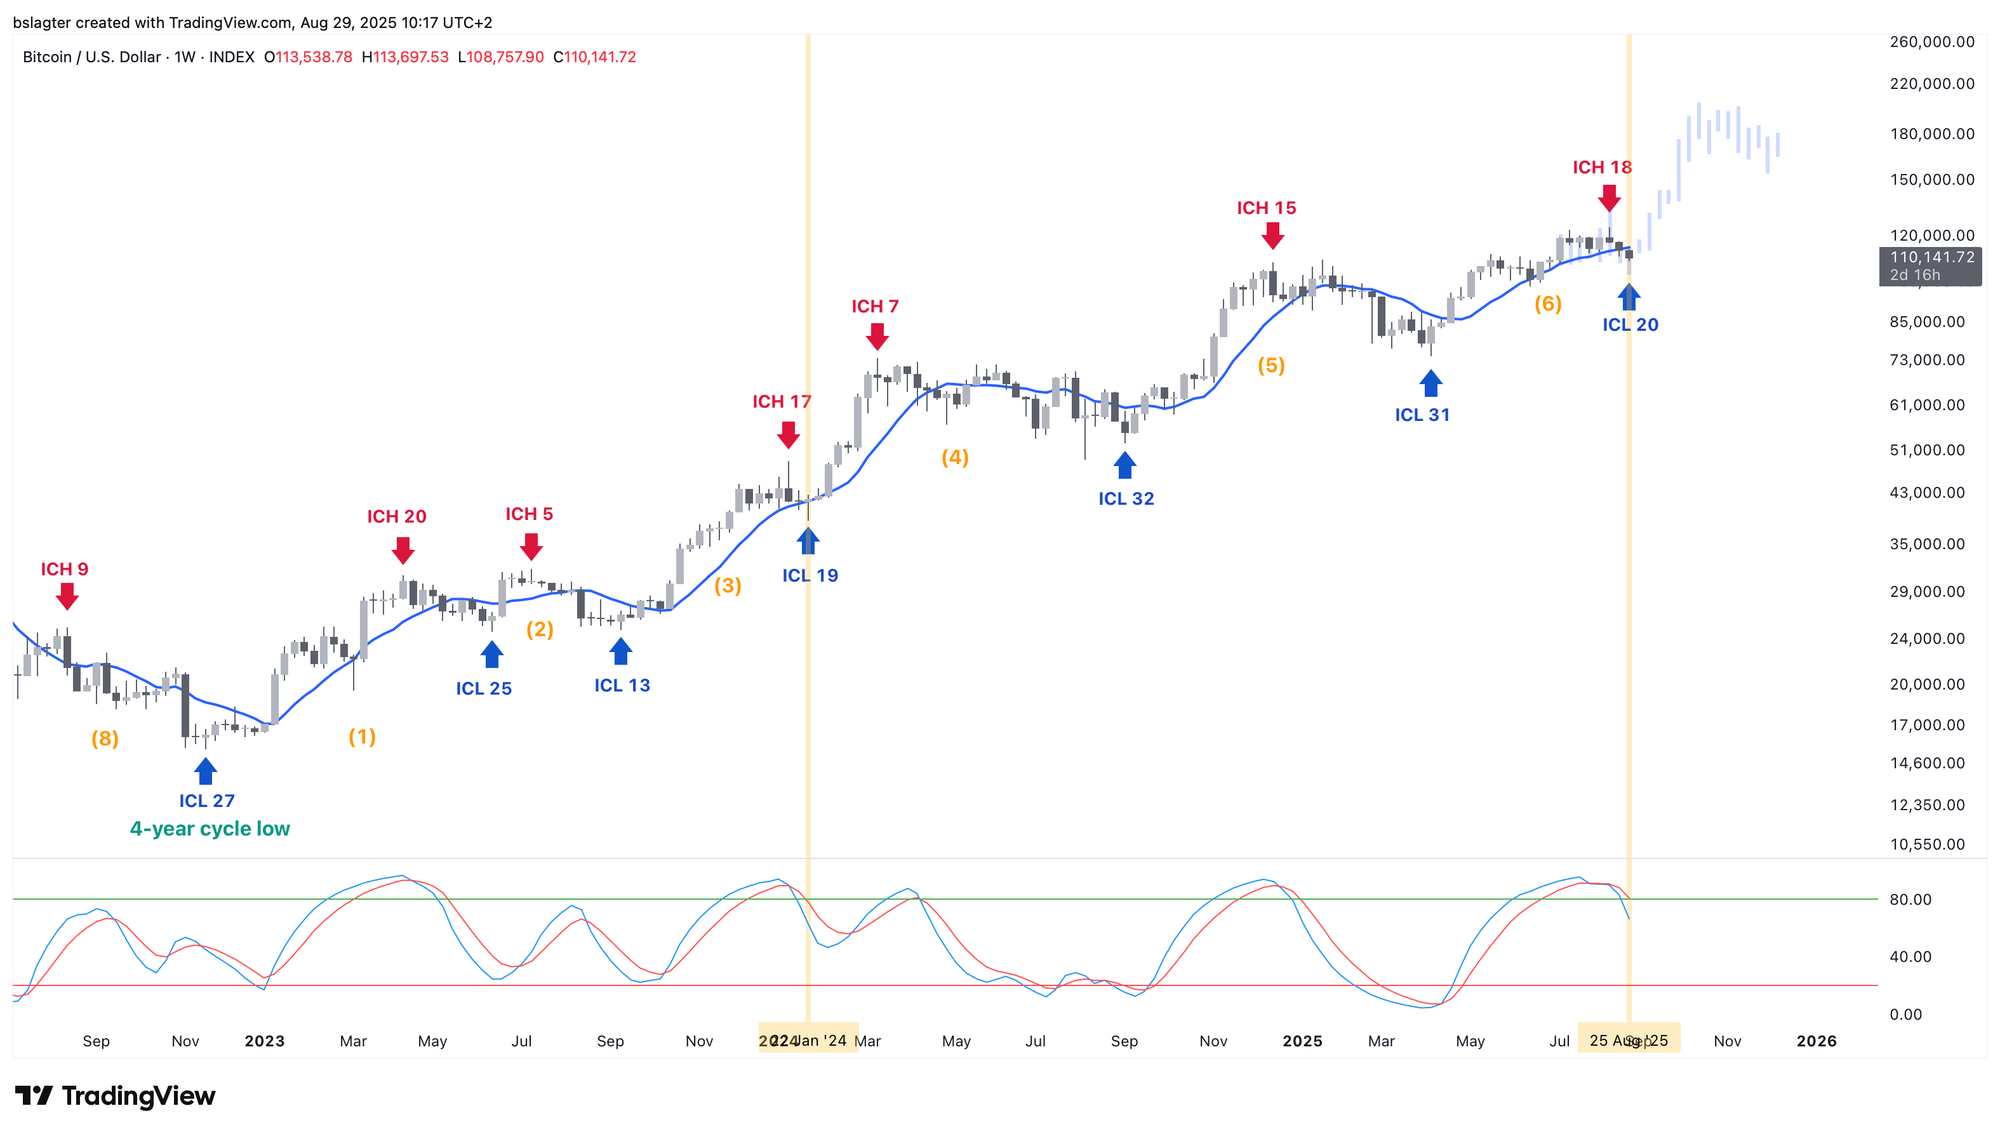
Over the past two weeks, the price has retreated back into the 108k to 112k range, where it has so far found support. Analysts widely share a chart like the one below, noting that we are witnessing a robust test of earlier peaks.
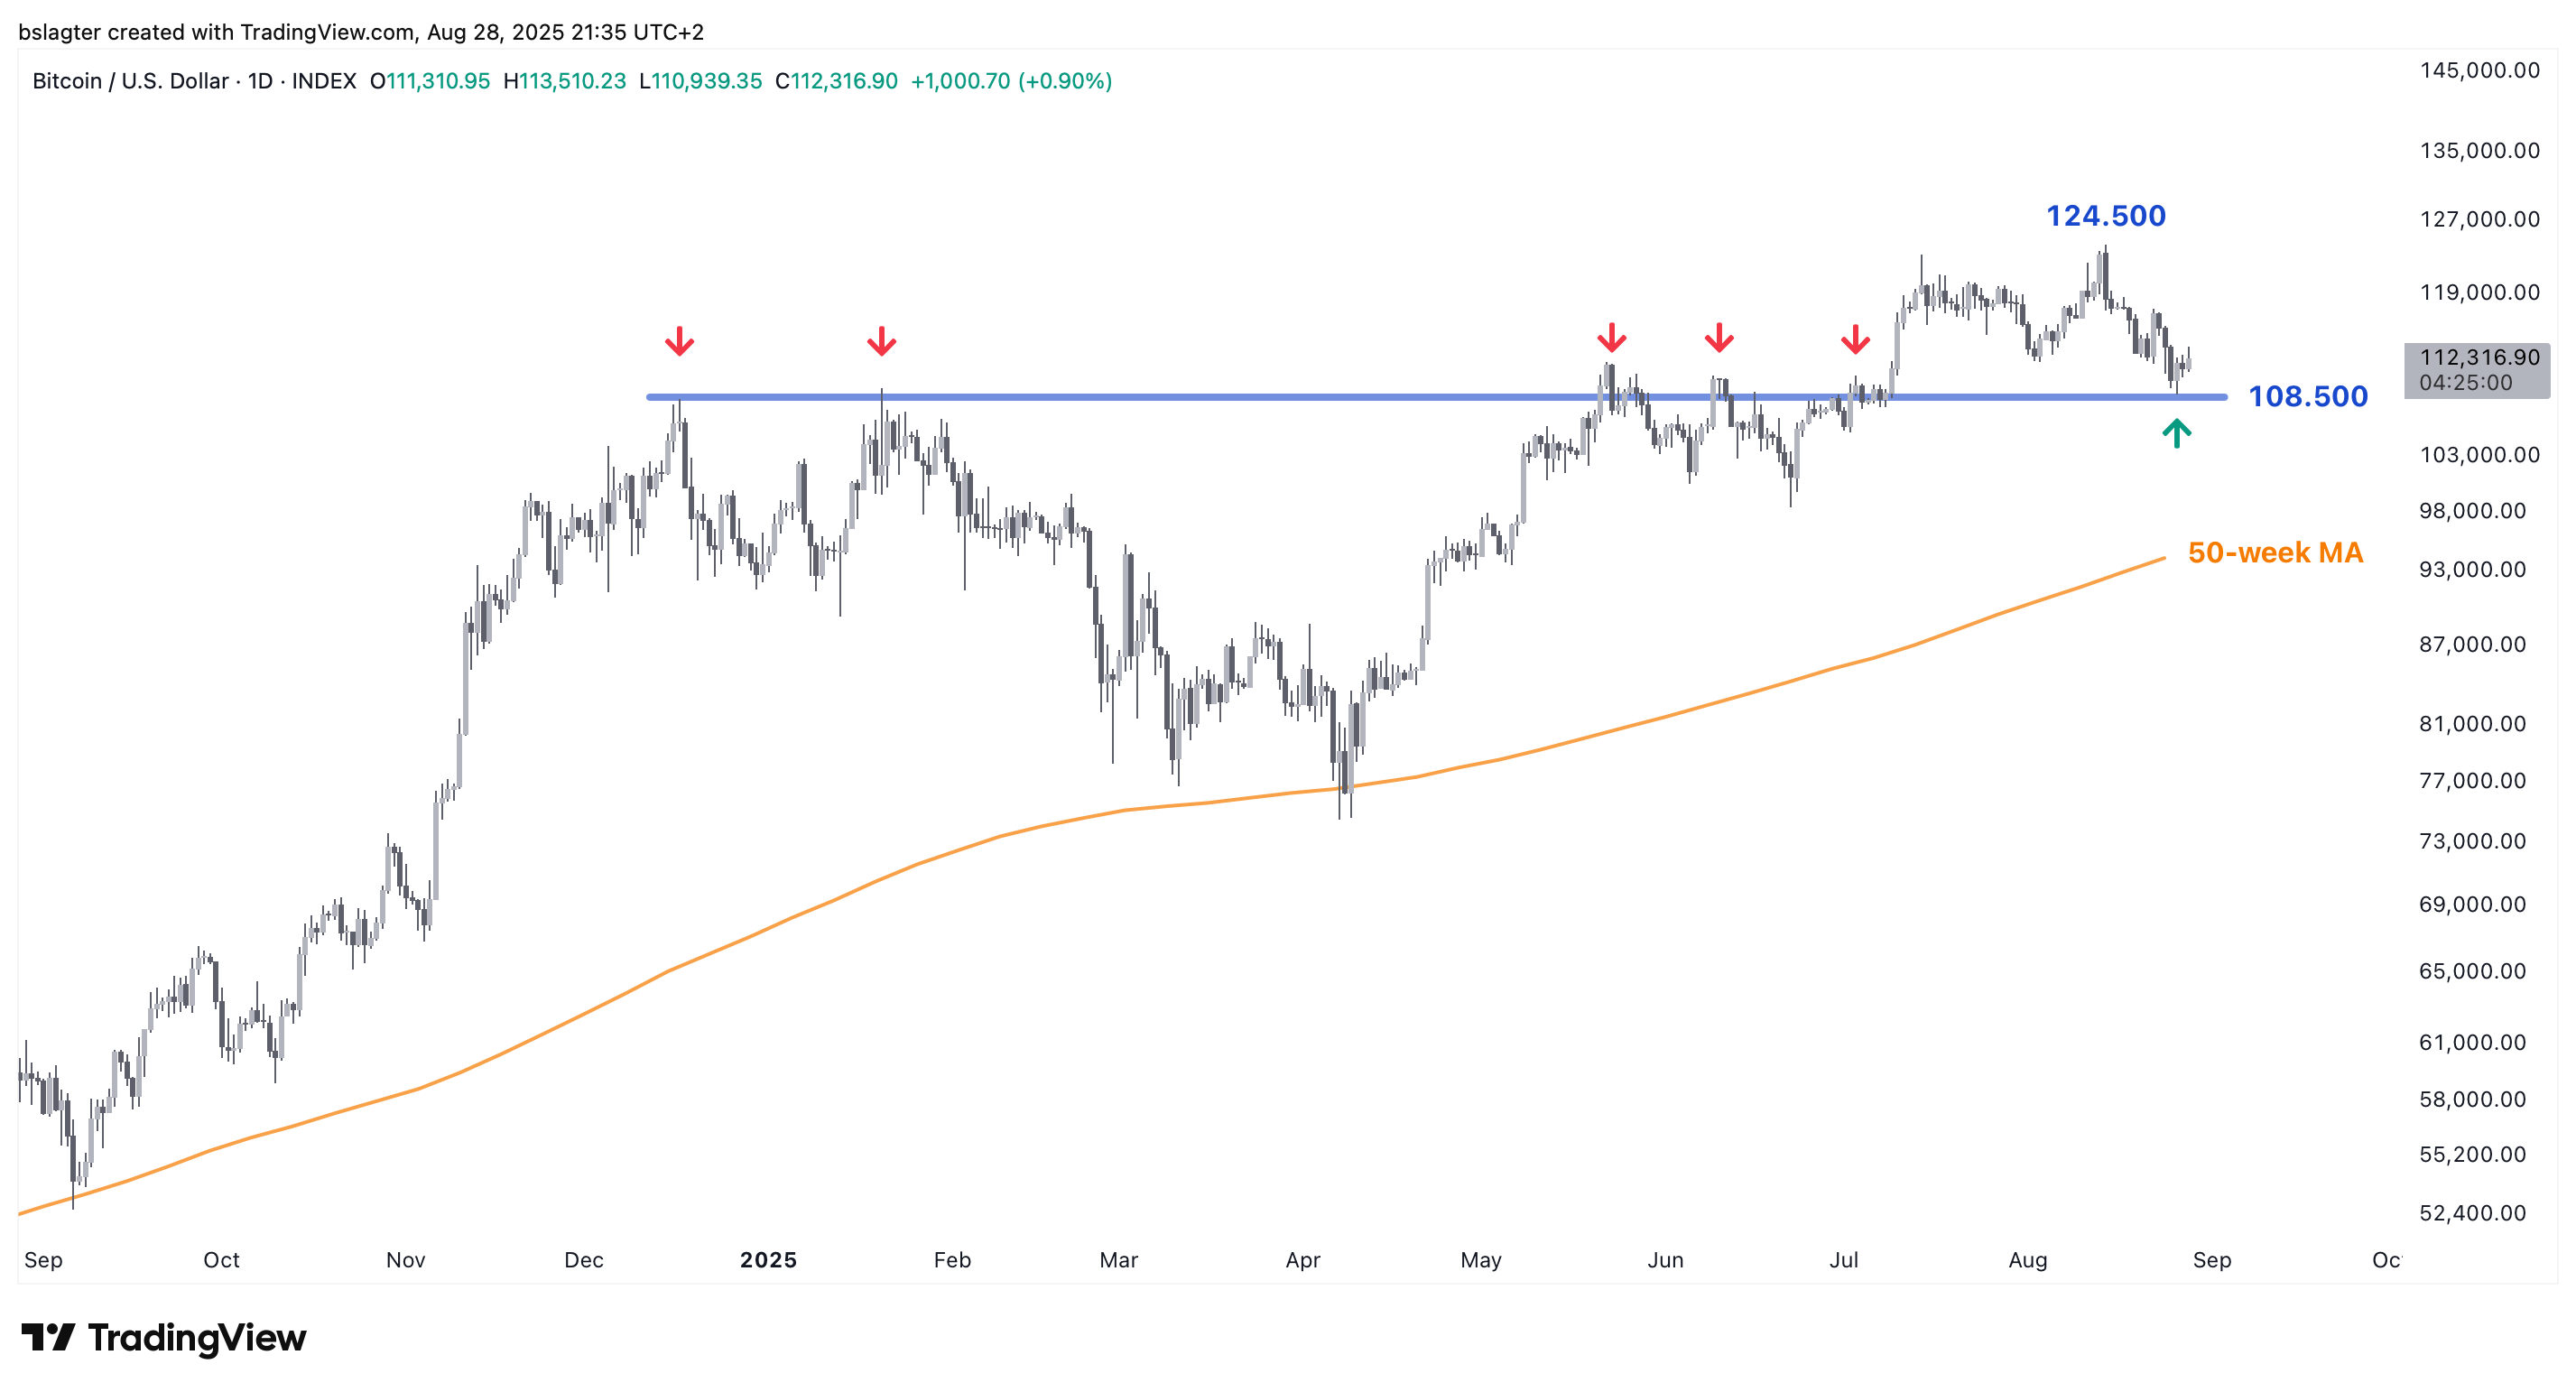
However, we seriously consider that this support may not hold, and in the coming weeks prices might oscillate between $93,000 – where the 50-week average currently sits – and $108,000.
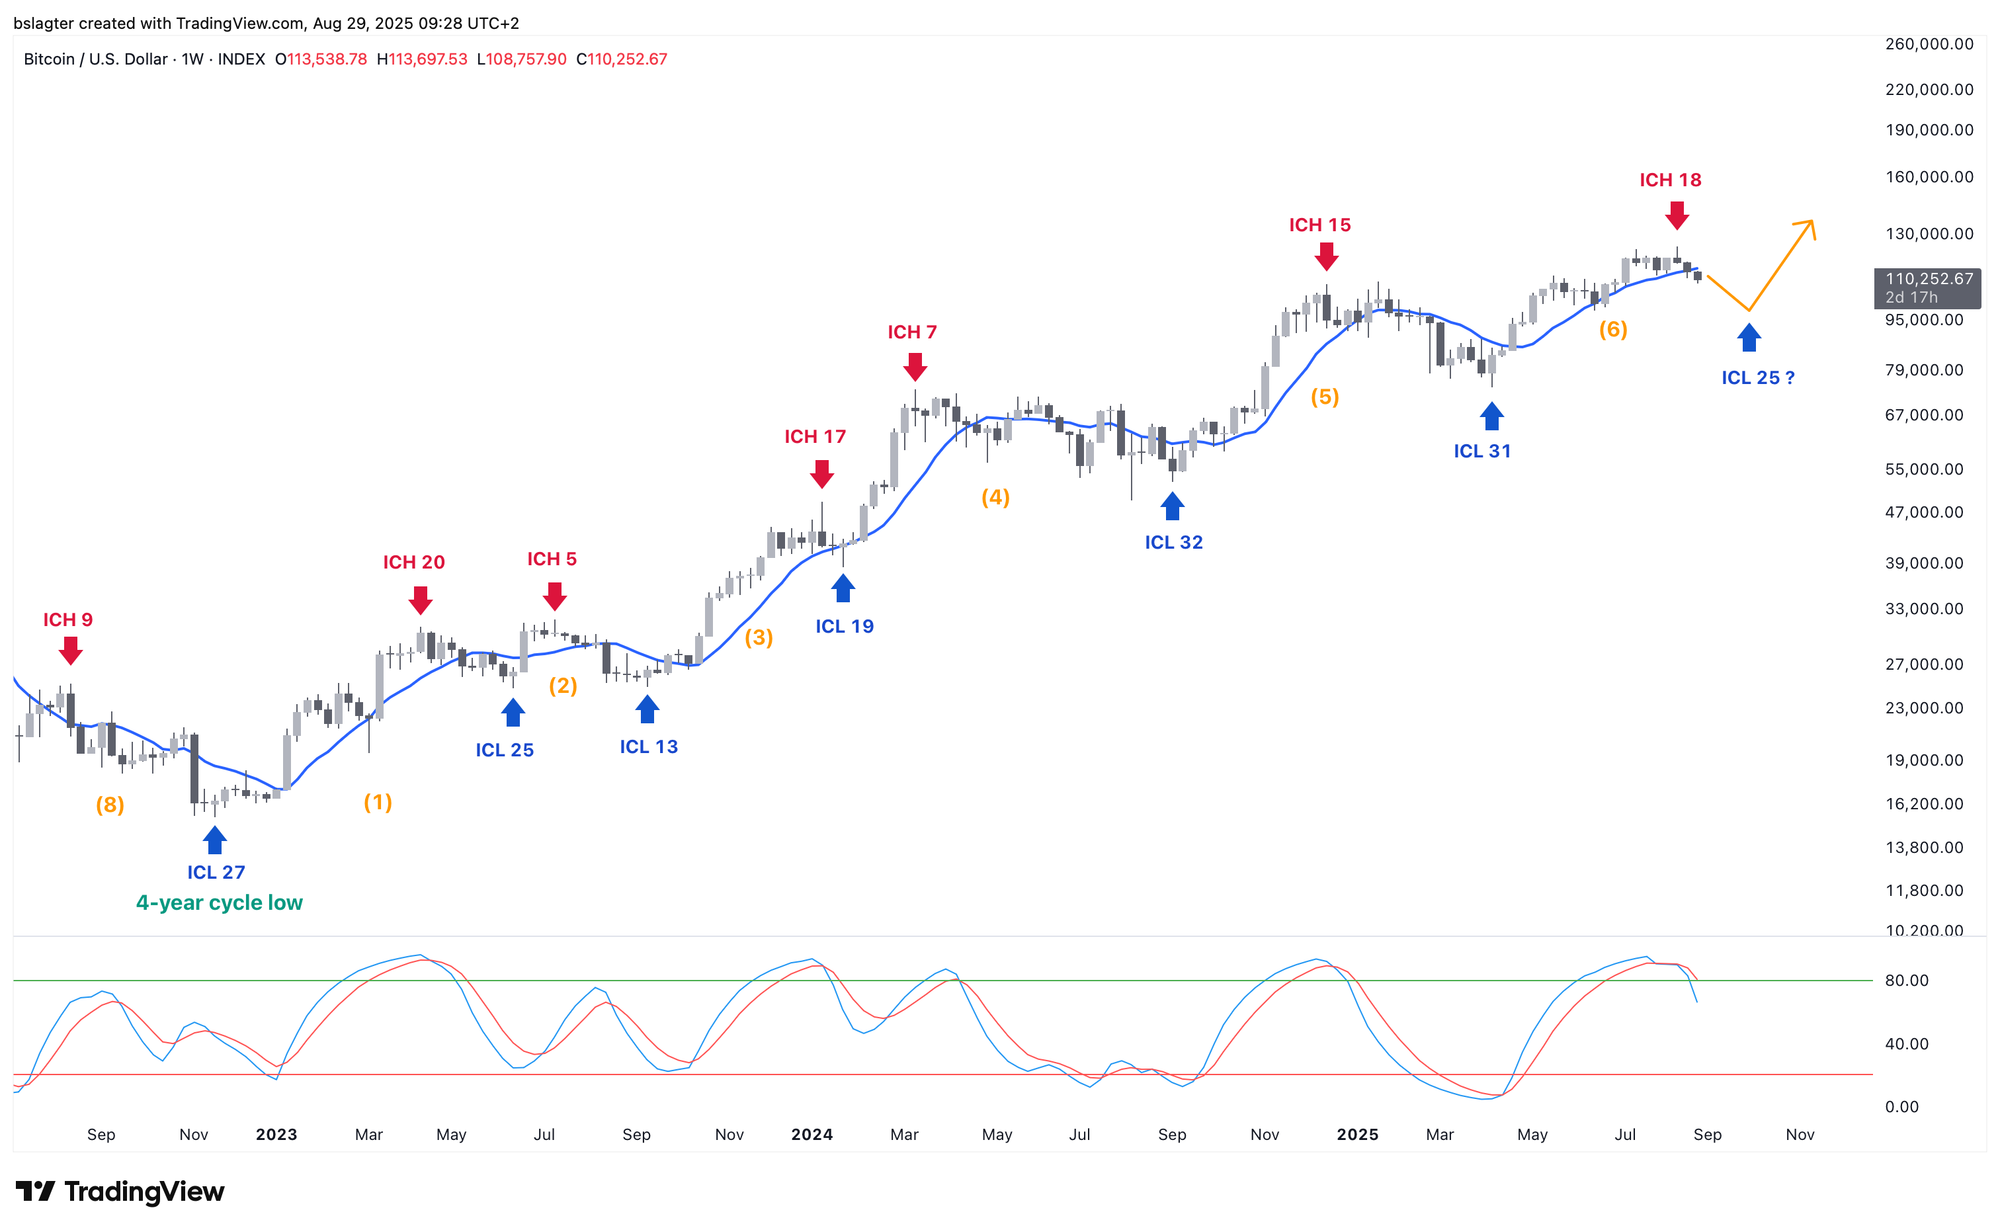
There are several indications that the $124,500 level on August 14 was the top of this weekly cycle. The chart below offers some insights from a cycle analysis perspective.
The price has dipped below the 10-week average, and we are already in week 18 of a roughly 26-week cycle. For more certainty, we’d need to wait for a weekly close, but the already declining oscillator leaves little doubt: We have entered the weak phase of the weekly cycle.
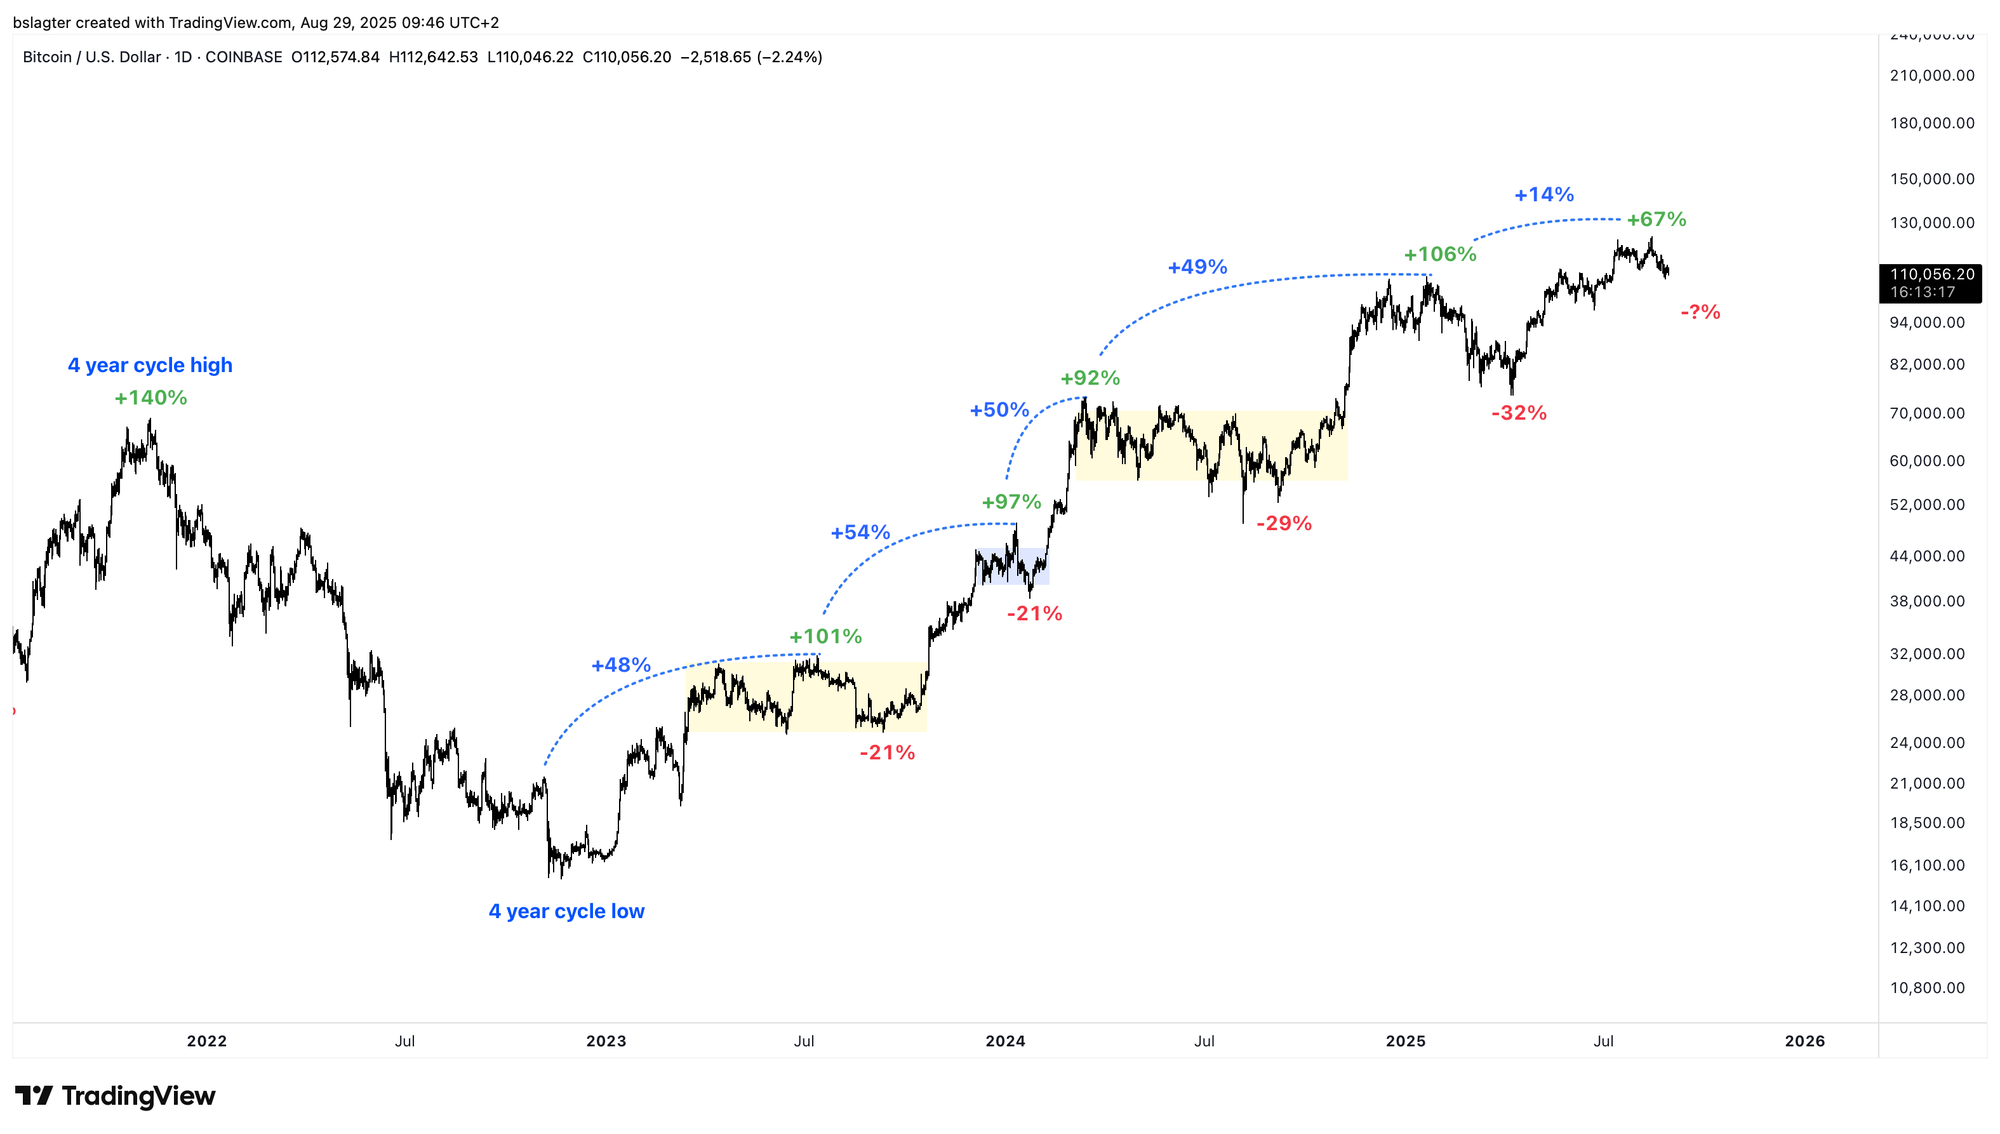
Toward the end of the weekly cycle, the market corrects. This can happen through a steep price drop – think of the -32% in April 2025 and the -34% in August 2024 – or as a time-based correction, where the price moves sideways for a while, what James Check often calls “chopsolidation.”
Other indicators aligning with this downward phase include the shift from an accumulation phase to distribution, low inflows into Bitcoin ETFs, and a generally gloomy, anxious sentiment. We’re seeing all of this now.
Another signal is that stocks continue to hit all-time highs, even as the crypto market retreats. This suggests a weakness inherent to the crypto market – not something imposed externally.
One possible explanation is that BTC is now suffering from old ETH holders. Imagine investors selling BTC to buy ETH in order to join the ether rally. They then become the “exit liquidity” for a large group of ETH holders who want to cash out near their all-time highs. As ETH’s price stalls, BTC’s price falls. Voilà – a widespread weakness in the crypto market.
But regardless of the reason, all the data suggest that this weekly cycle has peaked. That peak delivered a modest 67% rise from the bottom and a 14% gain over the all-time high – figures that, in previous cycles, were sometimes 100% and 50%, respectively.
Could the next weekly cycle be more favorable? Was this already the high of the bull market? When will we see the weekly cycle low and the start of the next cycle? We’ll discuss that shortly, after the break.
We continue with the following topics for our Alpha Plus members:
- Our new baseline scenario
- Massive cup & handle for SOL
- Is this the end of Bitcoin's bull market?
- Double positive surprise for the American economy
1️⃣ Our new baseline scenario
Bert
Last week in Markets, we discussed that it was time to update our baseline scenario. The scenario that would have taken the current weekly cycle to a target price between $150,000 and $165,000 by late August or early September became unrealistic after the sharp drop from $124,500 to below $112,000.
This week, we’ve made our decision. We’ve passed the top of this weekly cycle (ICH) and are now heading toward the bottom (ICL) and the start of a new weekly cycle.
Normally, you’d examine the daily cycle to determine where the weekly cycle might logically end. But lately, the daily cycle has been rather confusing. Cycle analysts can’t even agree on where the daily cycle lows (DCL) are – some point to the yellow dots, while others focus on the green ones.
We find the pattern below the most plausible, though we aren’t entirely sure. If it plays out as expected, you might reach the end of this daily cycle (and basically this weekly cycle) around October 2.
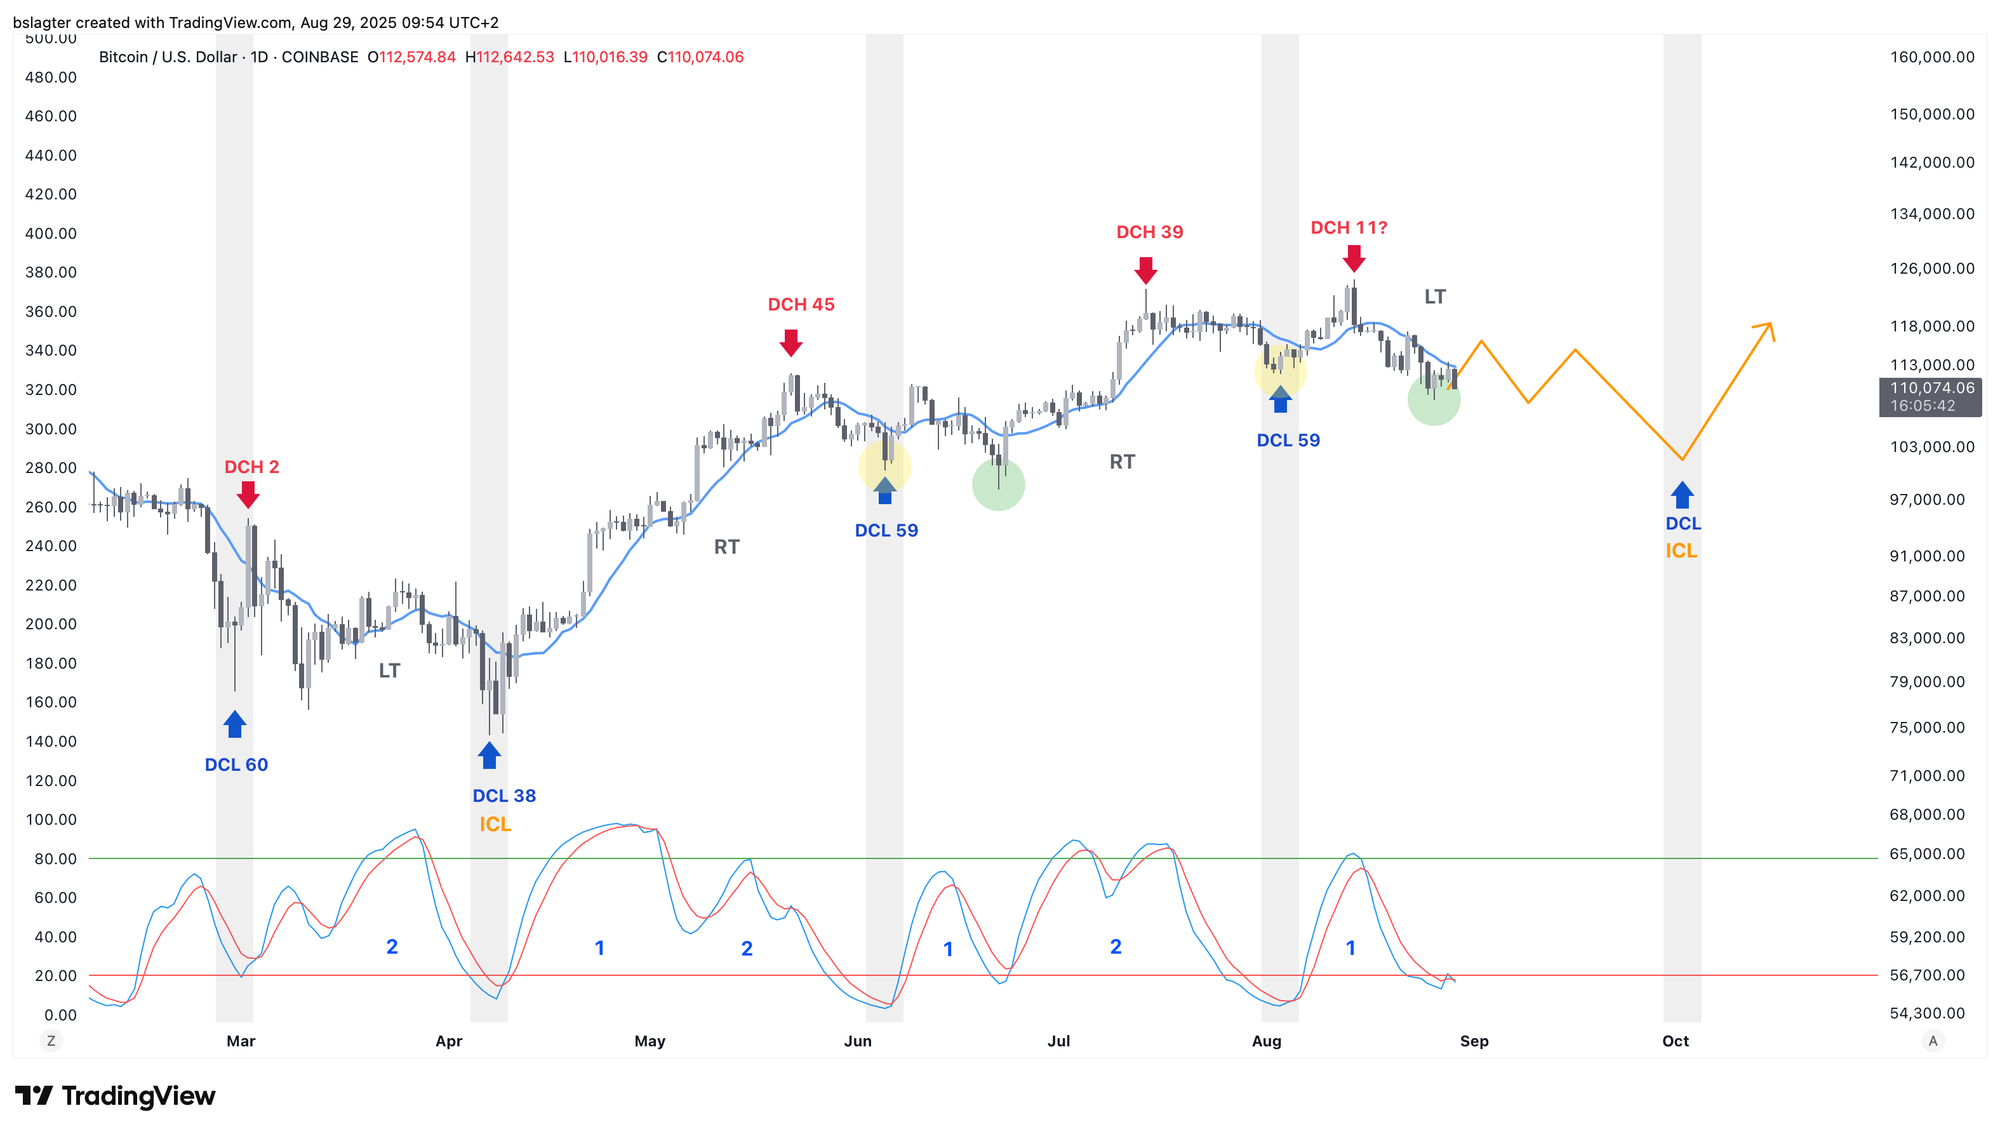
However, there’s also a case for an early weekly cycle low (ICL). In that scenario, the downward phase would be so short that the oscillator might not even have enough time to fully bottom out.
Previously, we highlighted in yellow how this occurred – back at the start of 2024, immediately after the launch of the spot Bitcoin ETFs.
Then, the ICL occurred two weeks after the ICH. If that pattern repeats, it could happen as soon as this week. Should that prove true, we might see prices top $200,000 in October. It’s very optimistic, but theoretically possible.
We tend to expect a slightly earlier ICL, although our reasoning isn’t set in stone. Objectively speaking, we’ll have to wait and watch for signs of a new daily and weekly cycle beginning – such as a daily close above the 10-day average, a weekly close above the 10-week average, rising oscillators, and a shift toward optimism.
Then, the seventh weekly cycle of this bull market would begin, and we believe it will trend upward – meaning that the $124,500 top was not the ultimate high of this bull market.
Due to the steady climb over the past eight months and the lack of major hype, there isn’t a large reservoir of unrealized gains. The MVRV stands at a modest 2.1, which is understandable after a period focused on “taking profits around 100k.” At the peaks of 2017 and 2021, the MVRV ranged between 4 and 5.
The moment everyone rushes to lock in profits can signal the start of a bear market. That was the case in 2017. In 2021, macroeconomic headwinds first pushed prices down, followed by the collapse of crypto companies.
Now, we see neither a huge reservoir of unrealized gains nor significant macroeconomic headwinds. In fact, conditions for risk investments appear more favorable in Q4.
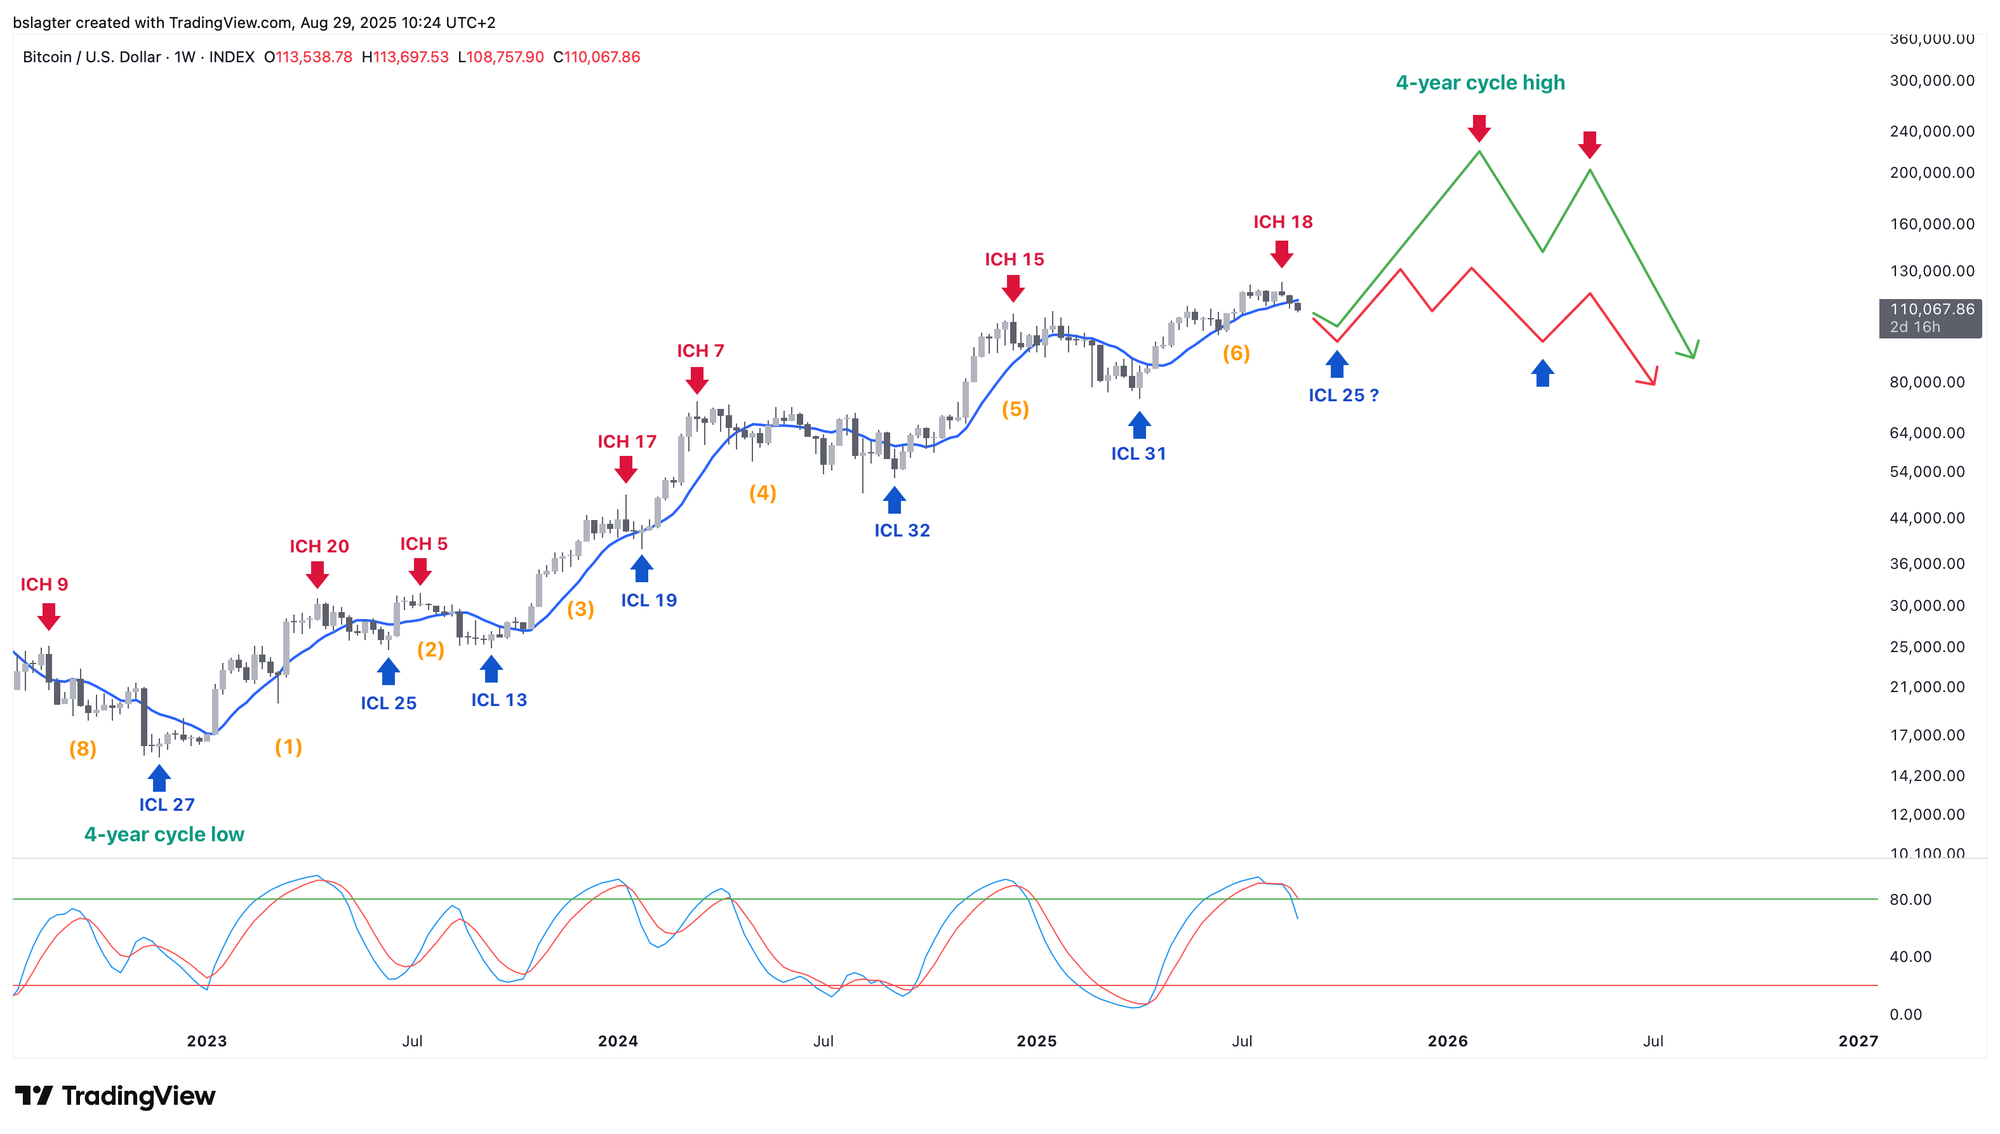
If we experience a typical weekly cycle this time – roughly doubling from the bottom – that could bring us to somewhere between $180,000 and $220,000, depending on where the ICL is set.
The alternative is that the peaks just below $125,000 in July and August are part of a larger distribution pattern. In that scenario, we might see a modest further rise in Q4, only to plunge quickly into a bear market afterward. This isn’t our baseline scenario, but we have illustrated it as an alternative in the chart below.
In summary, our baseline scenario is that the $124,500 level on August 14 was the ICH, and we are now headed toward an ICL sometime in the next six weeks. We expect the next weekly cycle to trend upward – finally leaving the battle for 100k behind.
2️⃣ Massive cup & handle for SOL
Bert
For the past few months, ETH has taken center stage with impressive price moves, ETF inflows, and treasury vault activity. In recent weeks, however, SOL has started to make its mark.
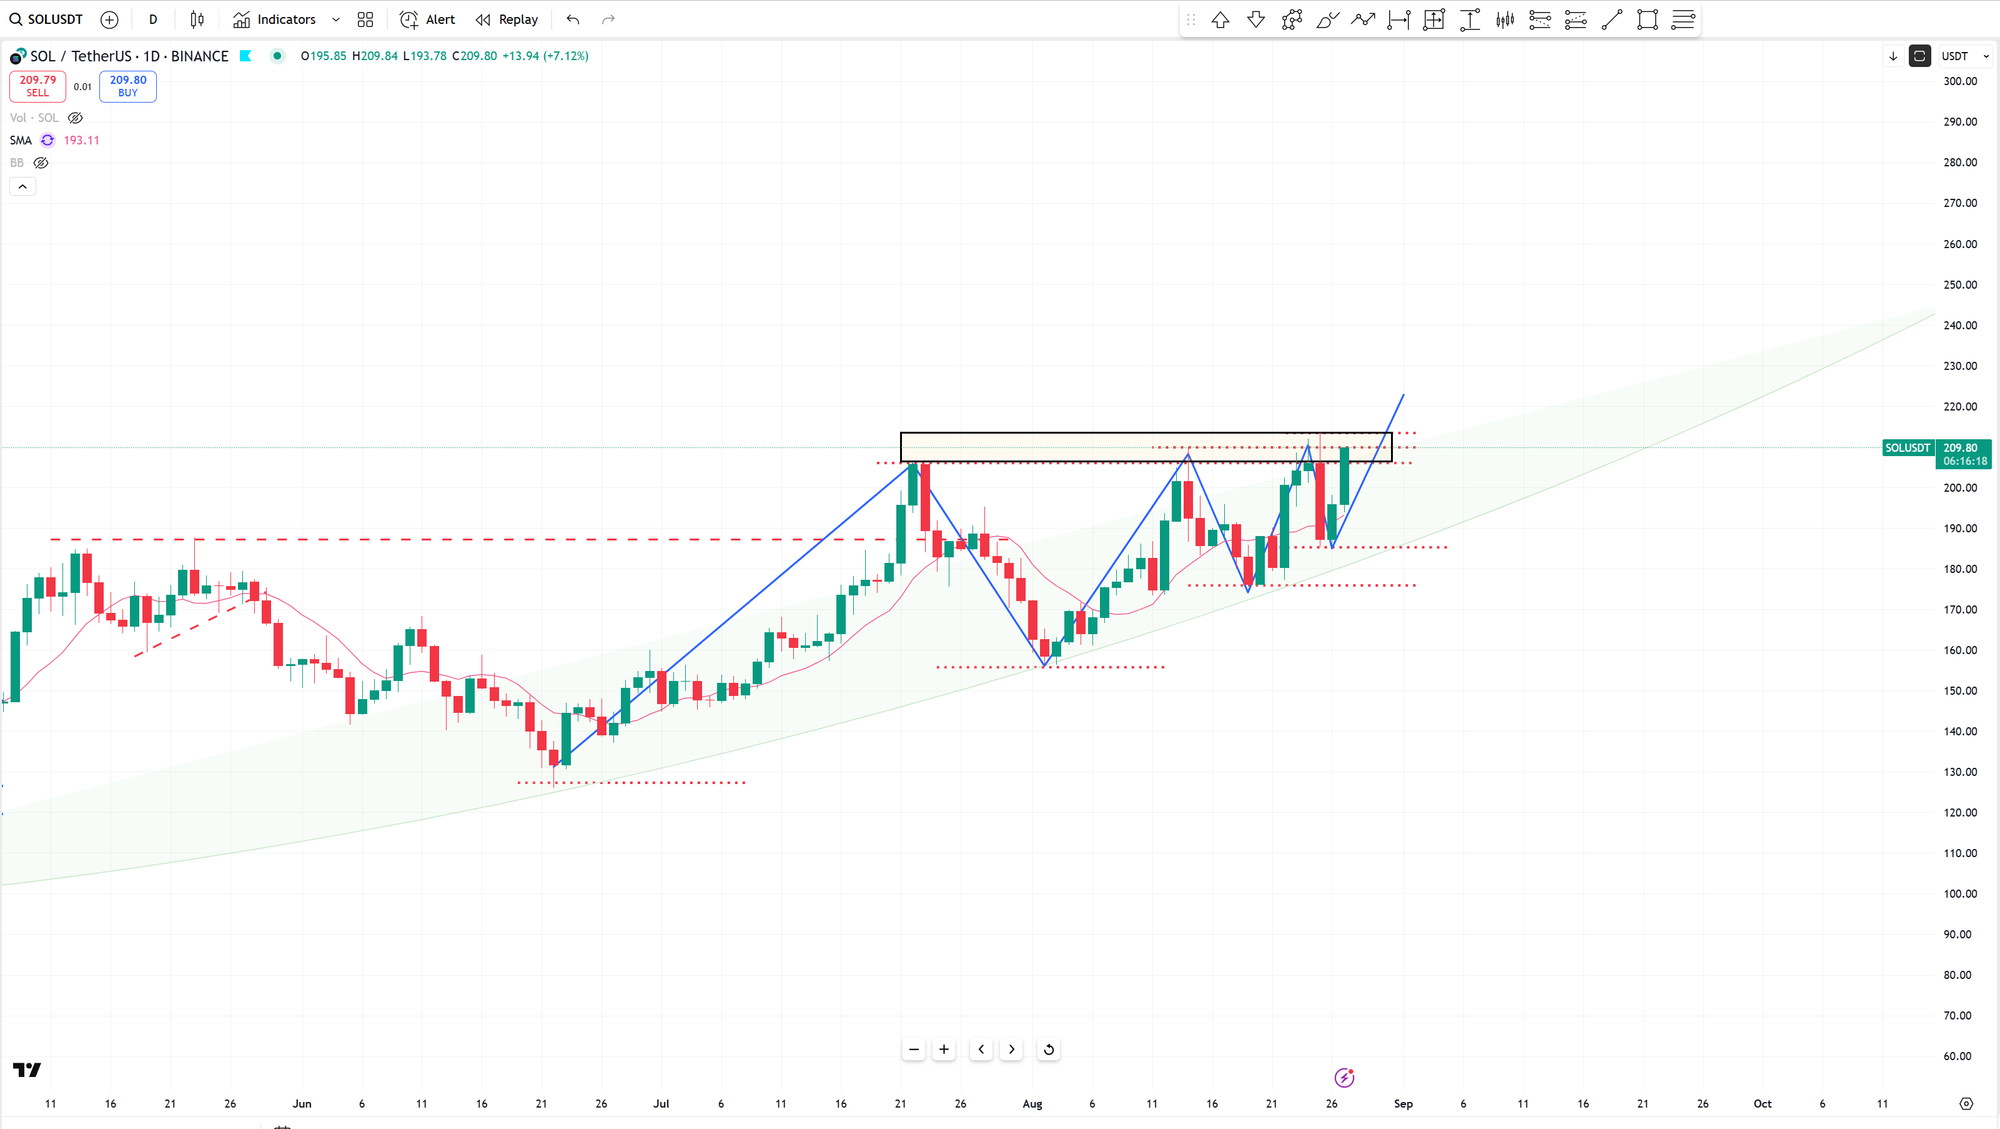
The chart shows a potential cup & handle pattern. A breakout above the neckline at $270 or the all-time high of $295 would confirm the pattern. Peter Brandt has already taken a position, commenting, “I am re-deploying this bucket into SOL, which I believe is forming a massive Cup and Handle.”
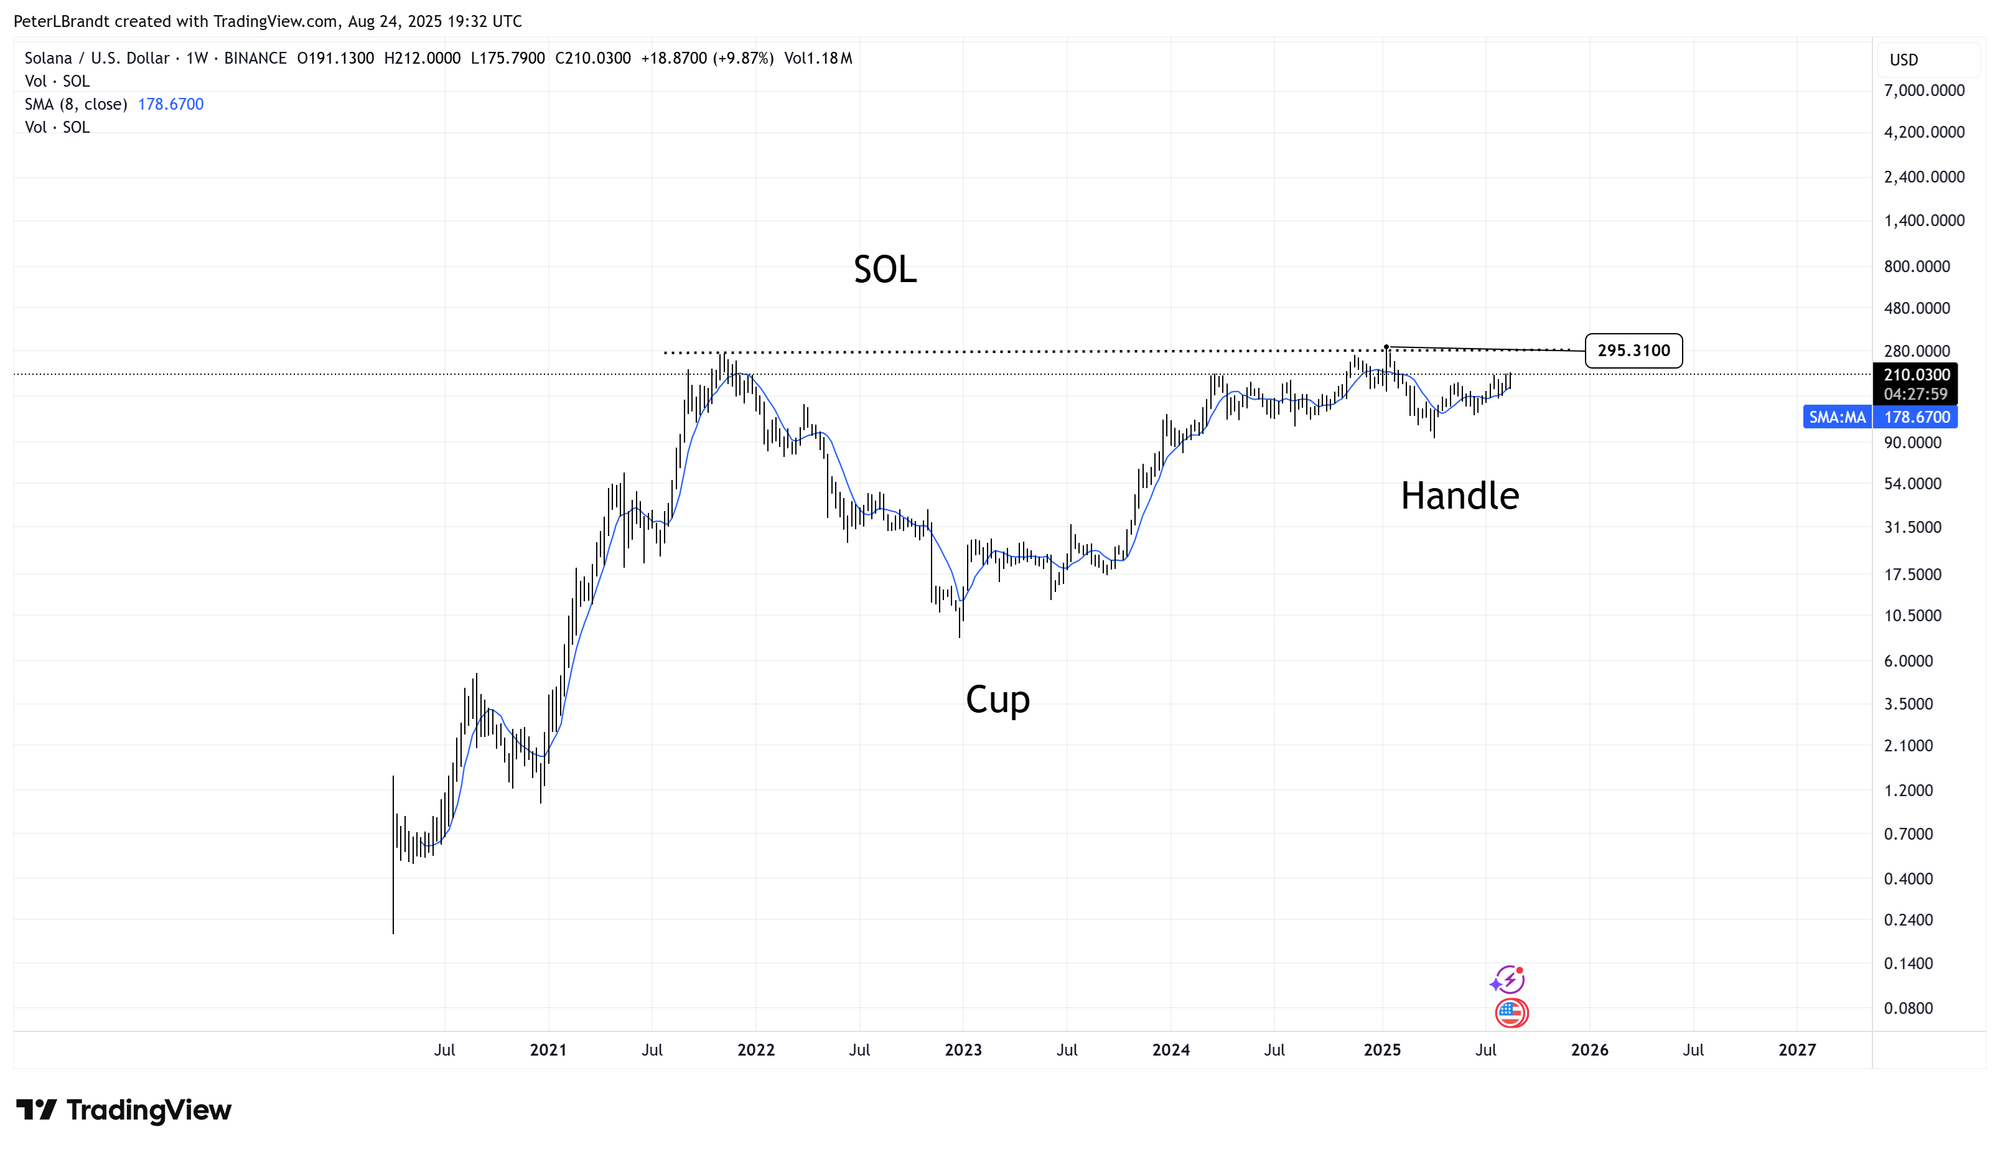
His strategy is clear: “My plan is to enter SOL if it can complete a wedge on the daily chart.” Bob Loukas also discusses this on X. He shares the chart below and remarks, “Looks like it wants to send.”
A potential challenge is that Bitcoin is still in search of a weekly cycle low. It takes significant strength for an altcoin to move strongly against that trend. While altcoins might rise as Bitcoin undergoes a period of sideways consolidation, it’s wise to be cautious with altcoin positions.
3️⃣ Is this the end of Bitcoin's bull market?
Thom
Whenever Bitcoin experiences a significant drop from a recent all-time high, uncertainty sets in: Is this the end of the bull market? Should I sell now to lock in profits?
While the answer to the latter depends on your personal situation, I expect the bull market is not over yet.
Since Jerome Powell’s speech at Jackson Hole – the Chairman of the US Federal Reserve – inflation expectations have risen. He noted that the risks of inflation and unemployment are roughly balanced, but that the central bank’s policy rate remains restrictive.
In simple terms, Powell suggested that interest rates should drop toward their neutral level because that better fits current conditions.
This approach makes Powell and the Fed appear to be erring, as economic data suggests that the risk of inflation outweighs the risk of a recession.
- Economic growth is around 2 percent. Read more
- Unemployment is historically low at 4.2 percent. Learn more
- Credit spreads are at their lowest point this century – this is the extra yield companies pay over US Treasuries. The smaller the spread, the more confidence lenders have in the economy’s future, indicating they’re hardly worried about defaults.
- The financial markets have recently hit all-time highs.
Combine this with Donald Trump’s efforts to stimulate the US economy while pushing for lower Fed rates, and it’s hard to argue that a recession is more likely than another wave of inflation.
From this perspective, it’s unsurprising to see short-term interest rates (0 to 2 years) falling while long-term rates rise. The Fed mainly influences short-term rates with its policies, leaving long-term rates largely to market forces.
As long as the Fed continues on this path – effectively aligning with Trump – the US economy and global liquidity will be boosted. In turn, this environment of abundant capital will inevitably channel some funds into Bitcoin.
For that reason, a continuation of the bull market remains my primary scenario – until the Fed changes course, likely if inflation poses a greater threat than the economy. An explosive rise in long-term rates could, however, halt the bull market.
For now, neither scenario seems imminent, and I continue to bet on a new phase of rising Bitcoin prices.
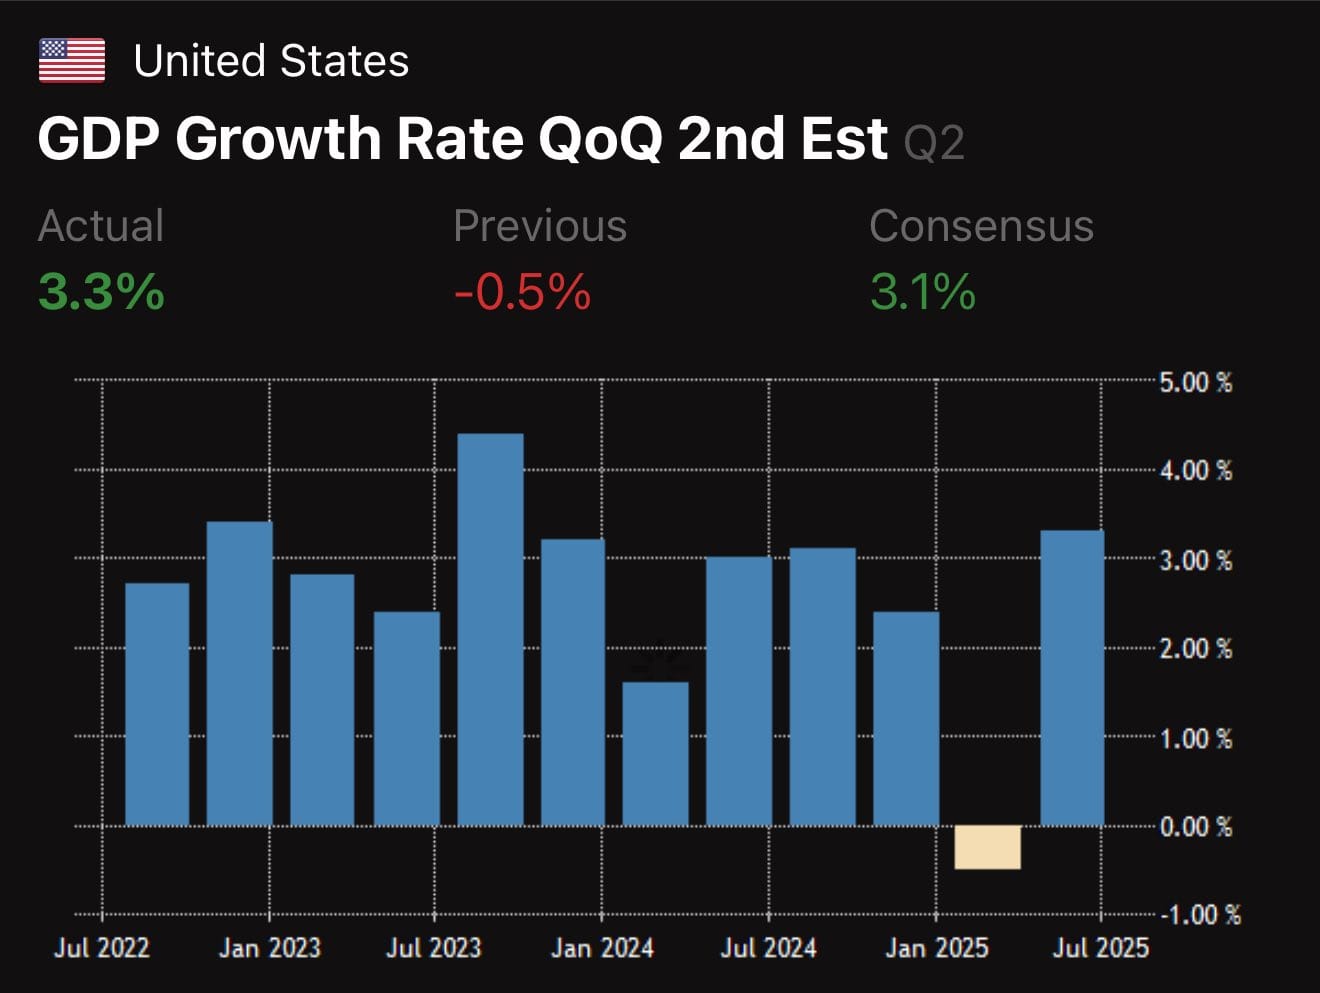
4️⃣ Double positive surprise for the American economy
Thom
This week, economic data again confirmed that the US central bank doesn’t need to cut rates. Real consumer spending came in higher than expected, and Q2 economic growth also surpassed forecasts.
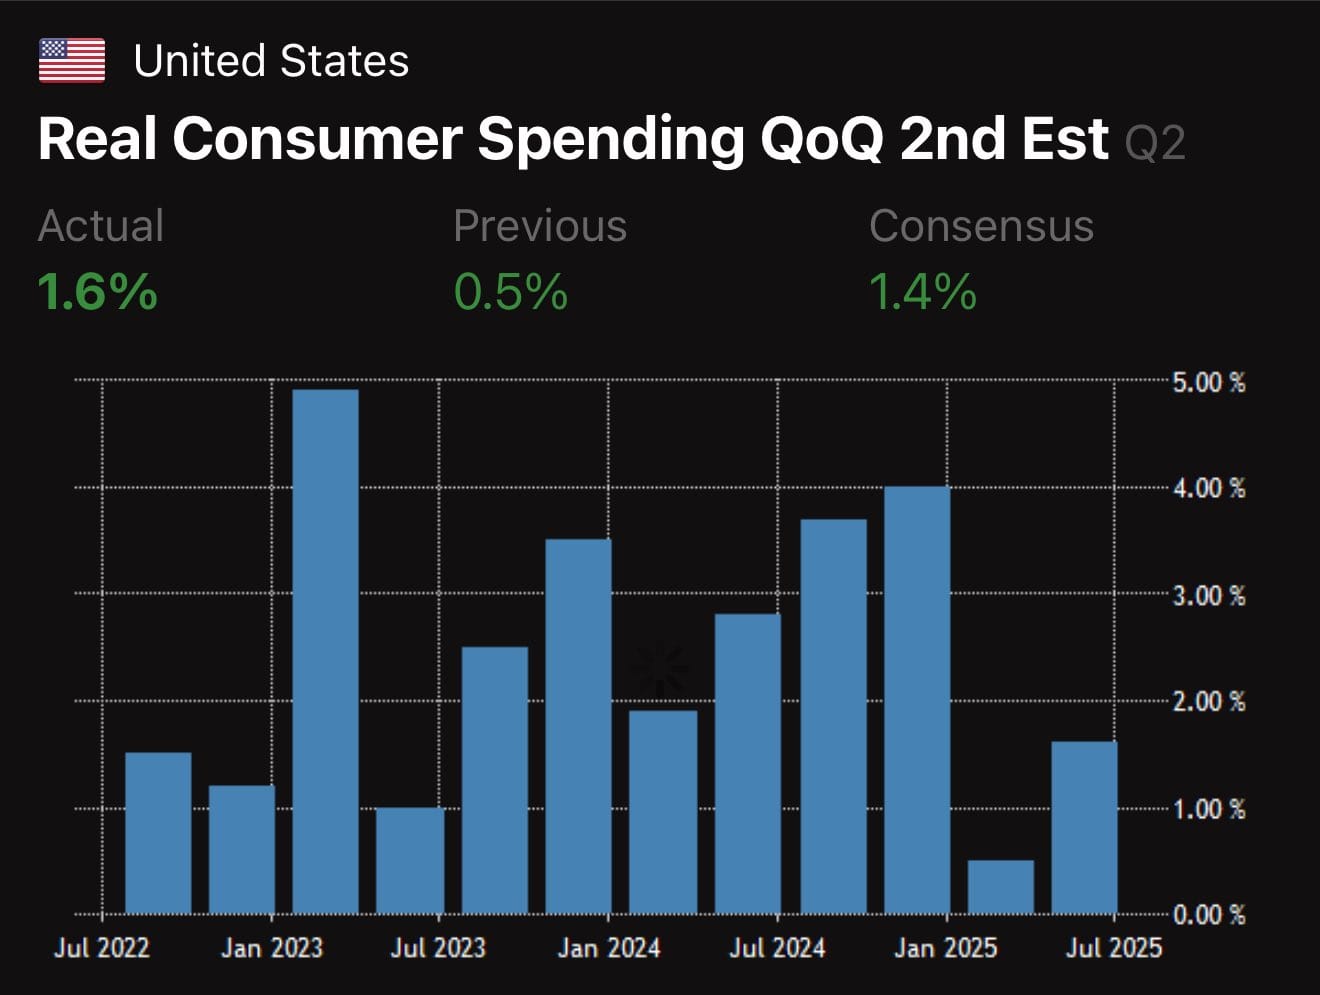
The US economy went through a period of uncertainty during Donald Trump’s tariff war, but now it appears to be accelerating – not surprising with a president fully committed to boosting growth.
You never have certainty in finance, but the odds of Bitcoin’s bull market ending soon due to a recession seem slim at the moment.
It increasingly appears that the Fed will cut rates again, even in a strong economy. The same happened back in September 2024 when they implemented a significant 50-basis-point cut.
Soon after, it became clear that the economy didn’t actually need that cut, leading to a strong period for Bitcoin and the broader markets. Now, it seems the Fed might be repeating that mistake – but between now and September 17, we’ll see some important data.
I wouldn’t be surprised if they eventually conclude that the risk of another inflation surge is slightly higher than the risks to the labor market and overall economy, which would mean fewer rate cuts than the market currently expects.
Thank you for reading!
To stay informed about the latest market developments and insights, you can follow our team members on X:
- Bart Mol (@Bart_Mol)
- Peter Slagter (@pesla)
- Bert Slagter (@bslagter)
- Mike Lelieveld (@mlelieveld)
We appreciate your continued support and look forward to bringing you more comprehensive analysis in our next edition.
Until then!