A Bear Market by Time
Price still hovering around $90,000. For our preferred scenario—a "bear market by time"—a rally above $100k would be welcome.

Between October 6 and November 21, bitcoin's price dropped 36% from $126,000 to $80,500. This marks the deepest correction of this market cycle, which began at the bottom of $15,500 in November 2022.
The final two days of the decline were turbulent. The high trading volume and nearly $10 billion in realized losses in the on-chain data point to capitulation. Investors sold at a loss the bitcoin they had purchased only recently, undoubtedly expecting prices to continue rising.
Since November 21, seven weeks have now passed. The price has fluctuated between $85,000 and $94,000 while the market processed the crash. The damage is being assessed, especially by parties who got hit in the October 10 crash.
Investors are incorporating the new reality into their scenarios and strategy for the new year. Some are exiting after all. Others are actually increasing their positions. All this time, supply and demand have remained fairly balanced around a price of $88,000.
On Monday and Tuesday, bitcoin made its fourth attempt to break above $94,000. So far without success.
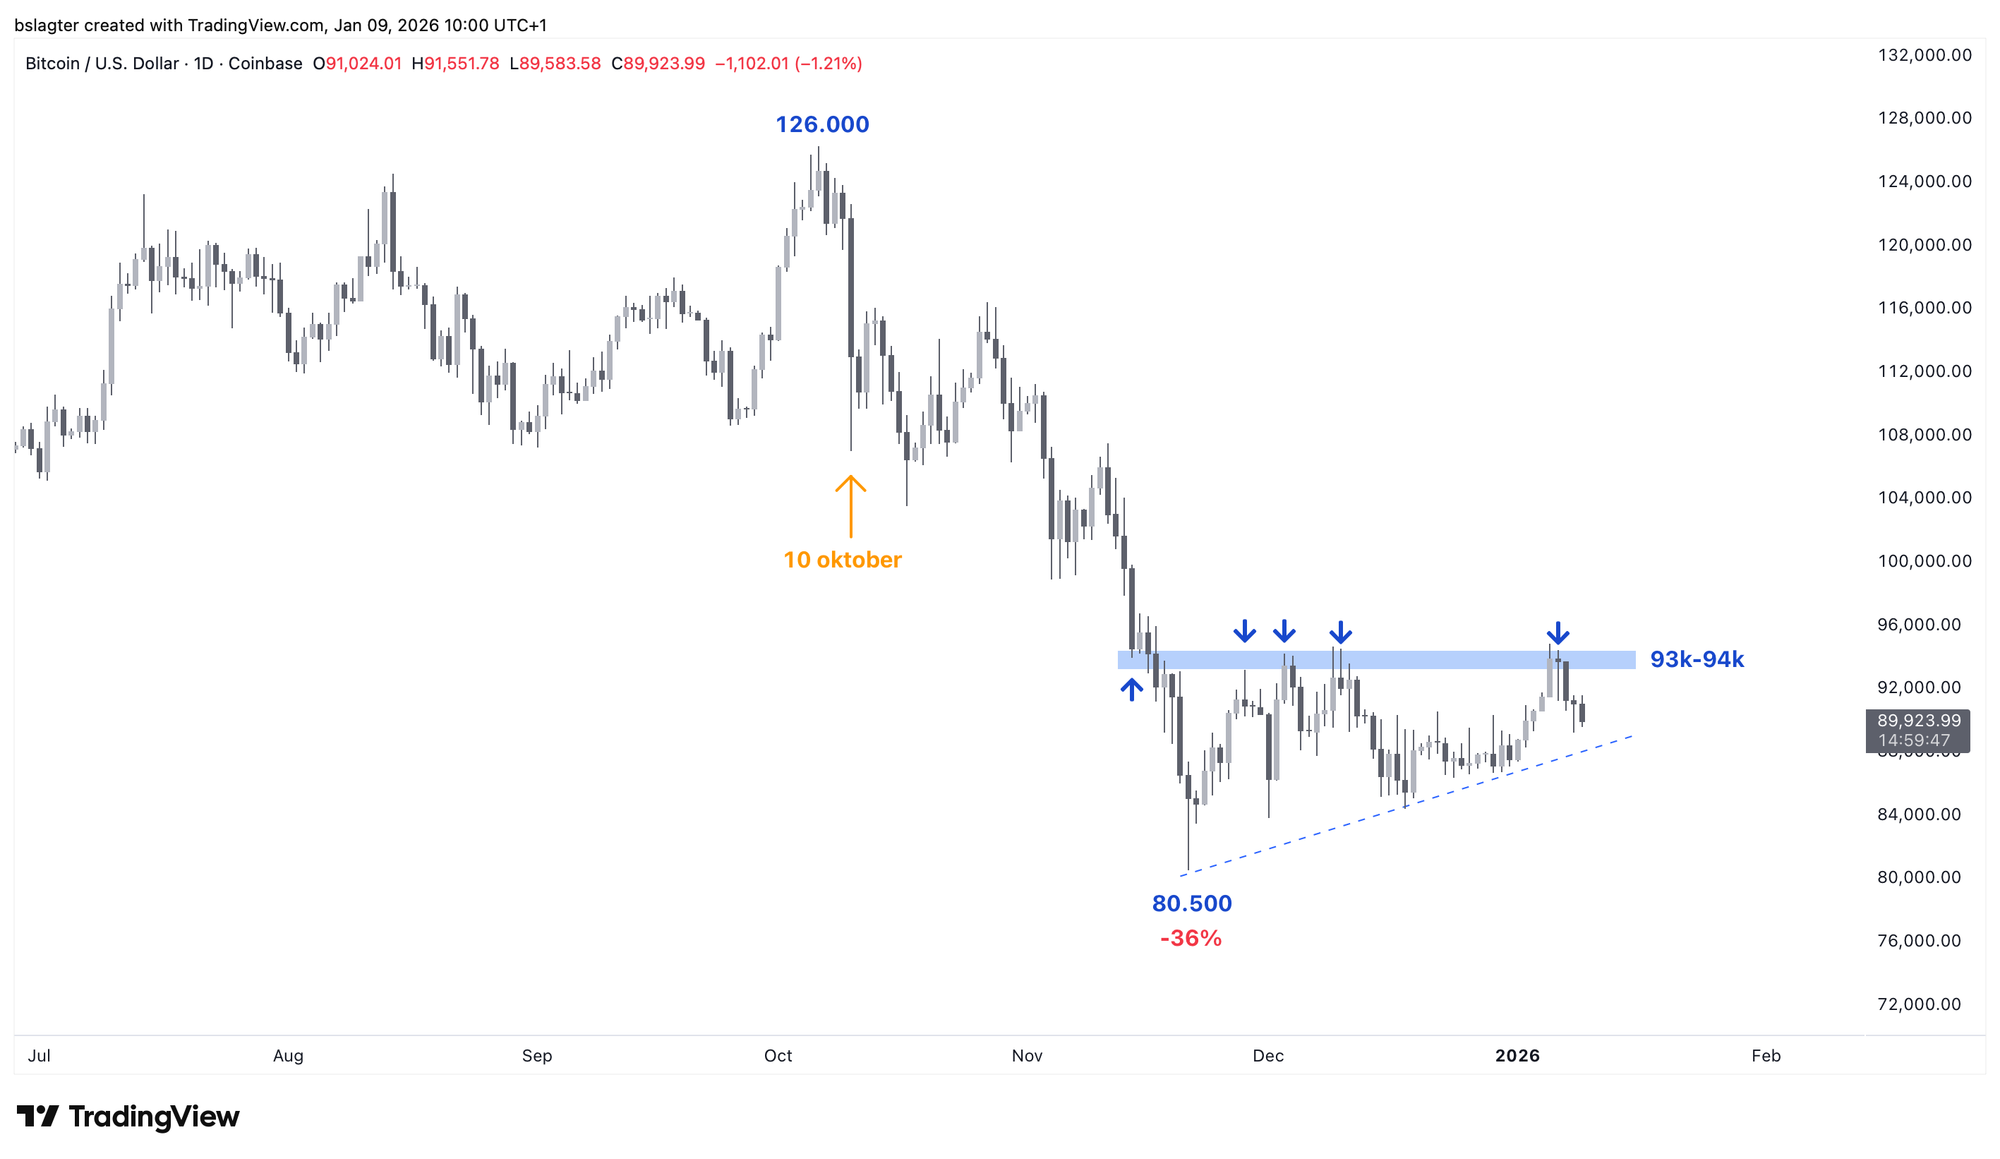
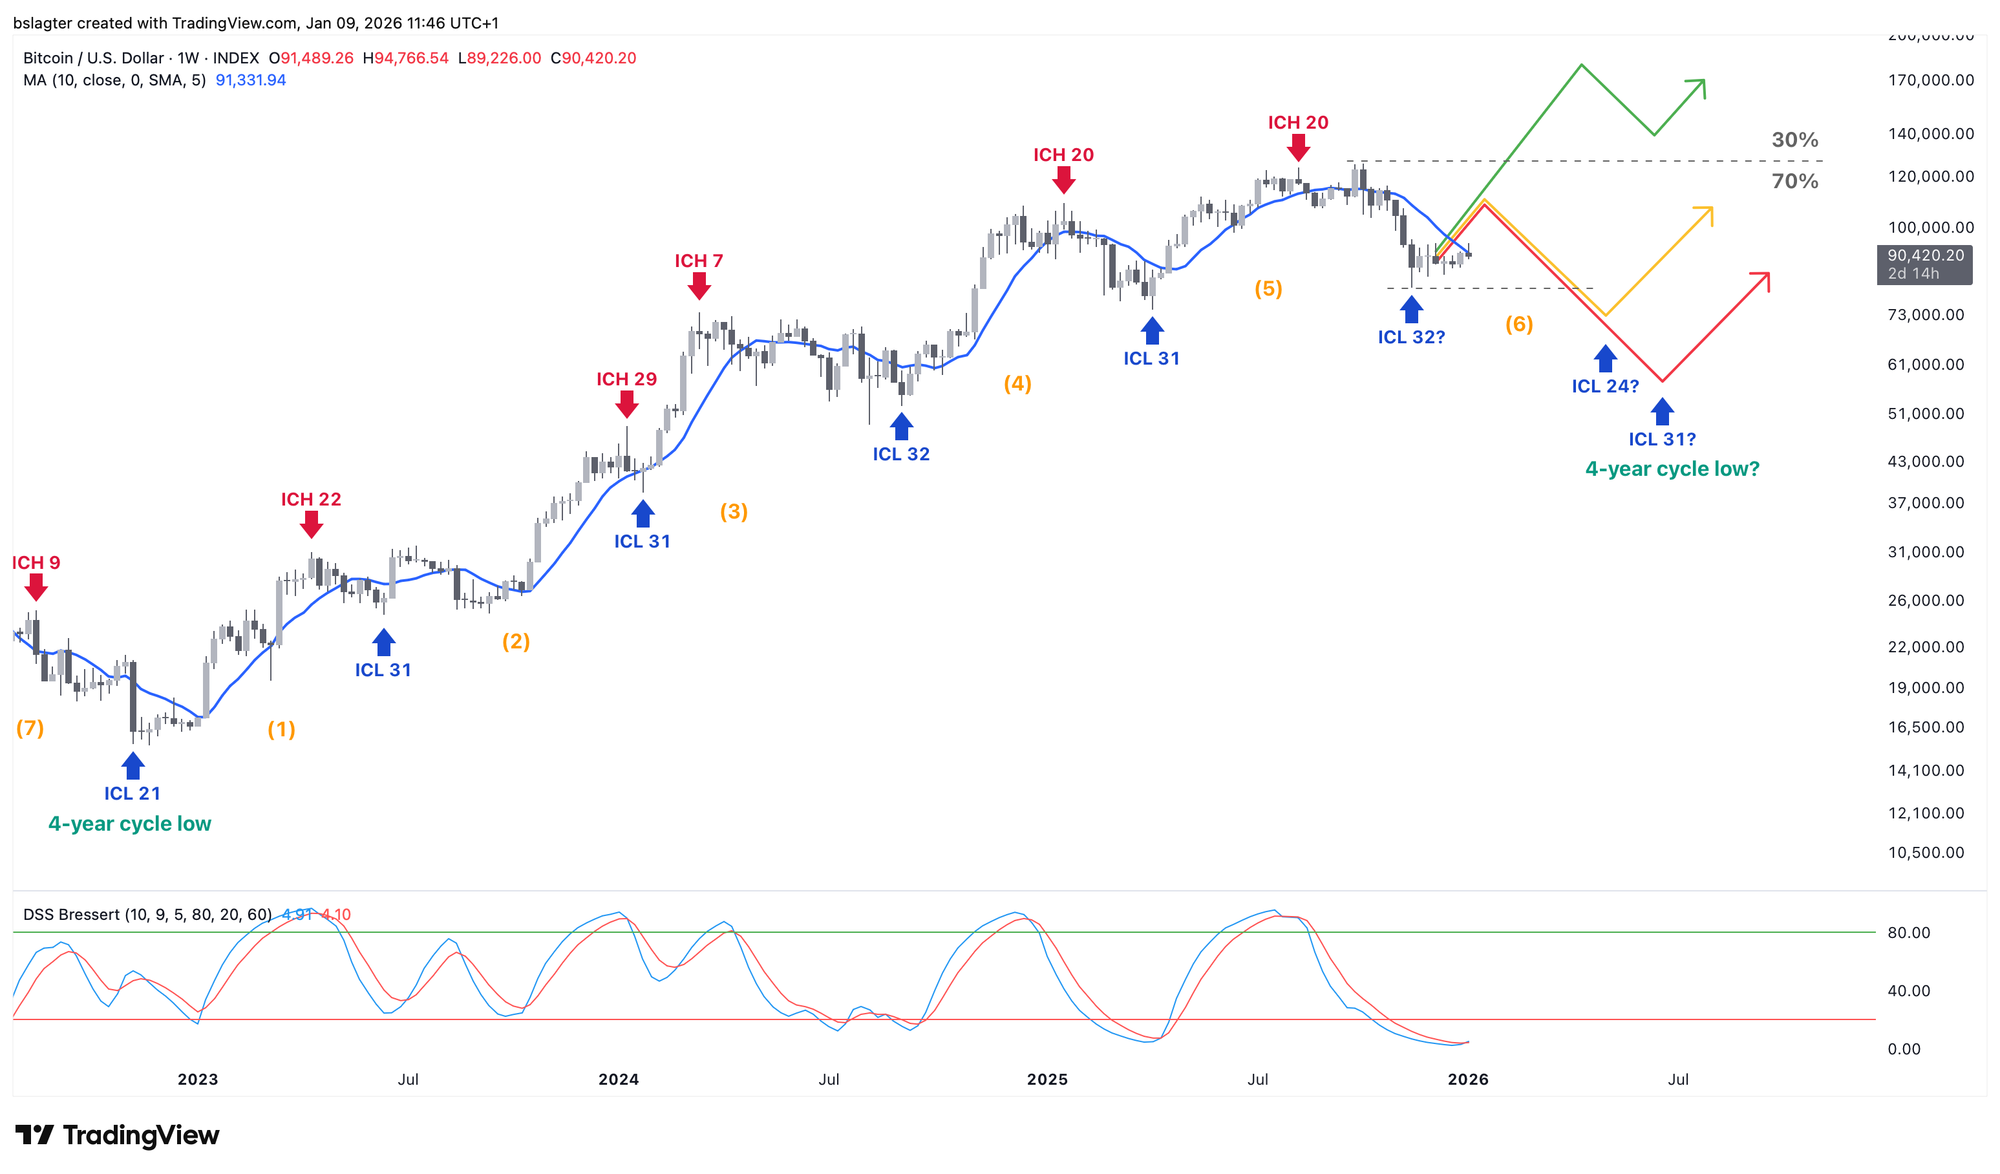
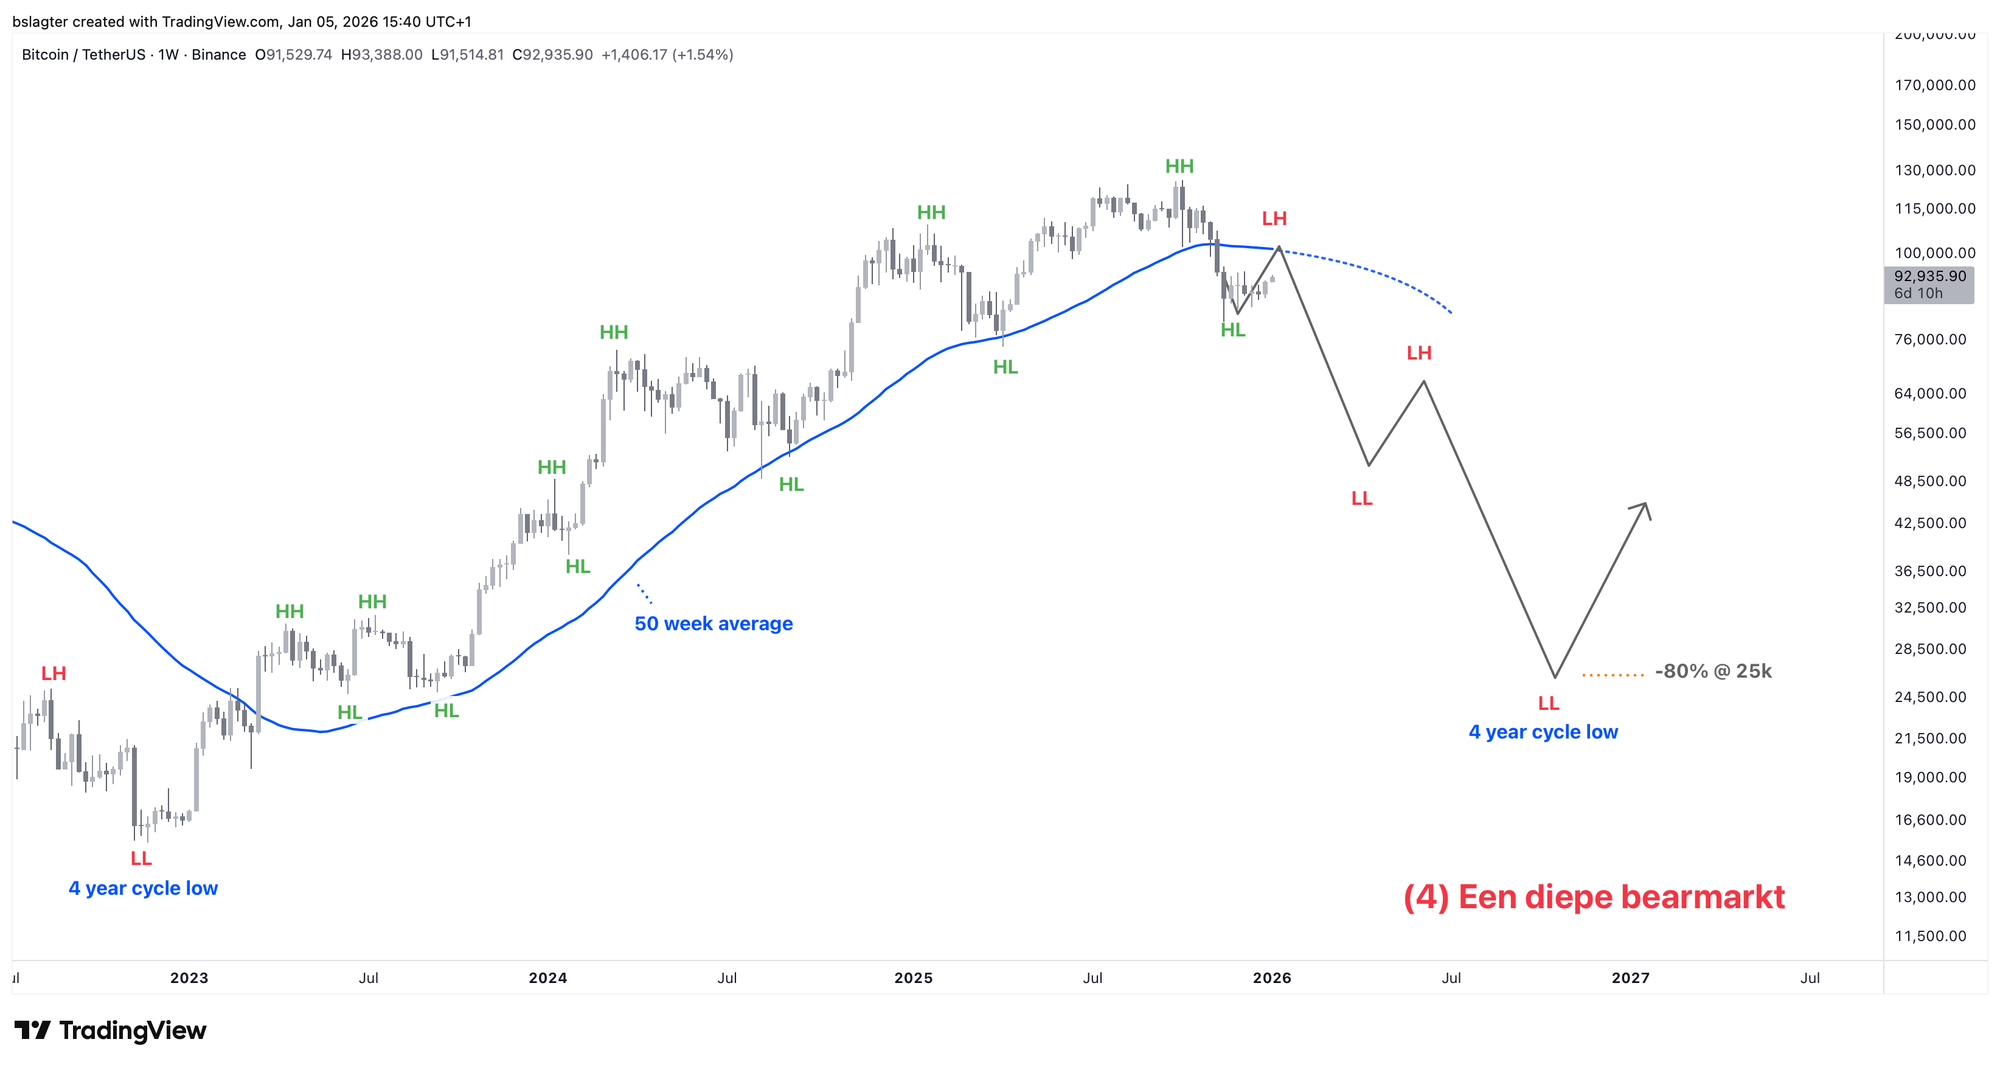
Still, we give the highest odds to an upside breakout. The weekly chart suggests that we'll eventually revisit both $74,000 and $100,000. But first up, then down. First a relief rally to a lower high (LH), and only then an extension of the downtrend to a lower low (LL).
During that rally, we should at least touch the $100,000 level. That's a structurally important price point, and it's also where the 50-week moving average runs—which accompanies the market cycle—along with the VWAP from the top.
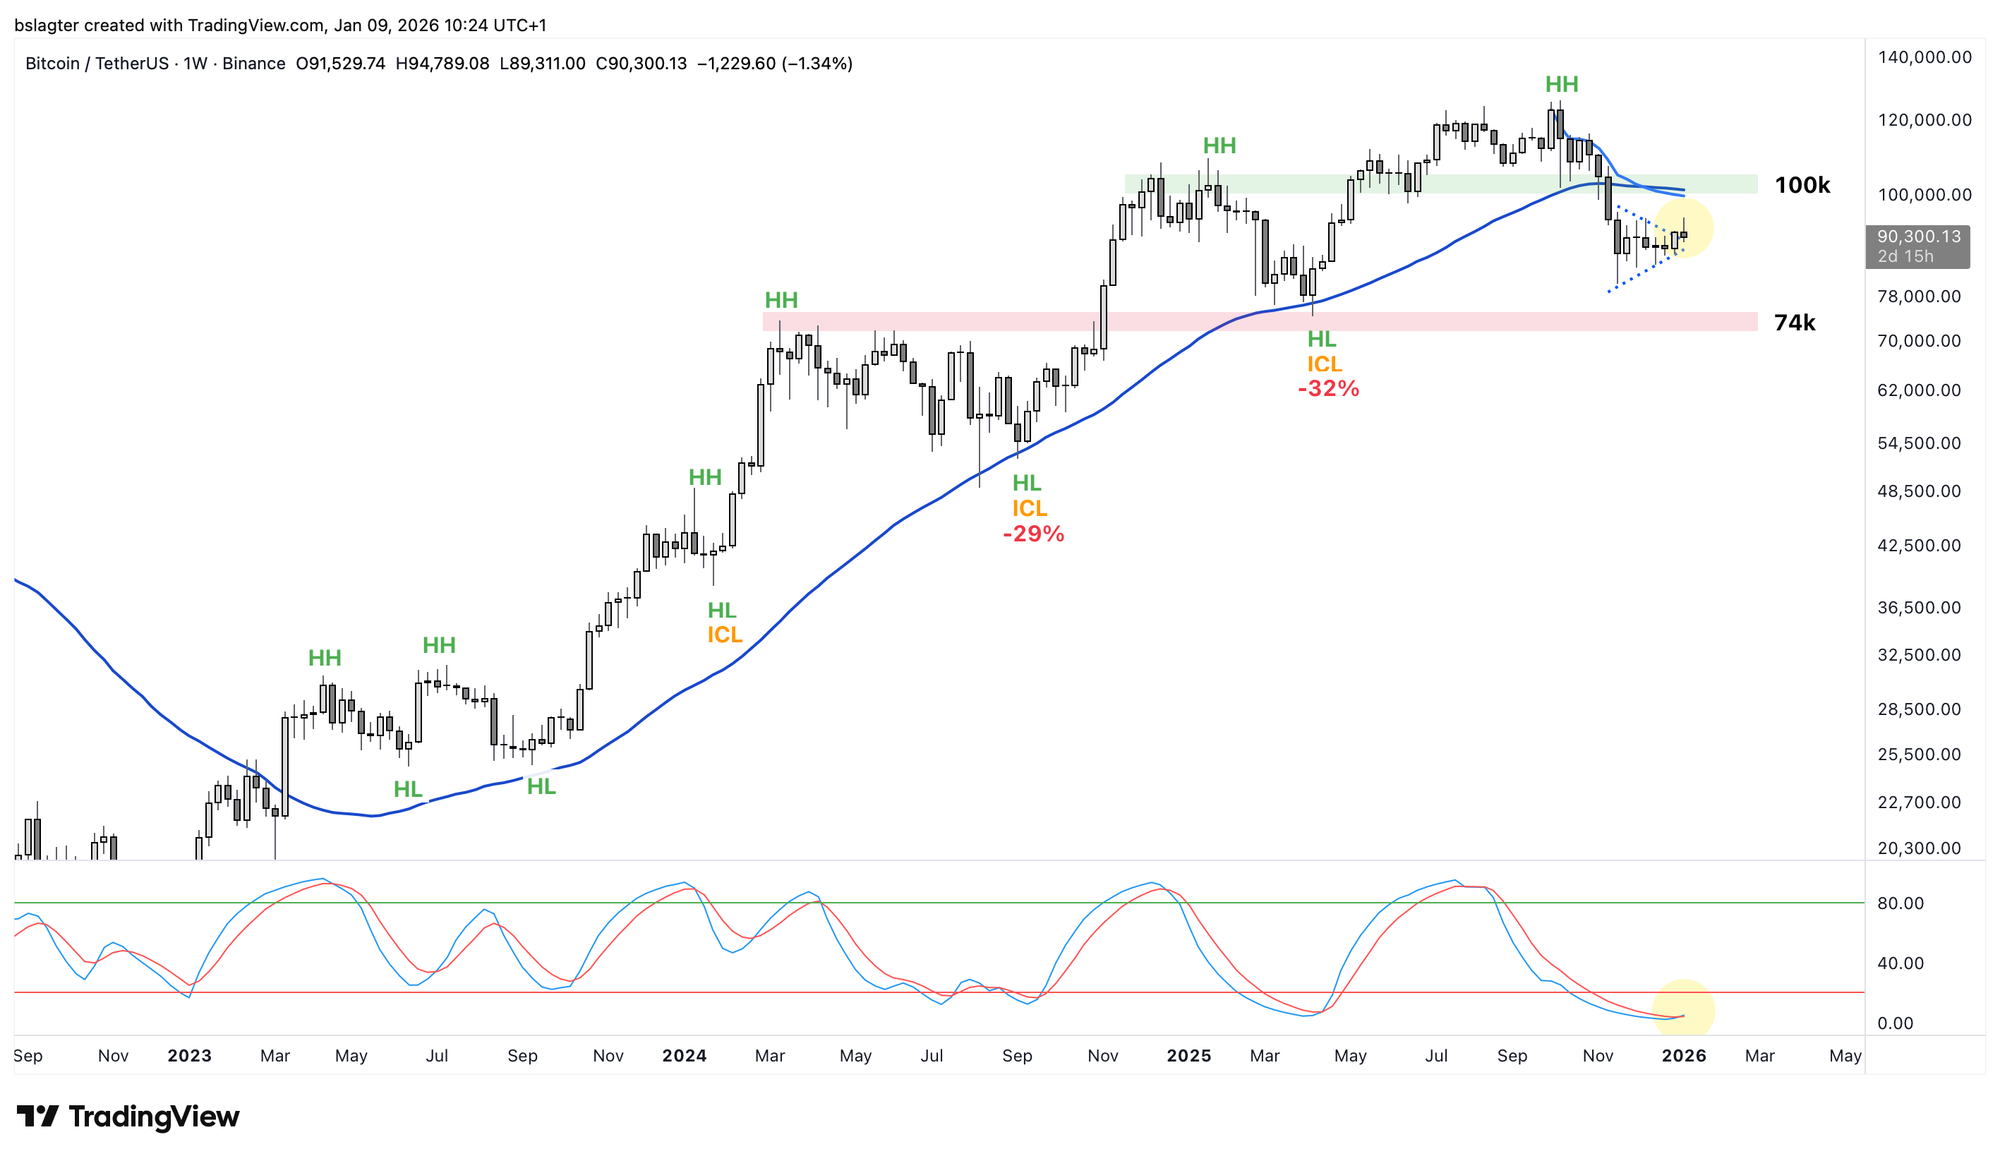
But we'd prefer to see an even higher top for this weekly cycle. This has to do with our favorite scenario: a "bear market by time."
We'll elaborate on this in the section for our Alpha Plus members, along with the following additional topics:
- A bear market by time
- An update on our four scenarios
- Bitcoin starts 2026 with a strong foundation
- Volatile first week of 2026
- Gold and silver due for a breather?
1️⃣ A bear market by time
Bert
There's a good chance we're at the start of a new weekly cycle, and that it will at least touch $100,000. But we'd prefer to see an even higher top for this weekly cycle, as we wrote above. This has to do with our favorite scenario: a "bear market by time."
To refresh your memory, these are the four scenarios we introduced in the Markets edition of November 14:
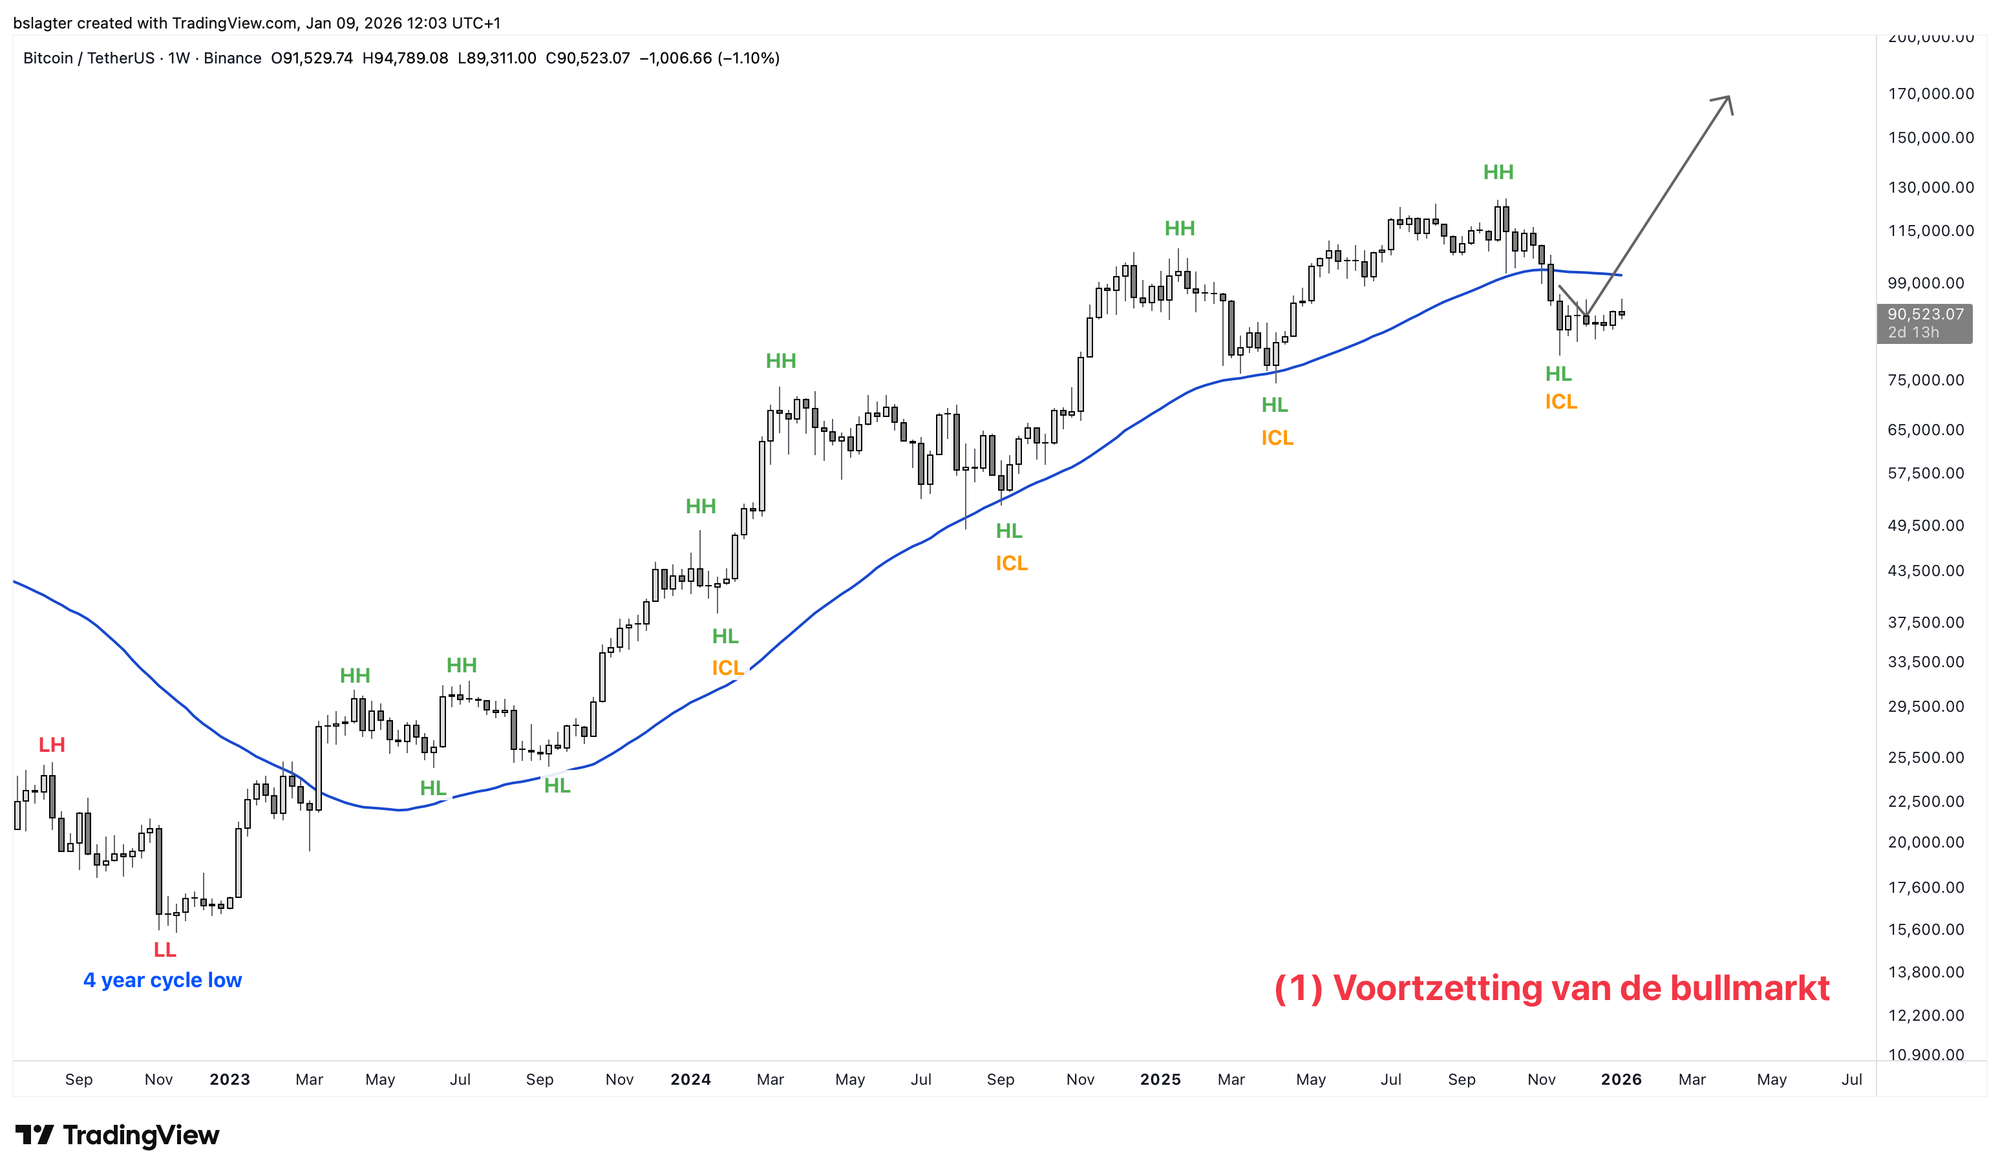
- Continuation of the bull market: 30%
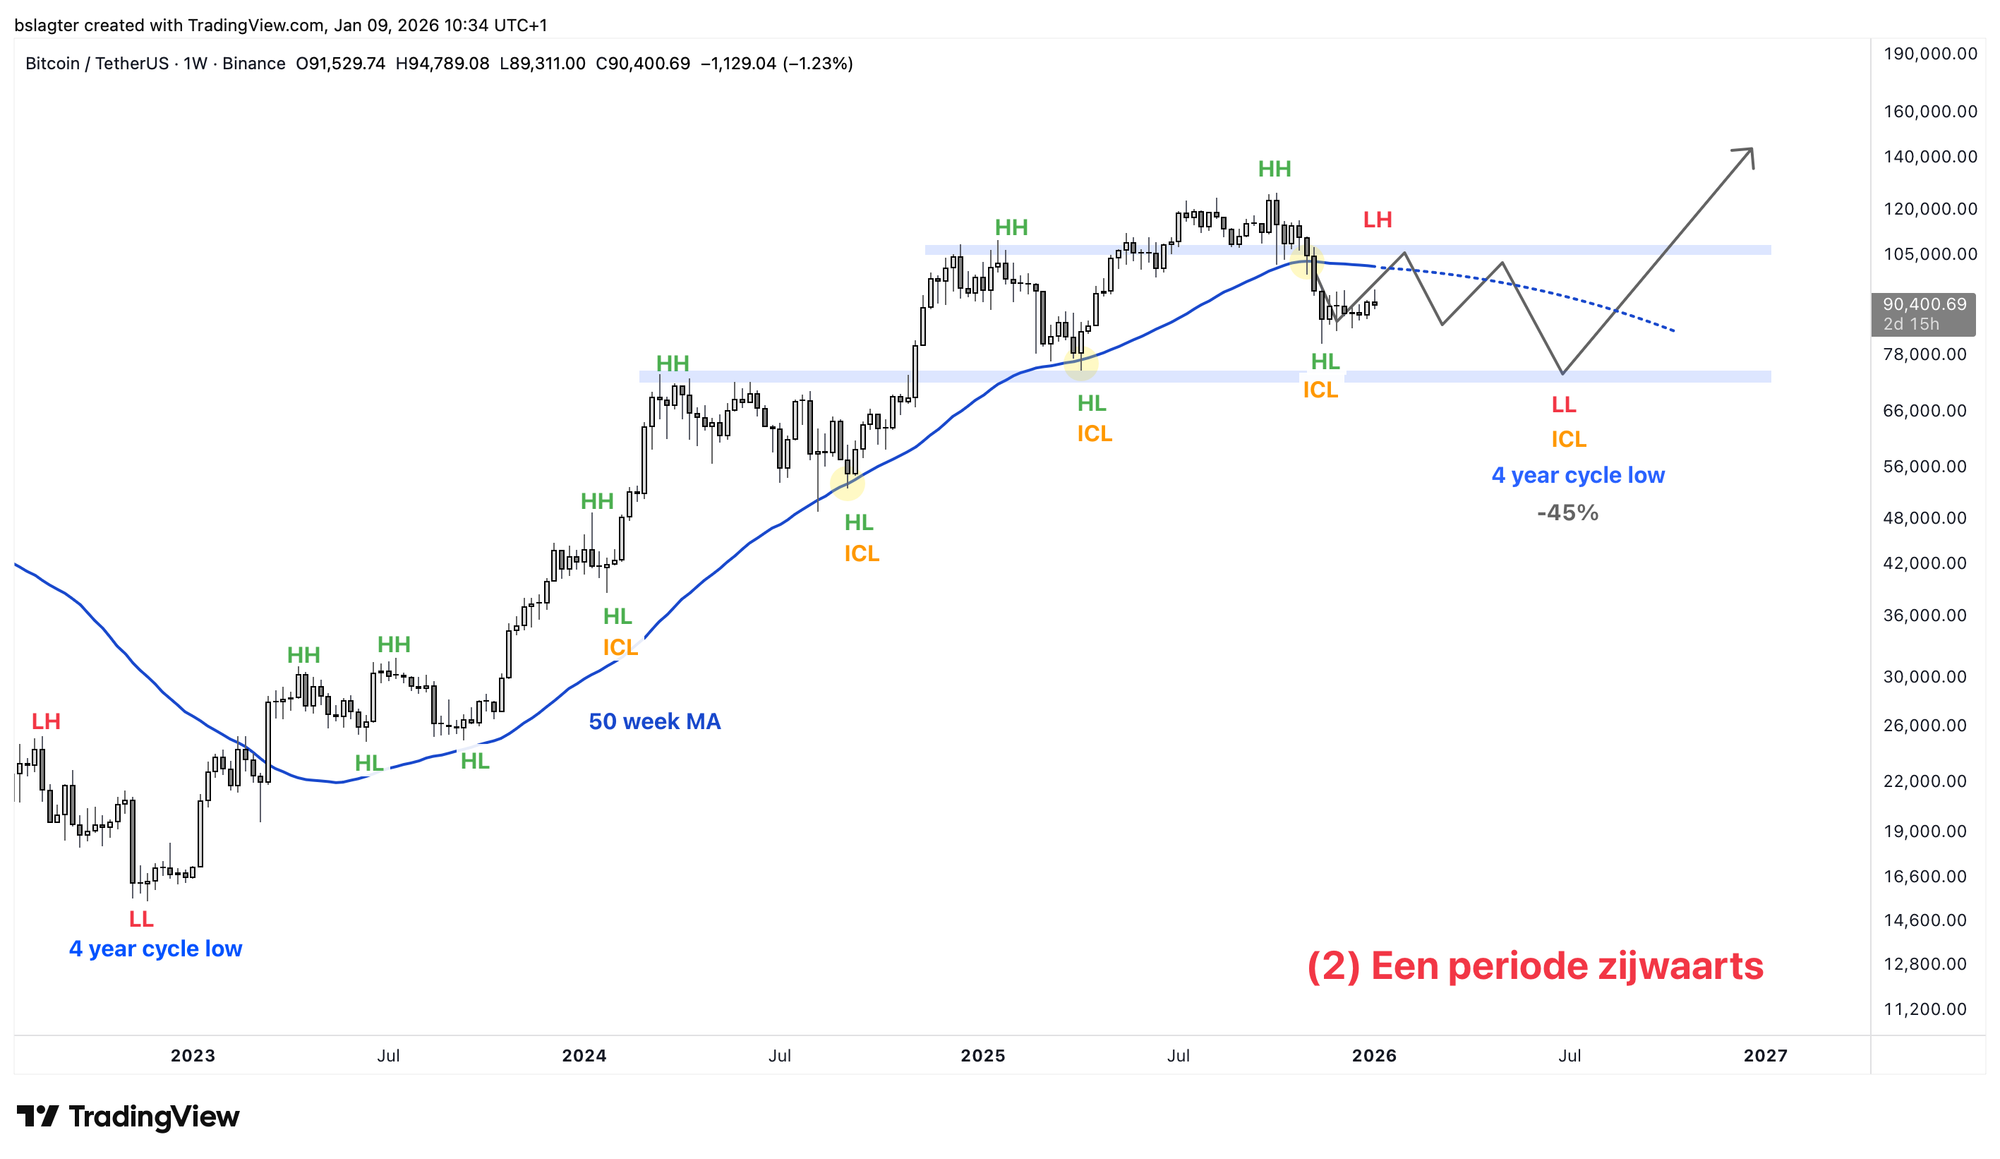
- A sideways period: 40%
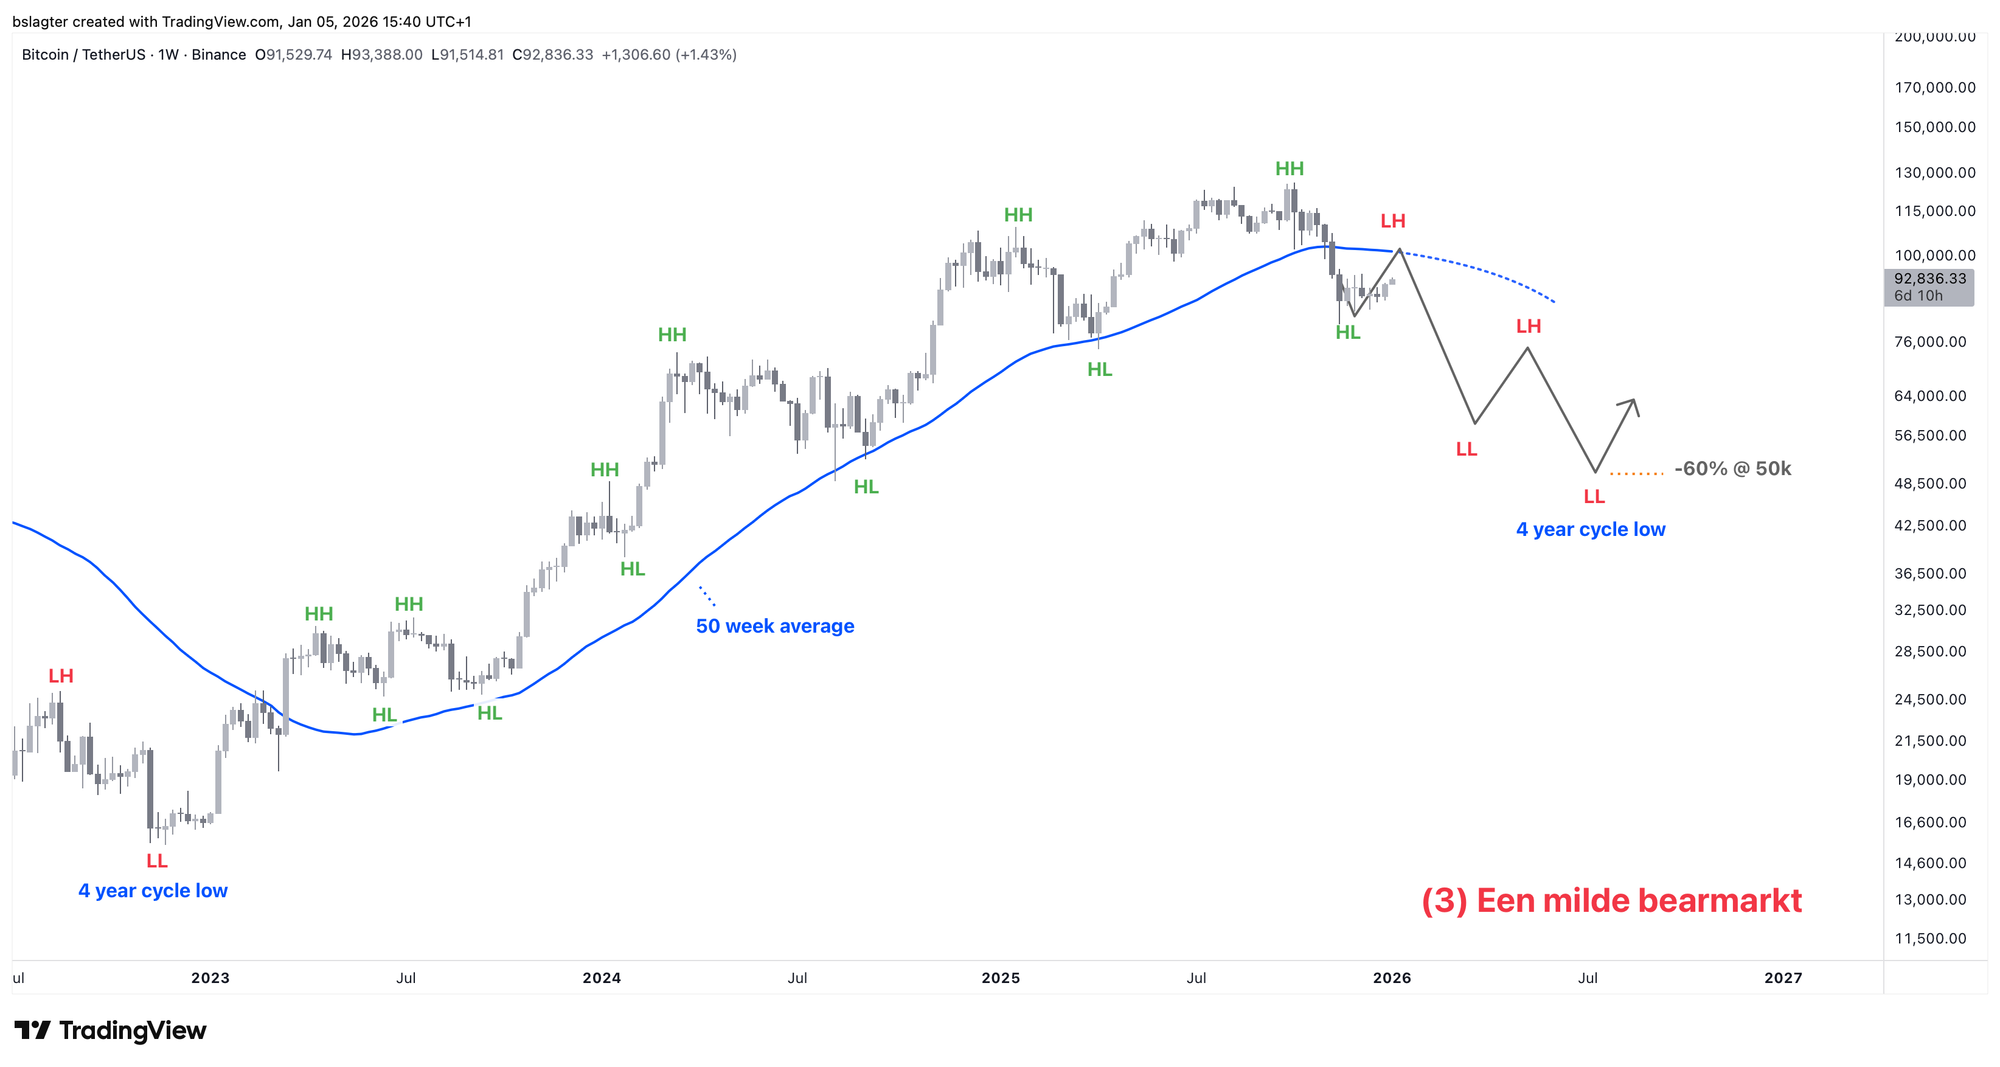
- A mild bear market: 20%
- A deep bear market: 10%
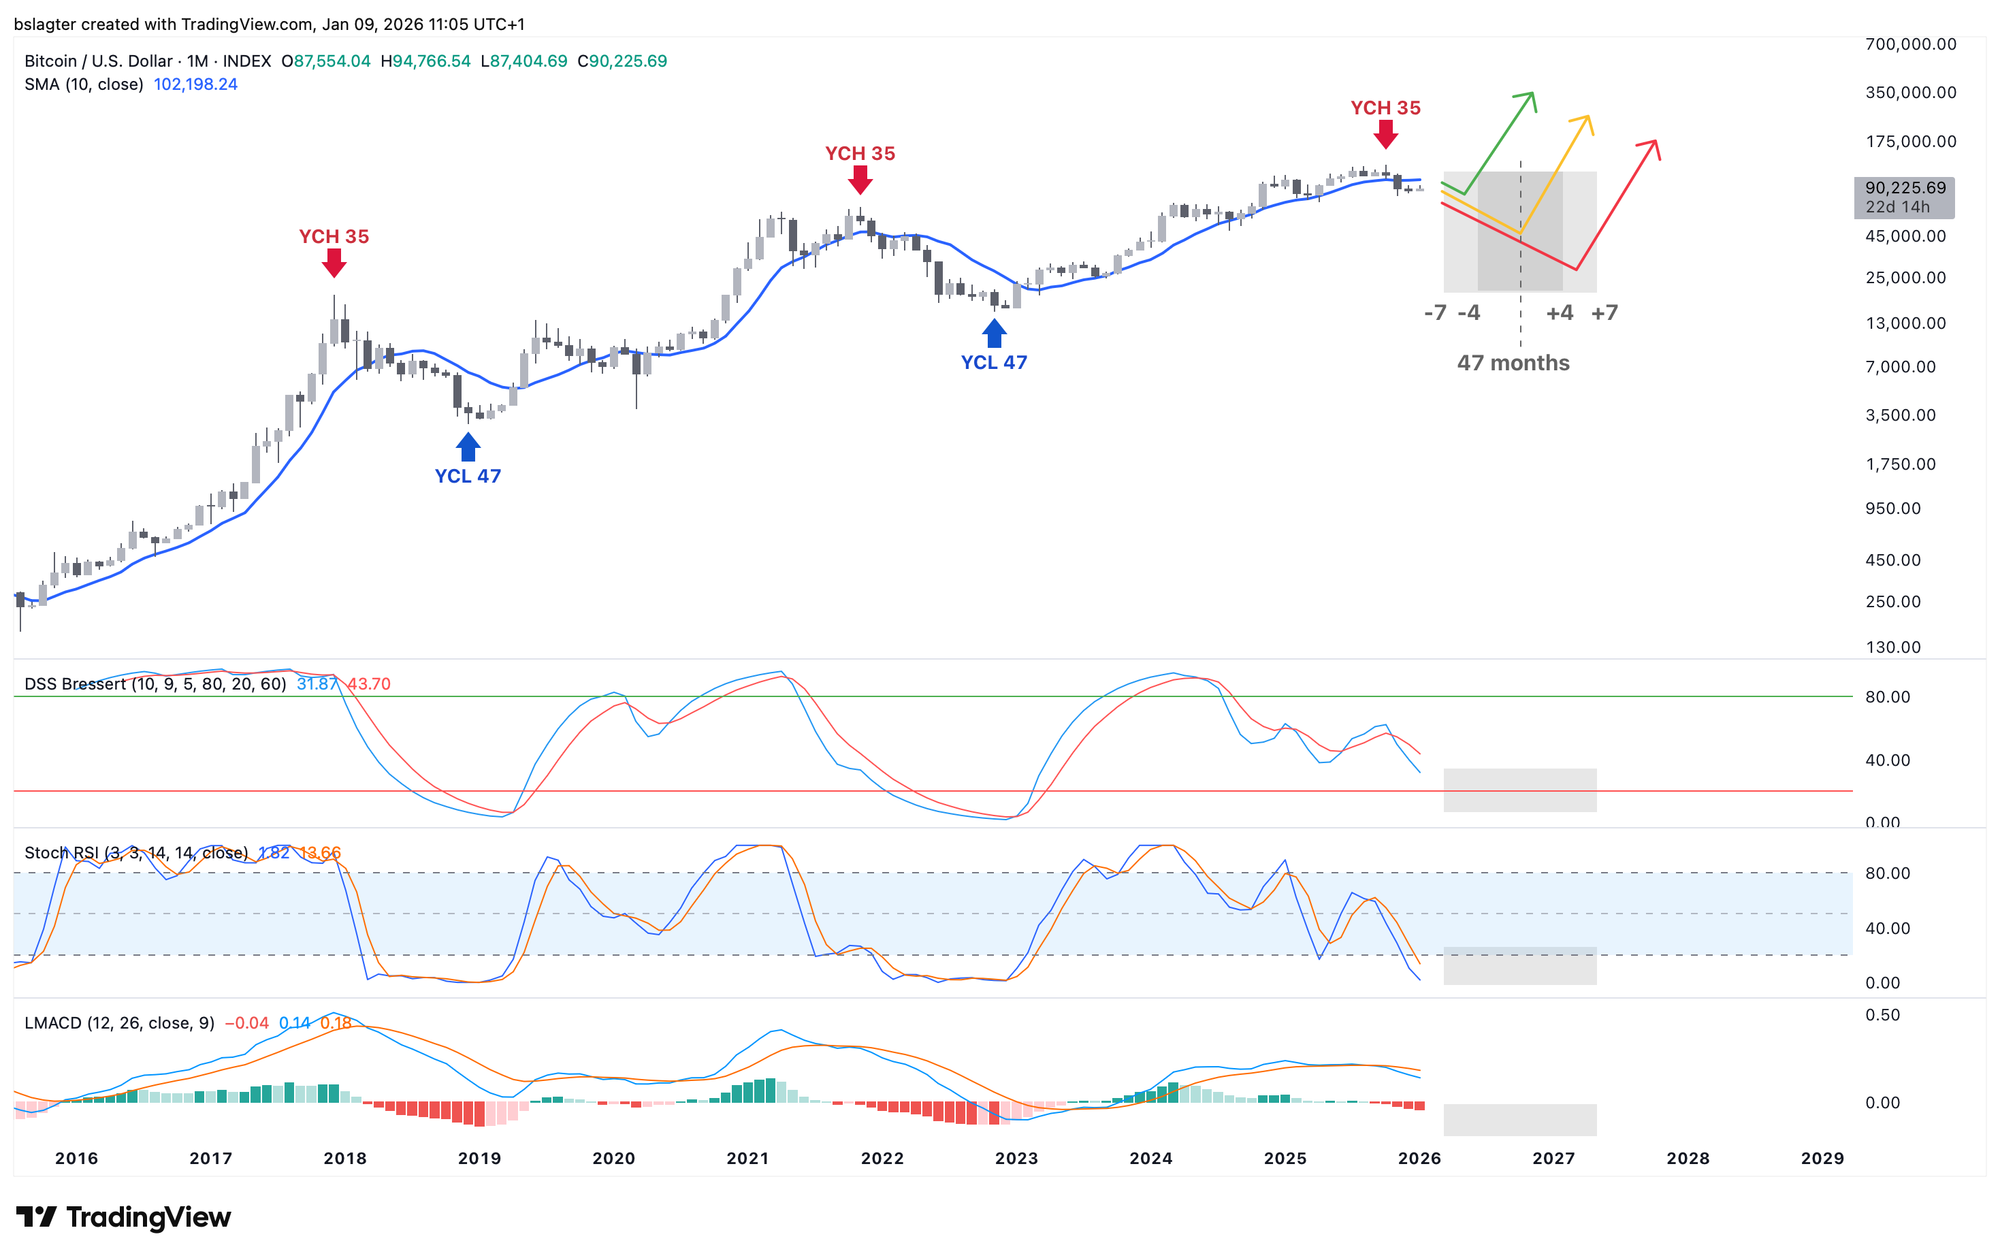
You might think we'd most like to see a continuation of the bull market, the first scenario on the list. But that creates the problem that we still expect a yearly cycle low somewhere roughly between March 2026 and April 2027.
If cycle analysis isn't your thing, an alternative angle would be to think about a bottom in the momentum indicators on the monthly chart, see the chart below. That amounts to the same thing.
But if we're speaking in terms of the yearly cycle, we expect the bottom somewhere around month 47. Cycle analysts often use a spread of 10% to 15% around the average. With 15%, you get a window of March 2026 to April 2027, and with 10%, you land between June 2026 and January 2027.
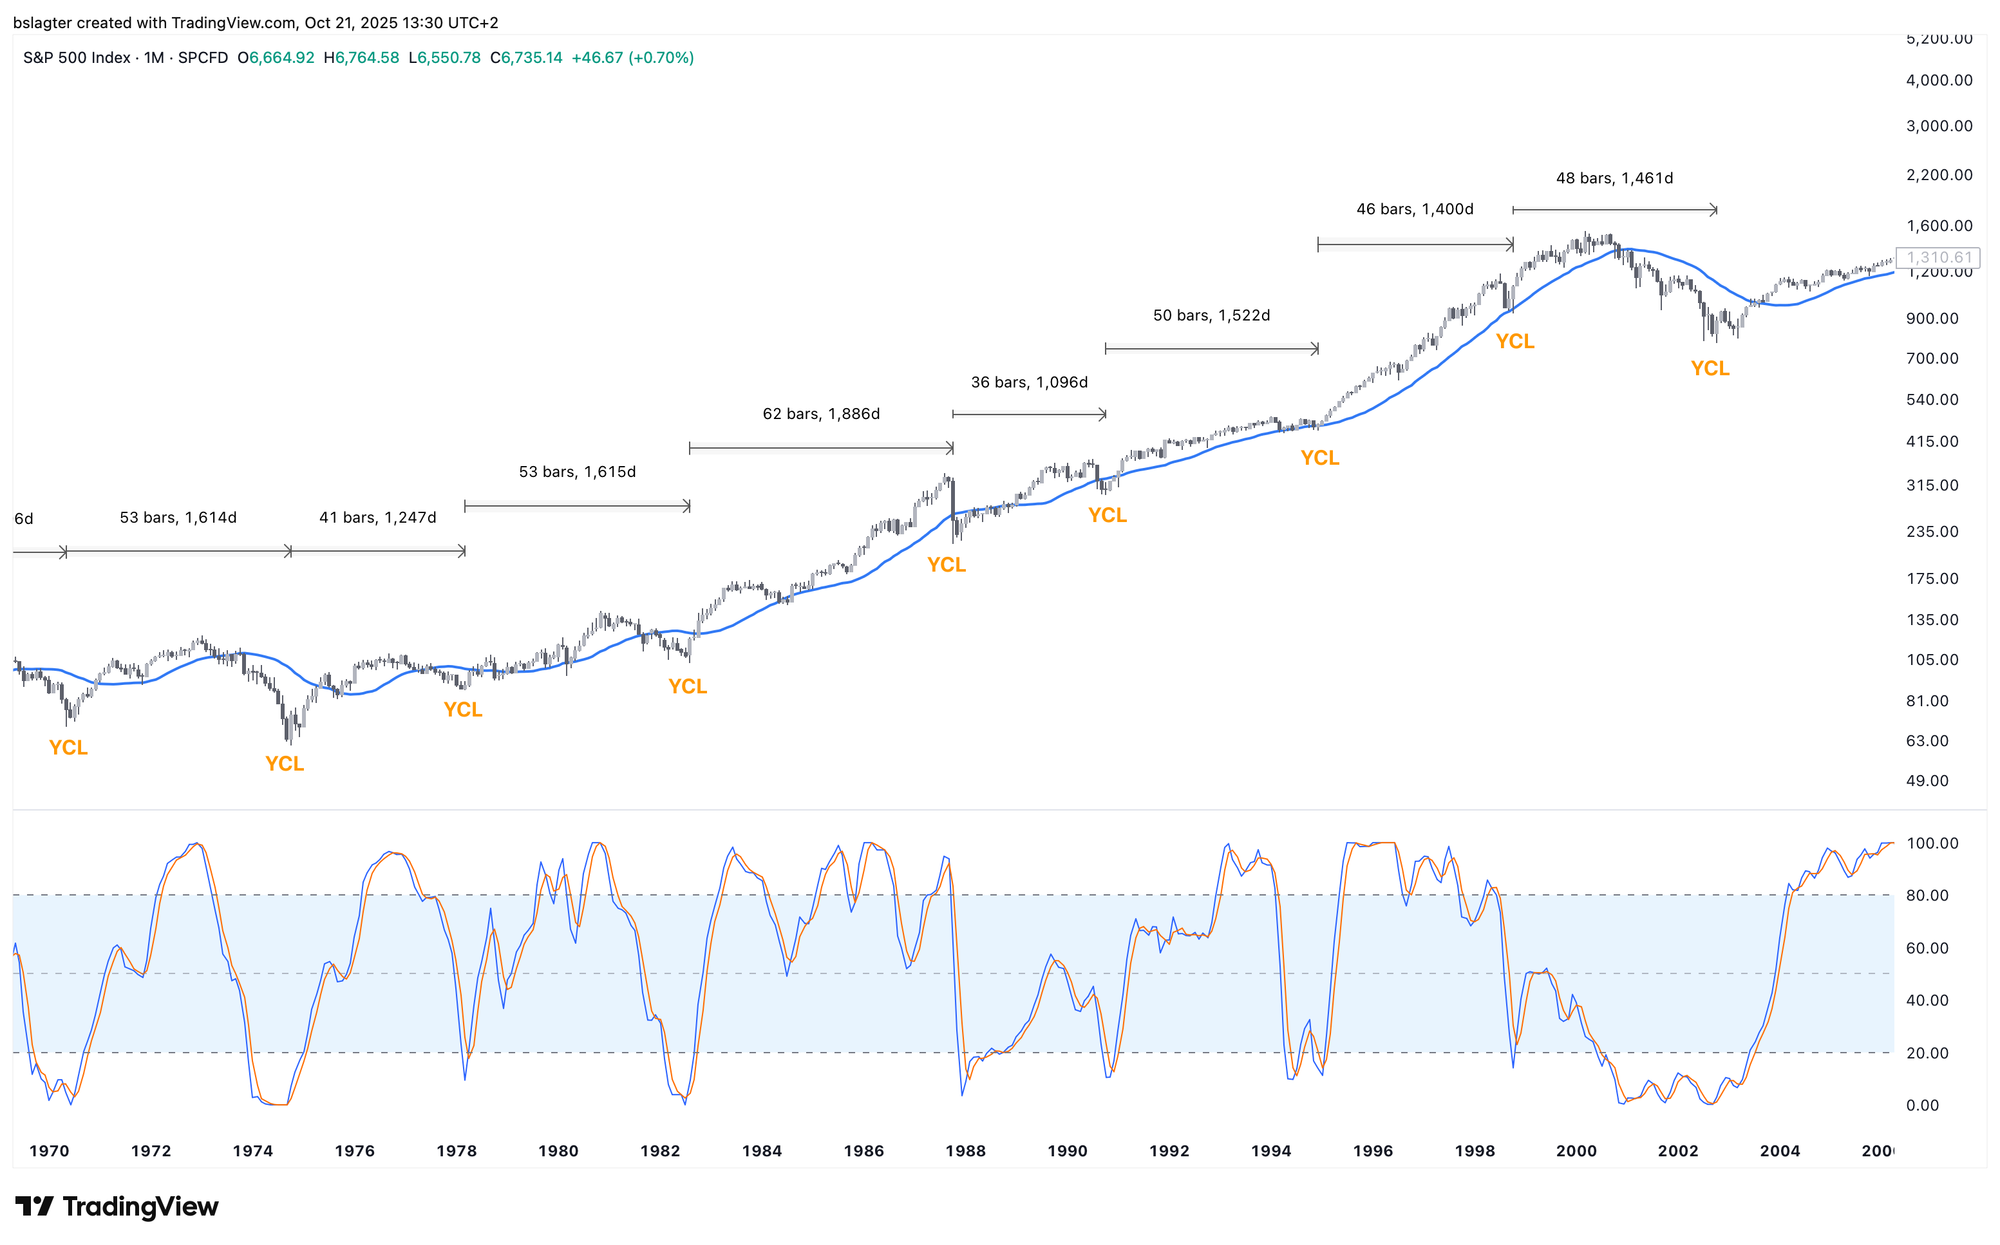
We refer to the section under "The 4-year cycle of the S&P 500" in the Alpha Markets of October 24, 2025 for an example of how the length of a yearly cycle can vary in practice. For convenience, here's the chart that accompanied that section again.
Since we're now in month 38 of this yearly cycle, we'd rather not see a (laborious) continuation of the bull market followed by a bear market anyway. Just rip off the bandaid then. A bear market, and preferably the mildest variant.
We've talked before about two types of corrections: a "correction by price" and a "correction by time." In both cases, there's distribution—the process where existing investors sell to new investors. But in the "by time" variant, there's so much demand that during this rotation, the price doesn't drop much.
We typically use the word correction for the counter-move in an uptrend on the weekly chart. These are periods of a few months where the price gives back part of its gains.
What we call bull and bear markets in bitcoin plays out on a higher timeframe. Corrections are counter-moves in the trend on the weekly chart. Bull and bear markets are the trend on the weekly chart.
We're used to processing the rise on the weekly chart (the bull market) in a "by price" variant of the bear market. While existing investors sell, we give back a significant portion of the price gains. In 2018, the bottom was at -85%, and in 2022 at -77%.
A "bear market by time" would be the variant where existing investors sell to new investors without the price dropping much. Simply because there are many new investors.
Then in a few years, we might observe that we spent 24 months in a relatively narrow price range between $75k and $125k. From November 2024 to November 2026, for example.
This is the second scenario on our list—a trendless period where the price oscillates around the dominant moving average. This scenario would also align with Bitwise's view that we're already in the final stretch of the bear market. See the Alpha Markets of December 12 titled "Have we already been in a bear market for ten months?"

We started this piece noting that we'd like to see a somewhat higher top for this weekly cycle than $100k. That would keep the scenario open that we do indeed get a bear market by time, rather than the traditional bear market by price.
A bear market rally to around $110,000 would be ideal. Investors get excited again, and finfluencers start predicting omega candles once more. But there's still a trip down to follow, to put in a weekly cycle low somewhere in the second quarter—which is also the yearly cycle low and the start of a new market cycle.
2️⃣ An update on our four scenarios
Bert
The four scenarios we shared on November 14 each came with a chart schematically showing how that scenario might unfold.
Below you'll find an update of those charts. None of the scenarios stands out. The price action over the past two months still fits all of them. That explains why we've kept the probabilities unchanged since then.
3️⃣ Bitcoin starts 2026 with a strong foundation
Thom
Bitcoin has started the new year strong. Although reclaiming $90,000 isn't enough to get truly optimistic, the foundation for another strong period in 2026 remains intact.
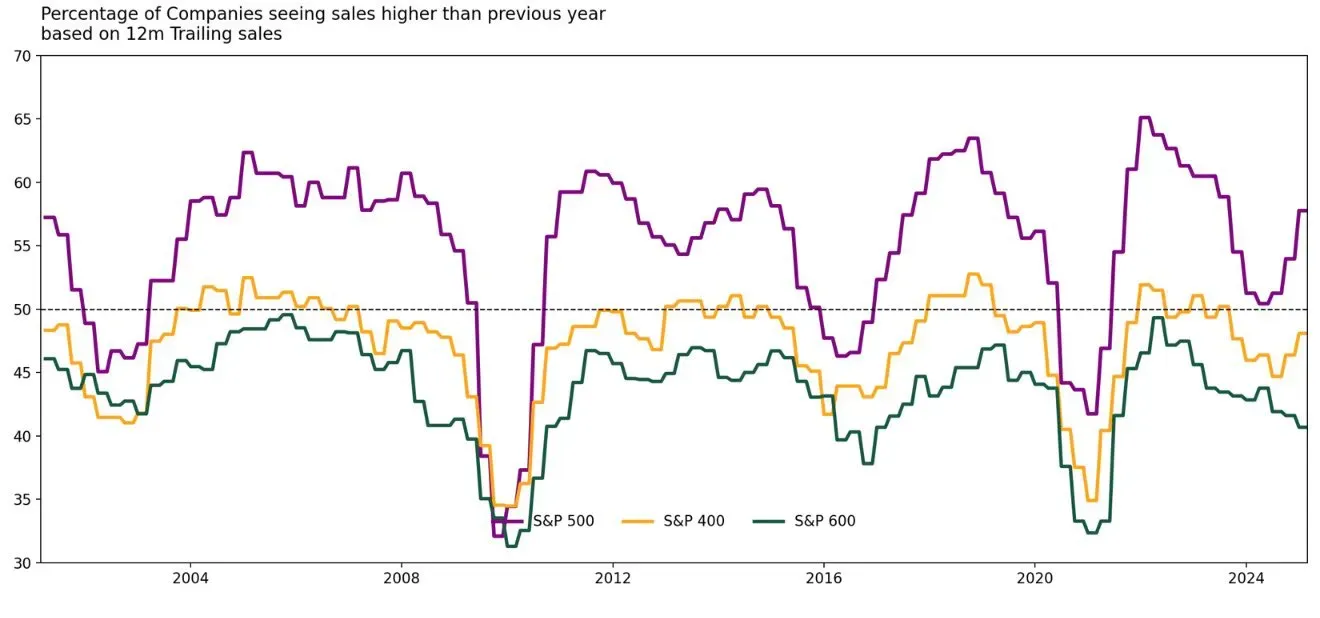
We see that strong foundation reflected in the US stock market, where the S&P 500 recently hit new all-time highs. And it's not just pure speculation—this is evident from the growing revenues of companies, which are fairly broadly supported across the major US exchanges.
Nearly 60% of large companies (S&P 500) saw their revenue grow compared to 12 months ago. For mid-cap companies (S&P 400), that figure was 50%. We're also seeing those percentages climb recently. Only for the smallest publicly traded companies (S&P 600) is there still a negative trend—probably because they're feeling the pinch from the higher interest rates that have been in place since 2022.
While concerns about the US labor market have increased in recent months, the S&P 500 data actually shows some improvement. The percentage of companies hiring is growing relative to the number of companies laying off workers.
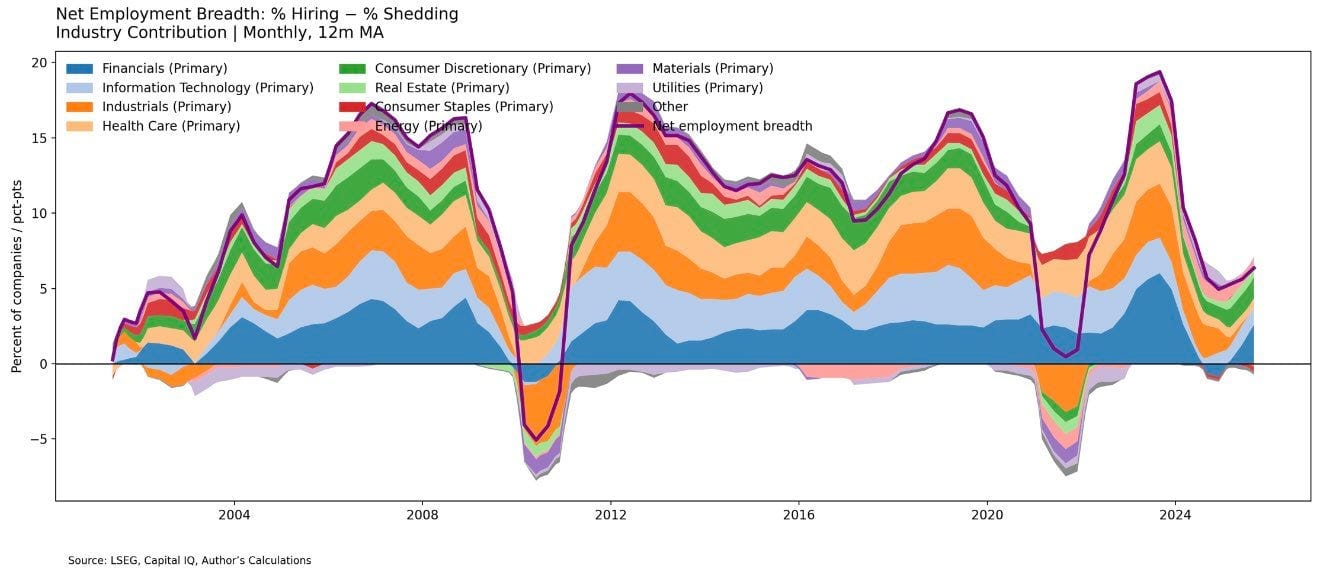
It appears that the weakening of the labor market isn't continuing, that a bottoming process is underway, and that unemployment is stabilizing from here. While an acceleration in economic growth seems unlikely to me right now, with the most recent growth figure of 4.3% (Q3 2025), there's little reason to worry about a recession.
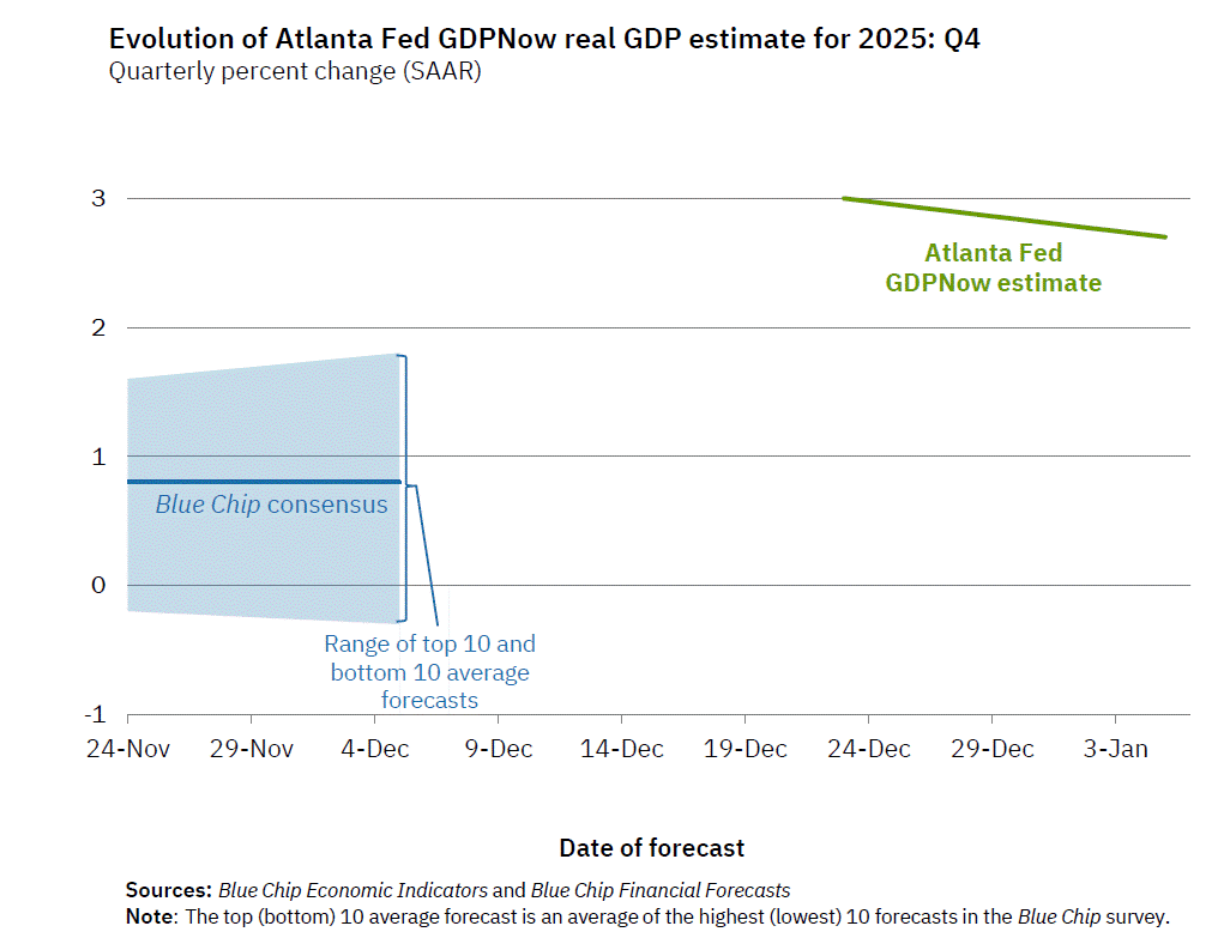
For the fourth quarter of 2025, the Atlanta Fed GDPNow model also projects 2.7% growth. This represents above-average economic growth in the United States, which supports risk appetite among investors—and therefore the bitcoin price.
Combined with the following factors, my base case therefore remains a continuation of the bull market for bitcoin:
- The US central bank is in the midst of a rate-cutting cycle—the debate currently centers on when they'll implement the next cut, not whether rates should be cut at all. This despite stock markets making all-time highs (albeit less convincingly than earlier in the cycle) and inflation still running higher than desired.
- The artificial intelligence hype is still very much alive. The chip stocks are also starting 2026 strong, and I see no reason for AI investments to suddenly dry up.
- Donald Trump can appoint a new chair for the US central bank before May 2026. He also has midterm elections to win in November, for which a strong economy and stock market would come in handy.
This makes it likely, in my view, that 2026 will be another strong year for most asset classes. Hopefully bitcoin can get a piece of that pie too, because last year ended mostly in disappointment—especially when you compare it to gold, for instance.
4️⃣ Volatile first week of 2026
Thom
2026 is only a few days old, but we've already been flooded with a hefty dose of noise. We saw the US power grab in Venezuela, where it strongly appears that the country's massive oil reserves were a key motivator.
Given Trump's desire to lower interest rates on long-term government bonds in particular, it wouldn't be surprising if America uses Venezuelan supplies to push down oil prices. Oil is already cheap and serves as a major input for global inflation, which could theoretically help lower rates and stimulate the economy—along with the further buildout of AI infrastructure.
For now, that's all speculation, but if we look purely at the economic implications, this story seems mostly positive for bitcoin and other risk assets.
We're also getting a lot of new macroeconomic data at the start of the year. We saw mixed results in the labor market. The ADP report (job growth) came in slightly weaker than expected. At the same time, the number of job openings was lower than expected, but we saw a rise in voluntary quits. The latter actually points to confidence.
The best news came from the ISM Services PMI, which showed a score of 54.4. This means the services sector is performing stronger than expected—and that's important because it represents over 65% of Gross Domestic Product (GDP).
Today we'll get a few more important figures in the form of private job growth, wage growth, and unemployment. Next week, the Consumer Price Index (CPI) and Producer Price Index (PPI) are on the agenda, along with US retail sales figures.
All together, this will provide a fairly complete picture of the health of the US economy over the coming weeks—which generally looks solid.
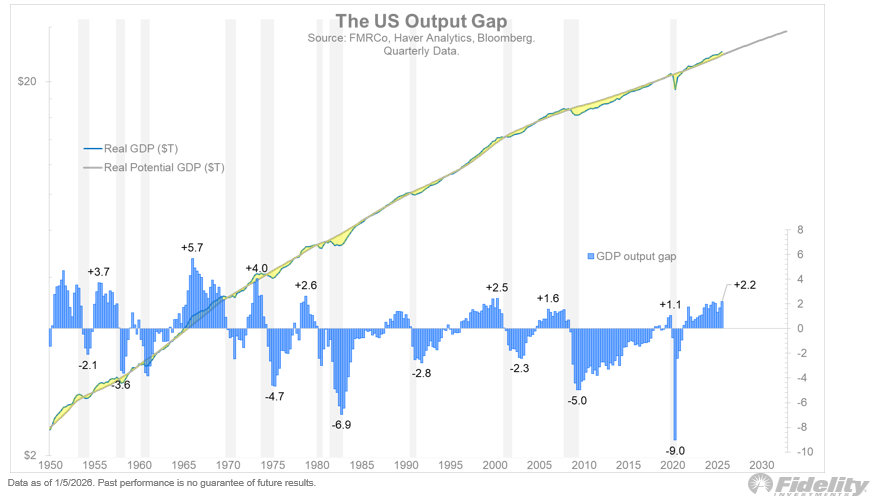
The chart below shows the US Output Gap, which could increase further in 2026 as fiscal stimulus (One Big Beautiful Bill Act, OBBBA) takes effect, the US central bank cuts rates, and expands its balance sheet again.
The US output gap is the difference between what the American economy is currently producing and what it could produce if all people, machines, and factories were being utilized "normally" and efficiently.
Currently, the Output Gap is at its highest level in 25 years. This generally points to a strong economy, which is also needed to extend the bull market in stocks and potentially give bitcoin another push higher. For now, I don't see any clear reasons to assume that 2026 will be a bear market year.
5️⃣ Gold and silver due for a breather?
Bert
What an exceptional year gold and silver have had. Tremendous price gains and extremely positive sentiment. We strongly believe this is just the beginning of a multi-year bull market for precious metals and, more broadly, real assets.
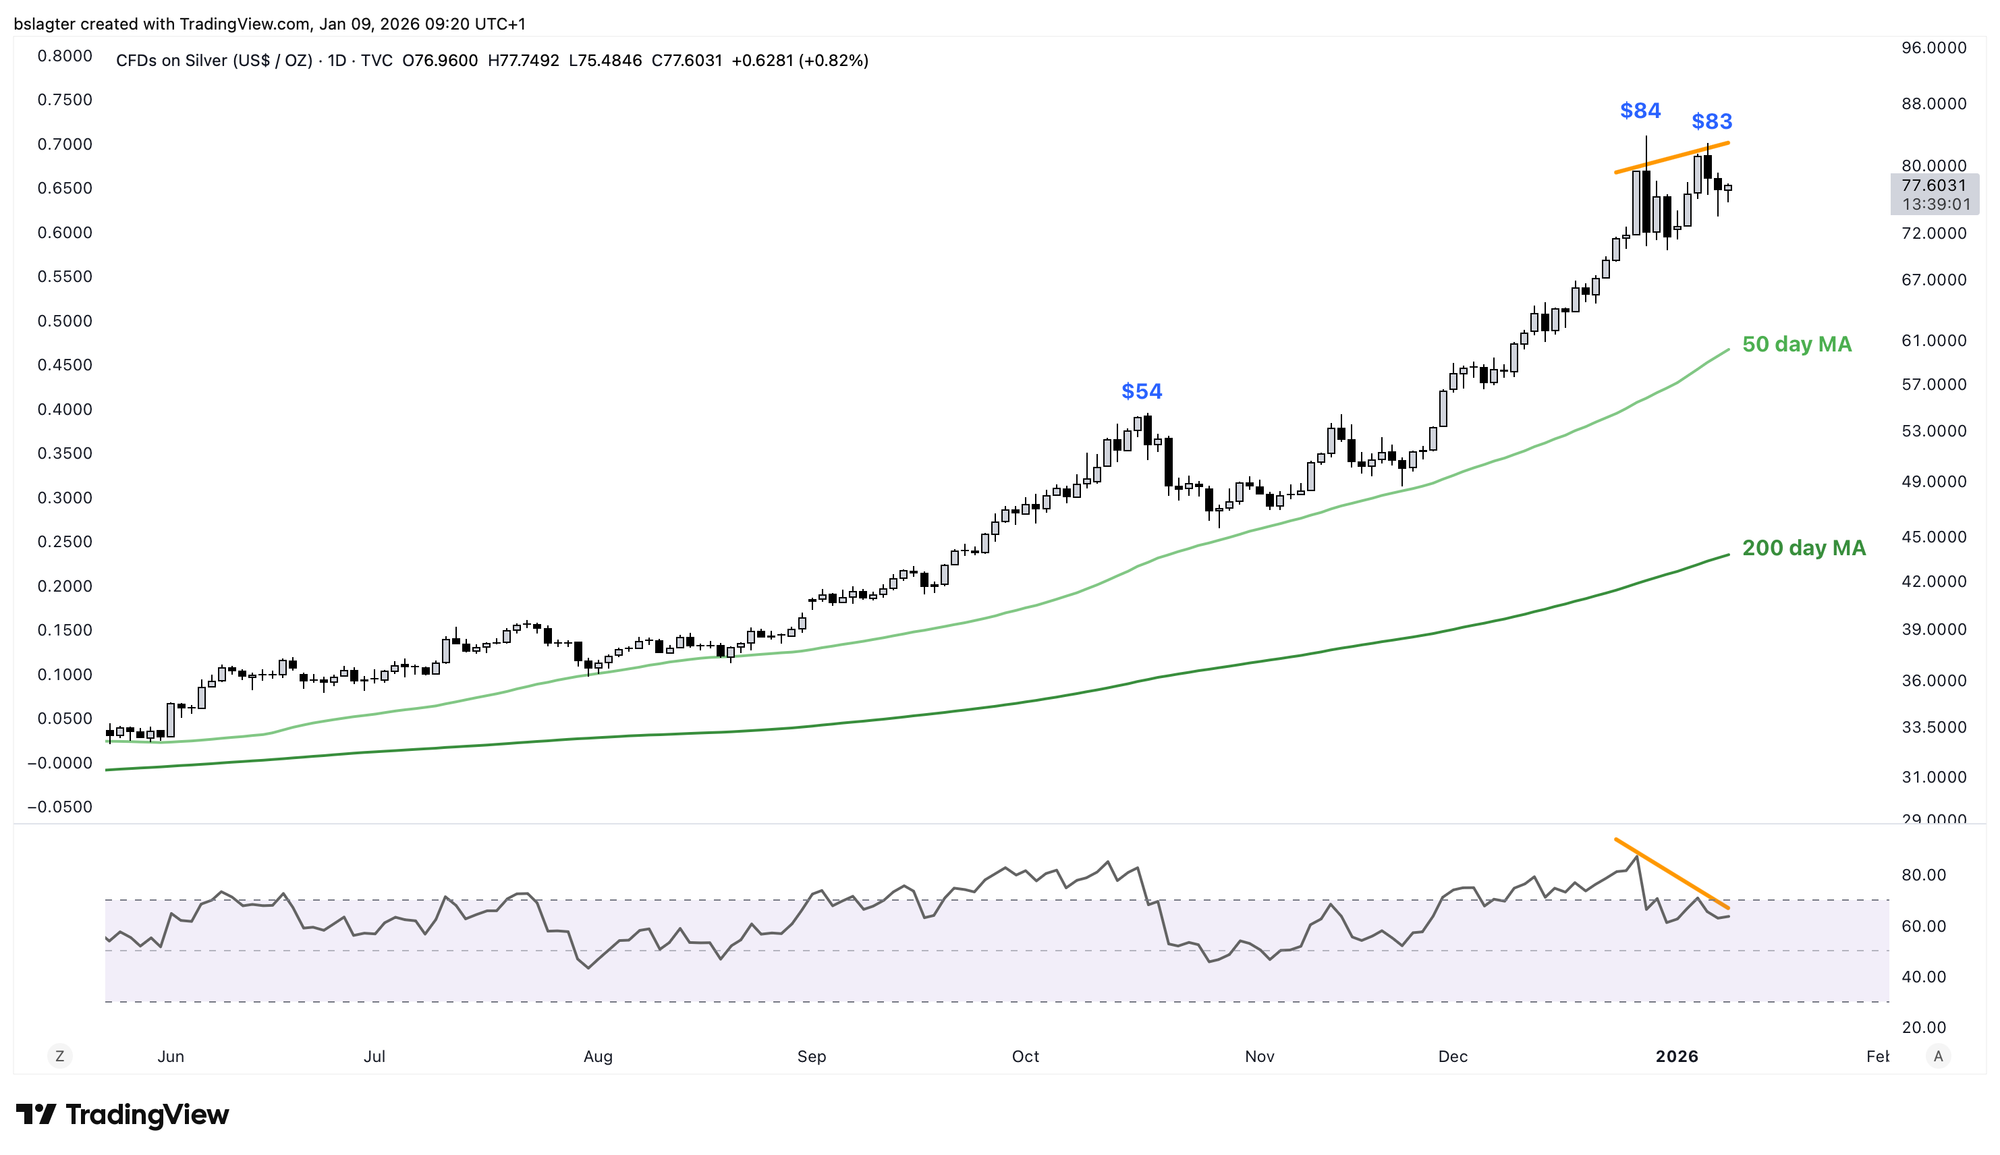
But no bull market is "up only," and it looks like silver and gold are finally due for a correction. Across various timeframes, we're seeing the strength of the trend diminish—for example, through bearish divergence with the RSI.
For silver, it looks like this on the daily chart:
And for gold, it looks like this on the weekly chart:
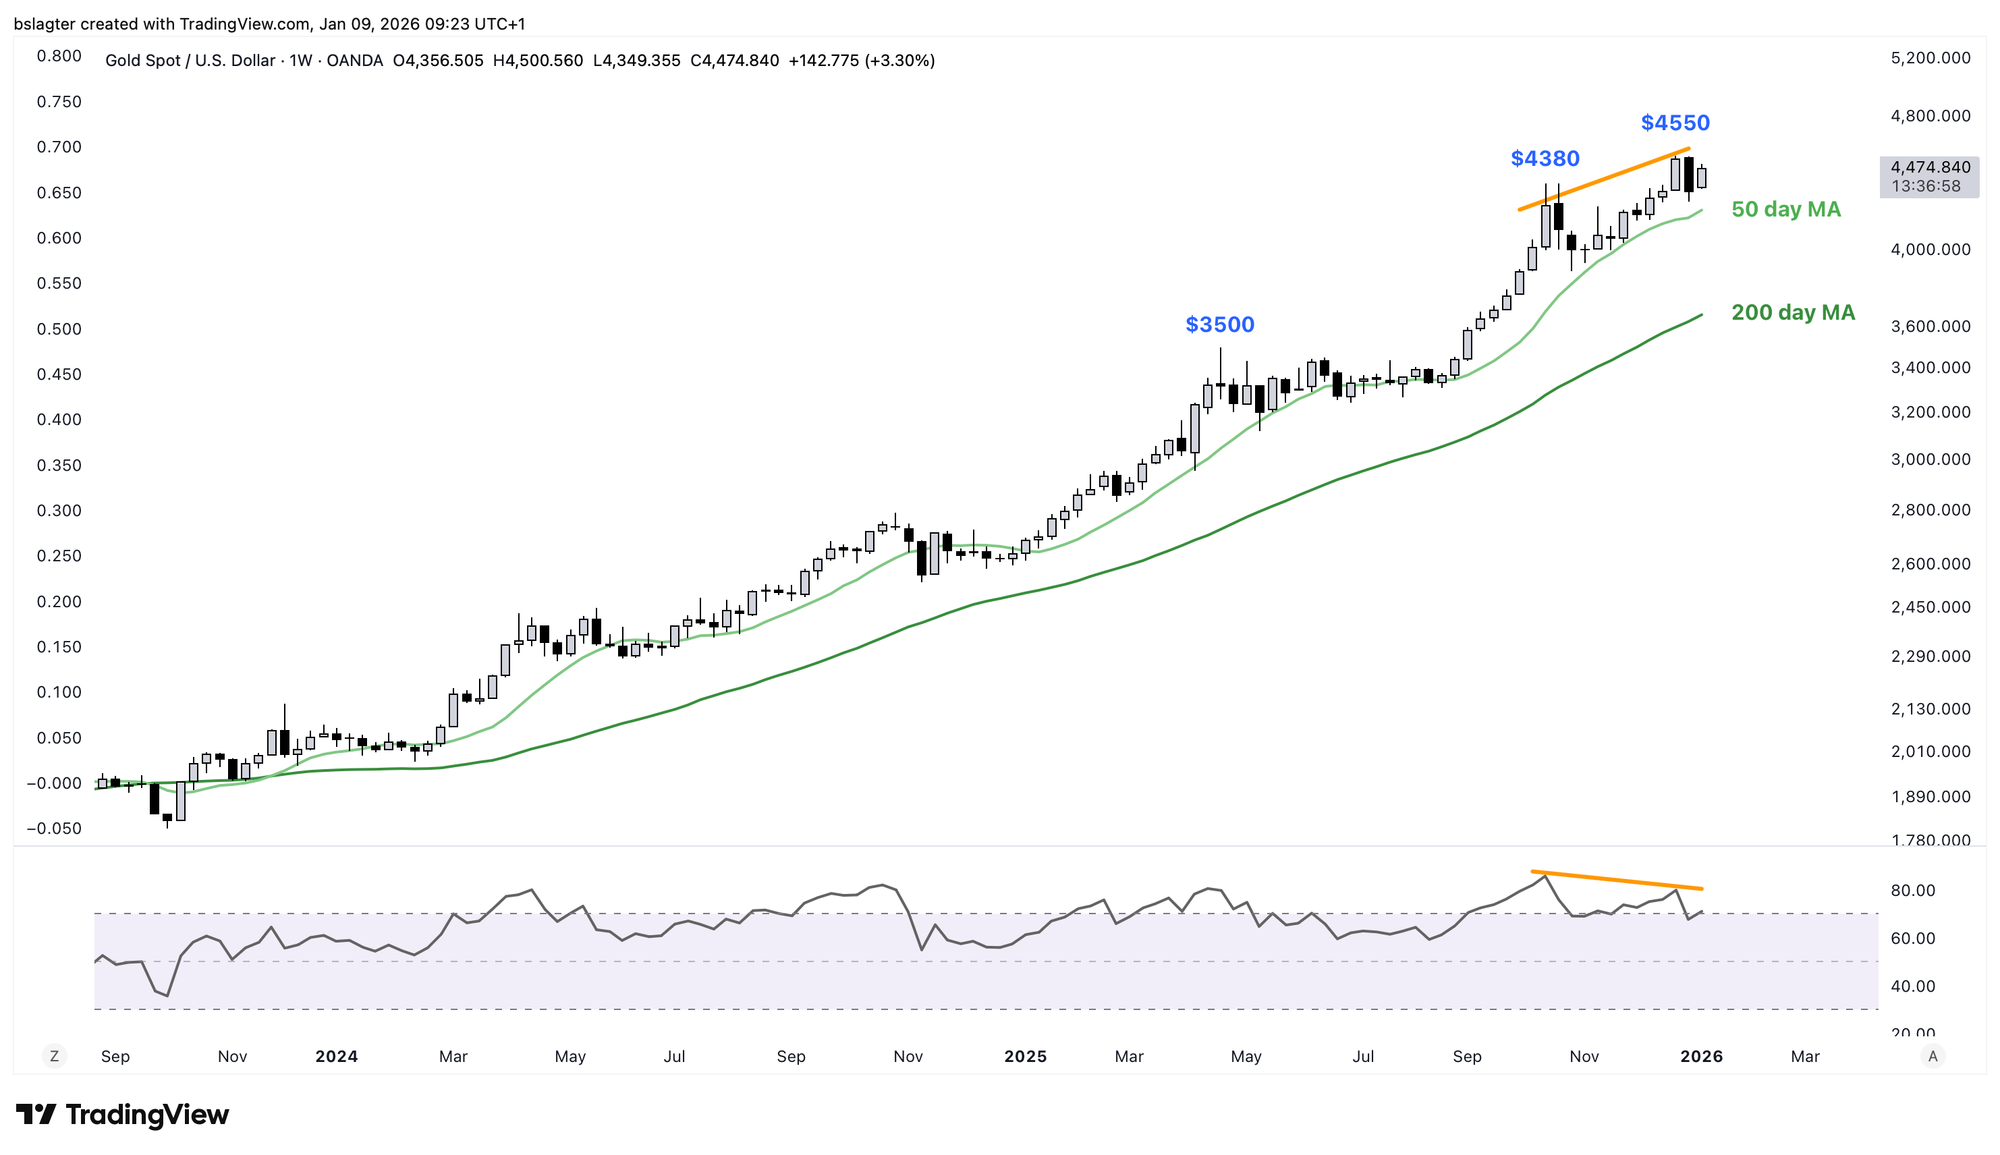
In bull markets, negative divergence can persist for a long time, just like an RSI in "overbought" territory. There can always be another leg up. But I estimate the odds at well above 50% that we'll first see some consolidation over the coming months, and (finally) drop below the 50-day moving average.
Silver in particular could fall hard. Much more than with gold, the price rise there has been driven by speculation. Industrial demand decreases at high prices as users look for alternatives. And production is easier to ramp up than with gold.
With gold, there's also genuinely large structural demand for physical bars, including from central banks. Gold makes up an ever-larger portion of national currency reserves—partly because central banks are buying gold, but mainly because the price of gold is rising.
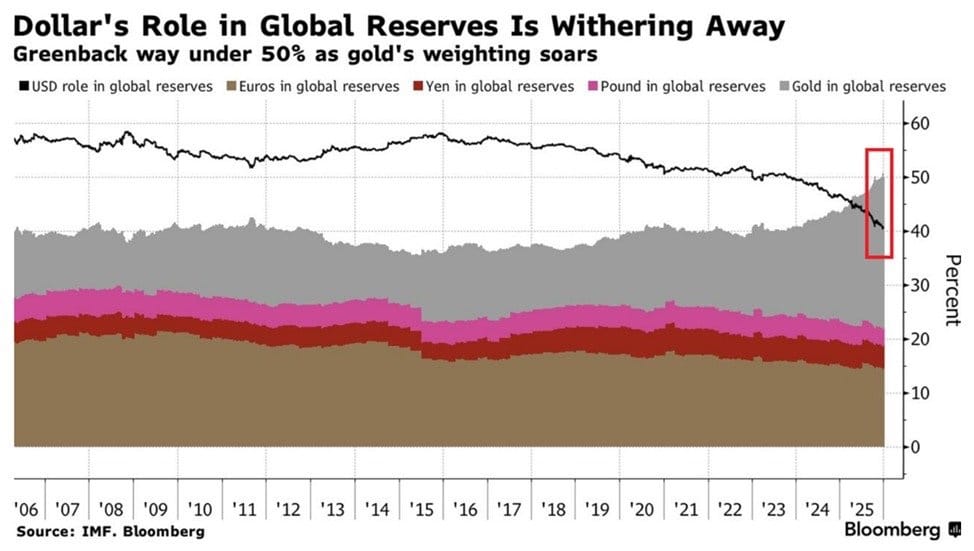
The chart below shows the shift in the composition of reserves. Bloomberg put this headline on it: "The dollar's role in global reserves is crumbling; the greenback's share drops well below 50% while gold's weight rises sharply."
That's not a strong interpretation, in my view. The dollar's role has been declining slightly for years, but the acceleration in recent years isn't because central banks are adding gold and dumping dollars. They are doing that, but not in amounts visible in this chart. The acceleration is almost entirely attributable to the doubling of the gold price.
The role gold plays in the global monetary system is increasing rapidly and will likely continue to do so in the coming years. But not primarily because central banks are buying so much gold—mainly through a repricing of government money.
In closing
All previous editions of Alpha Markets can be found in the archive. Questions, comments, and suggestions are always welcome in the community.
Thank you for reading!
To stay informed about the latest market developments and insights, follow our team members on X:
- Bart Mol (@Bart_Mol)
- Peter Slagter (@pesla)
- Bert Slagter (@bslagter)
- Mike Lelieveld (@mlelieveld)
We appreciate your continued support and look forward to bringing you more comprehensive analysis in our next edition.
Until then!